

Abstract
Directed cell migration is mediated by cycles of protrusion, adhesion, traction generation on the extracellular matrix and retraction. However, how the events after protrusion are timed, and what dictates their temporal order is completely unknown. We used acute epidermal growth factor (EGF) stimulation of epidermal keratinocytes to initiate the cell migration cycle to study the mechanism of the timing of adhesion, traction generation, and de-adhesion. Using microscopic and biochemical assays, we surprisingly found that at ∼2 min after EGF stimulation protrusion, activation of myosin-II, traction generation, adhesion assembly, and paxillin phosphorylation occurred nearly simultaneously, followed by a 10-min delay during which paxillin became dephosphorylated before cell retraction. Inhibition of myosin-II blocked both the EGF-stimulated paxillin phosphorylation and cell retraction, and a paxillin phosphomimic blocked retraction. These results suggest that EGF-mediated activation of myosin-II acts as a mechanical signal to promote a cycle of paxillin phosphorylation/dephosphorylation that mediates a cycle of adhesion strengthening and weakening that delays cell retraction. Thus, we reveal for the first time a mechanism by which cells may temporally segregate protrusion, adhesion, and traction generation from retraction during EGF-stimulated cell migration.
INTRODUCTION
Directed cell migration is mediated by integration of the biophysical processes of protrusion, adhesion, traction generation on the extracellular matrix (ECM), and retraction (Lauffenburger and Horwitz, 1996). Much emphasis has been placed on delineating the spatial control of these processes. However, equally important is their temporal control (Giannone et al., 2004; Ji et al., 2008). The timing of protrusion, adhesion, traction generation, and retraction with respect to each other is critical, because they must occur cyclically in order to drive cell migration (Lauffenburger and Horwitz, 1996). How does the cell control such timing? One possibility is that there may be overlying regulatory mechanisms not involved in the processes themselves, like checkpoints in the cell division cycle. However, processes of the cell migration cycle, particularly adhesion, traction generation, and retraction are intimately coupled by feedback loops between one another (Burridge and ChrzanowskaWodnicka, 1996). Their interconnected regulation kinetically couples these processes, suggesting different principles than checkpoints are controlling their temporal ordering. Here, we focus on identifying the mechanism of temporal regulation of adhesion, traction generation and retraction.
Traction generation and retraction are intrinsically interdependent because they both involve regulating the strength of two components: contraction and adhesion. Traction for pulling the cell body forward requires coupling contraction force generated by myosin motors in the cytoskeleton to adhesion to the ECM via integrin-mediated focal adhesions (FAs). Retraction requires release of FAs and transmission of contractile forces through the cytoskeleton to mechanically pull protrusions in toward the cell body. Thus, in order to mediate traction, adhesion must be stronger than contraction, whereas in order to mediate retraction, adhesion must be weaker than contraction. Contraction during cell migration is thought to be primarily mediated by myosin-II motors, which are activated by phosphorylation of their myosin-II regulatory light chains (MRLC; Adelstein and Conti, 1975) by kinases such as rho-kinase (ROCK; Amano et al., 1996) and myosin light chain kinase (MLCK; Pires et al., 1974). Adhesion can be regulated by signaling networks that change FA protein composition and phosphorylation state, strengthening or weakening FAs (Shi and Boettiger, 2003; Zaidel-Bar et al., 2007b). These same signaling networks can also modulate myosin-II contractile activity (Burridge and ChrzanowskaWodnicka, 1996). Because FAs are mechanosensitive (Bershadsky et al., 2003), their biochemical status is dependent on the level of force impinged on them (Giannone and Sheetz, 2006). Below some threshold of adhesion strength, both externally applied or myosin-II–mediated internally applied contractile forces on FAs promotes their growth (Rottner et al., 1999; Riveline et al., 2001; Galbraith et al., 2002). However, above that threshold, force detaches FAs by breaking either the actin–adhesion or adhesion–ECM linkages (Palecek et al., 1996; Hu et al., 2007). Consequently, the proper timing of traction generation and retraction with respect to each other during cell migration must involve a complex interplay between mechanical and biochemical signals that regulate the relative strengths of contraction and adhesion.
During cell migration, integrin-based FAs go through an assembly-maturation-disassembly cycle (Zamir and Geiger, 2001). FA maturation has been implicated in such diverse cellular responses as migration (Beningo et al., 2001), epithelial morphogenesis (Paszek et al., 2005) and stem cell differentiation (Engler et al., 2006). During migration, FAs are initiated as tiny focal complexes that assemble underneath the lamellipodium. A subpopulation of focal complexes disassembles within minutes, and the remainder grow into mature FAs (Choi et al., 2008). These mature FAs then either disassemble within 10–20 min or mature further into stable fibrillar adhesions that do not promote migration, but mediate ECM remodeling (Laukaitis et al., 2001; Zaidel-Bar et al., 2003). FA maturation is thought to inhibit cell migration and has been loosely defined as a morphological change in which FAs elongate and recruit more protein. Along with this morphological change is a less well-defined process of compositional change (Zamir and Geiger, 2001; Zamir et al., 2008). Of the 156 known FA components (Zaidel-Bar et al., 2007a), only a handful are known to be specific for a FA maturation state. For example, focal complexes contain αvβ3 integrin, paxillin, focal adhesion kinase (Fak), and talin, whereas mature FAs additionally contain vinculin, vasp, and α5 integrin, and fibrillar adhesions additionally contain tensin (Laukaitis et al., 2001; von Wichert et al., 2003; Zaidel-Bar et al., 2003). Driving this maturation is FAK down-regulation leading to the dephosphorylation of paxillin on tyrosines 31 and 118, which in turn promotes FA stability and recruitment of tensin (Zaidel-Bar et al., 2007b). FA maturation may also regulate biophysical properties. Small, immature FAs transmit more traction force per unit area to the ECM, and thus may adhere more tightly, than do larger, mature FAs, allowing them to resist protrusive forces (Beningo et al., 2001; Ji et al., 2008). The time required for FA maturation, as well as the changes it induces in adhesion strength suggest that maturation may not only slow migration, but also could set the timing of when contraction promotes traction generation versus retraction.
Because promigratory growth factors activate signaling pathways involved in contraction and FA protein phosphorylation and dephosphorylation, it is possible that growth factors could control FA maturation as a means of modulating cell migration. Epidermal growth factor (EGF) is a well-characterized growth factor that stimulates epidermal keratinocyte migration during wound healing (Li et al., 2004). Acute EGF stimulation is a widely used model to induce cell migration in culture (Segall et al., 1996; Wells et al., 1998). Indeed, much is known about how EGF promotes kinetically defined phases of actin polymerization to drive lamellipodial protrusion in the first step of the migration cycle (Mouneimne et al., 2004). However, less is known about how EGF regulates the timing of adhesion, traction generation, and de-adhesion. It is known that EGF induces phosphorylation of MRLC through MLCK to promote myosin-II contraction in fibroblasts (Iwabu et al., 2004). However, in epithelial cells, EGF stimulation also activates Rho GTPase (Russell et al., 2003), which promotes ROCK to activate myosin-II by phosphorylating MRLC (Amano et al., 1996) and phosphorylating and inactivating myosin-II phosphatase (Kimura et al., 1996). EGF also increases the amount of morphologically immature focal complexes and decreases the amount of morphologically mature FAs (Bailly et al., 1998; Xie et al., 1998). This is thought to be mediated by Erk through calpain to promote proteolysis of FA proteins and thus drive adhesion disassembly (Xie et al., 1998). EGF also alters phosphorylation of Fak and paxillin; however, the context or timing of this regulation may be important because reports differ as to whether EGF promotes phosphorylation or dephosphorylation of these proteins (Tapia et al., 1999; Sieg et al., 2000; Lu et al., 2001). In spite of this knowledge, the kinetics of EGF-stimulated contractile and adhesive functions that promote cell migration are not well understood, and it is unknown whether effects of EGF on adhesion are mediated biochemically or mechanically.
Here, we use acute EGF stimulation of epidermal keratinocytes to study the timing of events in the cell migration cycle. We characterize a myosin-II–dependent cell retraction response to EGF stimulation that is temporally delayed relative to protrusion. Using microscopic and biochemical assays, we surprisingly find that EGF stimulates several events of the cell migration cycle near simultaneously, including protrusion, myosin-II activation, increases in traction force generation and the formation of immature FAs, rich in tyrosine-phosphorylated paxillin. We find that inhibition of myosin-II blocks the EGF-stimulated increase in paxillin phosphorylation and instead causes an immediate paxillin dephosphorylation. Inhibition of paxillin dephosphorylation by introduction of Y31E/Y118E-paxillin in a paxillin-depleted background inhibits retraction. This suggests that EGF-mediated activation of myosin-II acts as a mechanical signal to promote paxillin phosphorylation that is required for a period of FA maturation that delays adhesion weakening relative to increases in traction generation. This may serve as a mechanism by which the cell temporally segregates adhesion and traction generation from retraction during EGF-stimulated cell migration.
MATERIALS AND METHODS
Cell Culture and Reagents
HaCat cells, a human epidermal keratinocyte line, were grown at 37°C in 5.0% CO2 and 95% air in growth media (DMEM, Invitrogen, Carlsbad, CA) with penicillin and streptomycin (Invitrogen) and 10% fetal bovine serum (FBS; Invitrogen). In all experiments, cells were serum-starved in growth medium lacking FBS but containing 1 mg/ml fatty-acid–free bovine serum albumin (BSA; Sigma, St. Louis, MO). Imaging experiments were conducted using imaging medium composed of starvation medium without phenol red and with 50 mM HEPES. An aqueous stock of human recombinant EGF (Peprotech, Rocky Hill, NJ) in 1 mg/ml BSA was diluted into medium before stimulation. Pharmacological inhibitors and antibodies used were as follows: blebbistatin (30 μM, Toronto Research Chemicals, Toronto, ON, Canada), Y-27632 (10 μM, Calbiochem, Gibbstown, NJ), ML-7 (20 μM, Calbiochem), mouse-anti pS19-MRLC (Cell Signaling Technology, Beverly, MA), mouse-anti MRLC (MY-21, Sigma), rabbit-anti pY118-paxillin (Biosource, Camarillo, CA), mouse-anti paxillin (349, BD Biosciences, San Jose, CA), rabbit-anti myosin-IIA heavy chain (Biomedical Technologies, Stoughton, MA), mouse-anti actin (C4, J. Lessard, University of Cincinnati), mouse-anti GFP (7.1 and 13.1, Roche, Indianapolis, IN), PP2 (10 μM, Calbiochem), TS2/16 (1–2 mg/ml, Pierce, Rockford, IL), P5D2 (ascites, from Mark Ginsberg, University of California, San Diego), calpeptin (10 μM, Calbiochem), calpain inhibitor I (10 μM, Calbiochem), TAC554PS (1 μM, from David Schlaepfer, University of California, San Diego), PD-098059 (10 μM, Calbiochem), cell permeable C3 transferase (0.2 μg/ml, Cytoskeleton, Denver, CO). Paxillin was knocked down using siRNA oligos for human paxillin (ON-TARGETplus SMARTpool, Dharmacon, Boulder, CO) transfected into cells using electroporation (Amaxa, Gaithersburg, MD). The paxillin constructs: paxillin-enhanced green fluorescent protein (EGFP), Y31/118E-paxillin-EGFP, and Y31/118F-paxillin-EGFP were based on the original sequence for avian paxillin-EGFP (Laukaitis et al., 2001), but were generated by synthesis (Blue Heron Biotechnology, Bothell, WA) and included mutations rendering an internal translation site of avian paxillin dead, as documented elsewhere (Tumbarello et al., 2005).
Western Blotting
Cells in 60-mm dishes, plated for 2 d, were serum-starved 4–6 h before EGF stimulation and pretreated with inhibitors, where indicated. After EGF stimulation, cells were washed in cold PBS (Invitrogen) with 1 mM Na3VO4 and 5 mM NaF, lysed in sample buffer (62.5 mM Tris-HCl, pH 6.8, 2% SDS, 10% glycerol, 705 mM β-mercaptoethanol, and 0.05% bromophenol blue), boiled, and frozen. Western blots were blocked with TBS-Tween (15.4 mM Tris-HCl, pH 7.5, 137 mM NaCl, and 0.1% Tween-20) containing 5% lowfat milk or 3% BSA, probed with antibodies and developed using chemiluminescence (ECL, Amersham, Piscataway, NJ; or Immobilon chemiluminescent substrate, Millipore, Bedford, MA). Digital images of Western blot bands were quantified with Metamorph software (Molecular Devices, Sunnyvale, CA) after performing local background subtraction around bands of interest.
Immunofluorescence
Cells were plated on untreated no. 1.5 coverslips in the presence of serum and 2 d later were serum-starved 4–6 h before EGF stimulation, pretreated with inhibitors where indicated, and fixed at given time points after EGF addition. Cells were washed in warm cytoskeleton buffer (10 mM MES, 3 mM MgCl2, 138 mM KCl, and 2 mM EGTA), fixed with 4% PFA (Electron Microscopy Sciences, Fort Washington, PA), followed by permeabilization with 0.5% Triton-X. Free aldehydes were reacted with 0.1 M glycine, and cells were washed, blocked in 2% BSA TBS-Tween containing Alexa-488 phalloidin (Invitrogen, Carlsbad, CA) and incubated with primary antibodies. Cells were washed, incubated with fluorophore-conjugated secondary antibodies (Jackson ImmunoResearch Laboratories, West Grove, PA), washed again, mounted on a slide in Dako mounting media (Molecular Probes), and sealed with nail polish. Fixed cells were imaged on an inverted microscope (60×, 1.4 NA objective, TE-300, Nikon, Melville, NY; or 100×, 1.45 NA, Axiovert 200M, Zeiss, Thornwood, NY) using an Orca II cooled CCD (Hamamatsu, Bridgewater, NJ). FAs were quantified by thresholding the cell by eye and drawing regions around each FA in Metamorph. The normalized fluorescence in FAs was calculated by dividing the background-subtracted average fluorescence in the FA by the background-subtracted average cytosolic fluorescence.
Transmitted Light Microscopy
Coverslips of serum-starved cells prepared as above were mounted in imaging media in a perfusion chamber (Warner Instruments, Hamden, CT) on an inverted microscope with either low-resolution phase-contrast (20×, 0.5NA, TE-200, Nikon) or high-resolution differential interference contrast (DIC; 100×, 1.45 NA, TE-2000-U, Nikon) optics. Images were taken with an Orca 285 (Hamamatsu) or Orca II-ERG (Hamamatsu) cooled CCD. The stage was heated to 37°C with an airstream incubator (Nevtek, Burnsville, VA) or the perfusion chamber heater. EGF, 5 nM, in culture media was then perfused over the cells while imaging. Cell area was determined by drawing regions around the cell at different time points in Metamorph. The fraction of cells that retracted was calculated by examining four kymographs (5-pixel width) produced from four different cell edge locations in each cell. If the cell edge did not retract in three or four of these kymographs, cell retraction was scored as negative.
Total Internal Reflection Fluorescence Microscopy
Cells were transfected with either paxillin-mCherry or paxillin-EGFP (from A. R. Horwitz, University of Virginia) using Fugene6 (Roche) or Lipofectamine (Invitrogen) and prepared for imaging as above. Cells were imaged using through-the-objective total internal reflection fluorescence (TIRF) microscopy (100×, 1.45 NA, TE-2000-U, Nikon) with an evanescent field depth of ∼150 nm using the microscope described in detail elsewhere (Adams et al., 2004).
To determine the normalized level of fluorescent paxillin in FAs, raw images were aligned using a correlation-based alignment tool (Lin Ji and Gaudenz Danuser, Scripps, unpublished results), median filtered and background flattened with kernels of 5 × 5 using Metamorph software. A threshold-based segmentation was used to create a FA mask. The average fluorescence (FFA) and area (AFA) of masked FAs, as well as cytosolic fluorescence (Fcyt) of the area within the cell but outside of masked FAs were all measured over time. The normalized fraction of paxillin in FAs is given by the following equation:
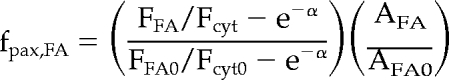 |
where α is the ratio of the thickness of the FA to the thickness of the evanescent wave field (e−α was chosen to be 0.75). The derivation and estimation of parameters are shown in the Appendix in Supplemental Materials.
Traction Microscopy
Flexible polyacrylamide substrates were generated as described previously (Pelham and Wang, 1997). Briefly, 22-mm × 30-mm no. 1.5 coverslips were activated by serial treatments of 0.1 M NaOH, 5% 3-aminopropyltrimethyloxysilane, and 0.5% glutaraldehyde, and each treatment was followed by extensive ddH2O washing. Activated coverslips were inverted onto a 10–15-μl drop of 0.11% bis and 7.5% acrylamide, TEMED, and ammonium persulfate containing 0.2 μm far-red beads (Molecular Probes), producing an 8–20-μm thick, 3-kPa gel (Yeung et al., 2005). Coverslips with attached gels were washed in ddH2O and spun dry using a custom-made coverslip spinner. Gels were activated for fibronectin coupling with 2 mg/ml Sulfo-SANPAH with two 8-min UV exposures 1 inch from two 10 W 254-nm UV bulbs (UVP, San Gabriel, CA). The coverslip with a bound, activated gel was inverted on 1 mg/ml fibronectin (FN, Calbiochem), incubated 3 h at 37°C, washed three times with PBS, and seeded with cells. Cells were imaged on a spinning disk confocal microscope (60×, 1.4 NA, 1.5× optovar, TE-2000-E, Nikon) with the appropriate filters as described elsewhere (Adams et al., 2003). Sequential images of the cells (phase contrast) and the beads (fluorescence) were captured using a CoolSnap HQ2 cooled CCD (Roper Scientific, Tucson, AZ).
Images of beads were flattened using the flatten background function in Metamorph. Images in bead movies were aligned to correct for stage drift using a correlation tracker for beads far away from the cell boundary. Beads were identified with subpixel accuracy by fitting a Gaussian around thresholded maxima. The positions of identified beads were tracked using a correlation tracker (Ji and Danuser, 2005) and were mapped onto an evenly spaced 2 × 2-μm grid using a Gaussian interpolation algorithm (Ponti et al., 2003). Cells were segmented by applying several filters found in Metamorph to the phase-contrast images in the following order: erosion, dilation, gradient, detect dark holes, and close-open. This protocol of filters gave rise to an image that could be thresholded by intensity to form a mask of the cell. Only displacements contained in this mask were summed and normalized to the summed value before EGF stimulation.
RESULTS
EGF Elicits Temporally Distinct Phases of Protrusion and Retraction
To understand how EGF stimulates cycles of protrusion, traction force generation, and retraction to drive cell migration, we examined the sequence and timing of these events from the initiation of a cell migration cycle. We acutely stimulated epidermal keratinocytes (HaCats) with 5 nM EGF (Segall et al., 1996) and imaged cells using time-lapse differential interference contrast (DIC) microscopy (Figure 1A, Supplemental Video 1) or fixed and processed cells for localization of F-actin (Figure 1B). After stimulation, we observed an F-actin-rich lamellipodium, devoid of myosin-II (Figures 1B and 3A) that extended from the cell edge at 2–5 min after stimulation (PS). Between 5–10 min PS, the lamellipodium often lifted off the substrate and ruffled (Figure 1A, Supplemental Video 1). This was followed at 10–20 min PS by a complete collapse of the lamellipodium and lamella in ∼90% of the cells, resulting in retraction that produced retraction fibers containing bundles of F-actin (Figure 1B). At 40–60 min after EGF stimulation, the cells respread and began to migrate faster than before EGF stimulation (not shown). Thus, acute EGF stimulation simulates a response that mimics the initiation of a cell motility cycle with protrusion temporally segregated from retraction.
Figure 1.

EGF stimulates protrusion of an actin-rich lamellipodium followed by cell retraction. (A) Left, time course of DIC images of a HaCat cell stimulated with 5 nM EGF. Right, kymograph taken along the line highlighted in the 0-min image with the protrusion (P) and retraction (R) phases marked with white arrows and time after stimulation (min) below. Bottom row, a higher magnification view of the region highlighted with a white box. (B) Left, epifluorescence images of cells fixed after 0, 5, and 20 min of 5 nM EGF stimulation and stained with fluorescent phalloidin to visualize F-actin. Right, enlarged views of the F-actin network denoted by the white squares. Bars, 10 μm.
Figure 3.

EGF stimulation promotes myosin-IIA heavy chain (MHC) localization on F-actin bundles in the lamella and S19-MRLC phosphorylation. (A) Epifluorescence images of HaCat cells fixed at the noted times (min) after 5 nM EGF stimulation and processed for localization of F-actin, MHC, and pS19-MRLC (0 min, n = 21; 5 min, n = 21; 20 min, n = 24). Below, enlarged views of the regions denoted by the white squares. Bars, 10 μm. (B) Left, Western blots of cell lysates collected after stimulation with 5 nM EGF probed for pS19-MRLC and actin as a loading control. Times after EGF stimulation are noted in minutes. Right, quantification of Western blotting for pS19-MRLC normalized to actin. Inset, enlargement of the 0–3-min time points. Error bars, ±SEM; n = 3.
EGF Promotes Traction Force Generation before Protrusion
During migration, traction force development between the cell and the ECM is thought to follow protrusion and precede retraction. We wanted to identify when EGF stimulation increases in traction force relative to the protrusion and retraction phases. To achieve this, we imaged cells plated on fibronectin-coated 3-kPa polyacrylamide substrates embedded with 0.2-μm fluorescent beads and determined the bead displacements impinged by the cells during EGF stimulation. EGF stimulation of cells plated on these substrates showed the same characteristic protrusion and retraction responses seen in cells plated on glass (Figure 2A). Bead positions were tracked, and displacements relative to their positions after trypsinization were calculated and interpolated on a 2 × 2-μm grid, and their magnitudes within the boundary of the cell were summed, resulting in a displacement metric that roughly scales with total traction force (Figure 2B, Supplemental Video 2). Before EGF stimulation, there was a baseline level of bead displacement, indicating a basal level of traction force exerted by the cell on the substrate (Figures 2, A–C). After EGF stimulation, traction force increase was initiated before the onset of protrusion (as indicated by an increase in cell area, Figure 2B). Traction force plateaued at 2–3 min PS, whereas the cell area reached a maximum at about 5 min PS. Subsequently, the traction force decreased when the cell began to retract at 10 min PS. When averaged over 11 cells, the traction-mediated displacement increased rapidly after EGF stimulation (tlag = 0.34 min, Supplemental Table S1), whereas the protrusion lagged slightly behind (tlag = 1.9 min, Supplemental Table S1; Figure 2C). Both of these metrics reached their maximal levels at about 7.5 min PS (Supplemental Table S1) and decreased through 20 min PS (Figure 2C). These results show that EGF stimulates traction force generation slightly before protrusion, with a subsequent lag before cell retraction.
Figure 2.

EGF stimulates an increase in traction force generation during protrusion. HaCat cells imaged on fibronectin-coated 3-kPa polyacrylamide substrates containing embedded fluorescent beads. (A) Top row, phase-contrast micrographs (time after 5 nM EGF stimulation in min). Middle row, raw bead displacements (relative to their positions after trypsinization) with the cell outline overlaid. Bottom row, interpolated bead displacements, as described in Materials and Methods, with the cell outline overlaid. Bars, 10 μm. (B) Left, the cell area (gray line, right axis) and sum of the interpolated displacements within the cell area (black line, left axis) as a function of time for the cell in A. Right, a kymograph taken along the line highlighted in the 0-min image in A with time after EGF stimulation (min) below. (C) Average cell area (gray line, right axis) and average summed displacements (black line, left axis) for 11 cells, each normalized to the prestimulus values before averaging. Error bars, ±SEM; n = 11.
Retraction Is Dependent on ROCK-mediated MRLC Phosphorylation
Increases in traction force generation after EGF stimulation suggests that myosin-II activity may be up-regulated (Cai et al., 2006). To determine if myosin-II contributes to increases in traction force generation and retraction, we analyzed the location and level of myosin-II regulatory light-chain phosphorylation on serine 19 (pS19-MRLC) as a readout of myosin-II contractile activity after stimulation with EGF. Immunolocalization showed about a twofold increase in pS19-MRLC level after EGF stimulation on a global level (not shown) and that pS19-MRLC and myosin-IIA heavy chain (MHC) were both absent from lamellipodia, but decorated actin bundles in the lamella during the protrusion phase at 5 min PS (Figure 3A). Regions of actin bundles close to FAs were not labeled with either MHC or pS19-MRLC, suggesting that myosin-II transmits force from a distance through the actin cytoskeleton to a subset of FAs. At 20 min PS, both MHC and pS19-MRLC concentrated in the retracted lamella. Immunoblotting cell lysates collected after EGF stimulation revealed a very rapid increase in pS19-MRLC level by 15 s PS, followed by a rapid decay to a pseudo steady state that remained above the basal level through 20 min PS (Figure 3B). Thus, EGF rapidly stimulates activation of myosin-II first, followed closely by increases in traction force generation and then protrusion. Retraction then ensues 10–20 min PS.
We next examined the requirement for myosin-II activity in EGF-stimulated cell retraction using pharmacological perturbation. We pretreated HaCats for 1–2 h with ML-7 to inhibit MLCK (20 μM, Ki = 0.3 μM), blebbistatin to inhibit myosin-II ATPase (30 μM, Ki < 2 μM), or Y-27632 to inhibit ROCK (10 μM, Ki = 0.14 μM) and imaged them using time-lapse microscopy (Figure 4A, Supplemental Video 3) during stimulation with EGF. MLCK inhibition did not affect EGF-induced retraction (Figure 4A); however, the cells were less well spread (Figure 4B) and exhibited protrusion and ruffling similar to control cells. In contrast, inhibition of myosin-II ATPase or ROCK activity both blocked EGF-induced retraction. Both of these treatments also slightly tempered the extent (but not the timing) of protrusion compared with controls, likely because they both caused increased spreading before EGF treatment (Figure 4, A and B).
Figure 4.

ROCK activity is required for EGF-stimulated cell retraction and S19-MRLC phosphorylation. (A) Left: DIC images of HaCat cells at different times (in min) after 5 nM EGF stimulation. Cells were pretreated with vehicle only (0.3% DMSO), 20 μM ML-7, 30 μM blebbistatin, or 10 μM Y-27632 for 1–2 h before stimulation with EGF, as indicated to the left. Bars, 10 μm. Right, kymographs taken along the lines highlighted in the 0-min images, with time after EGF stimulation (min) below. (B) Quantification of cell area changes normalized to the mean area of control cells before EGF stimulation. Error bars, ±SEM for each condition (control, n = 10, ·; ML-7, n = 10, ■; blebbistatin, n = 10, ♦; and Y-27632, n = 10, ▴). (C) Quantification of Western blotting for pS19-MRLC normalized to total MRLC. Error bars, ±SEM for each condition (control, n = 4, ·; ML-7, n = 2, ■; and Y-27632, n = 2, ▴).
Consistent with these data were the affect of pretreatment with the kinase inhibitors on the pS19-MRLC level measured by immunoblotting (Figure 4C). This analysis showed that ML-7 did not affect the EGF-induced pS19-MRLC increase in HaCat cells, even at 15 s of EGF simulation (not shown), contrary to reports in other cell types (Iwabu et al., 2004). However, Y-27632 eliminated most of the EGF-induced increase in pS19-MRLC (Figure 4C). Immunostaining showed that ROCK inhibition blocked the EGF-stimulated increase in pS19-MRLC level in the lamella (compare Figure 3A with Figure 5). Interestingly, EGF still stimulated marginal S19-MRLC phosphorylation behind the lamellipodia (Figure 5), similar to the localization of pS19-MRLC in unstimulated cells (Totsukawa et al., 2004), even though global pS19-MRLC levels were reduced (Figure 4C). Together, these data support the notion that EGF stimulates rapid ROCK-dependent activation of myosin-II and that contraction is required for EGF-induced cell retraction.
Figure 5.

ROCK is required for S19-MRLC phosphorylation in the cell center, but not in the cell periphery. Top, epifluorescence images of HaCat cells fixed after pretreatment for 1–2 h with 10 μM Y-27632 and 0, 5, and 20 min of 5 nM EGF stimulation. Cells were processed for localization of F-actin, MHC, and pS19-MRLC. Bottom, enlarged views of the regions denoted by the white squares. Bars, 10 μm.
EGF Stimulates Acute FA Assembly during Protrusion and FA Maturation and Disassembly before Retraction
The above results show that EGF induces a rapid contraction that is required for a temporally delayed retraction event. To test if the lag between contraction and retraction is due to a delay in de-adhesion, we analyzed FA dynamics after EGF stimulation. We used paxillin as a marker of FAs, because it is present in FAs of various maturation states (Laukaitis et al., 2001; Zaidel-Bar et al., 2007b; Choi et al., 2008). To avoid confusion in terminology, we call all ventral paxillin-containing clusters “FAs” regardless of their size, shape, or position in the cell. Before EGF stimulation, immunolocalization of paxillin showed that FAs exhibited a range of sizes and fluorescence intensities. EGF induced an increase in the fraction of small FAs (<0.5 μm2) at 5 min PS (Figure 6A), mostly within the lamellipodium (Figure 6A). The shift in the FA size distribution after EGF stimulation resulted in a significantly (Kolmogorov-Smirnov, p < 0.001) smaller average FA size and was accompanied by a significant increase in average normalized FA fluorescence (Figure 6B). By 20 min PS, the average FA size returned to the larger prestimulus level, although a majority of these were extended, narrow, and dim in fluorescence and remained behind the retracted cell edge (Figure 6, A and B).
Figure 6.

EGF stimulation promotes FA assembly and growth, followed by maturation and disassembly. (A) Left, epifluorescence images of HaCat cells that were stimulated with 5 nM EGF for 0, 5, and 20 min as noted and fixed and processed for localization of F-actin and paxillin. Center, enlarged views of the regions denoted by the white squares. Arrows denote small assembled FAs. Bars, 10 μm. Right, histogram of FA size distribution (n = 4–7 cells). (B) Left, semi-log plot of the normalized paxillin fluorescence in FAs (background subtracted FA paxillin fluorescence divided by the background subtracted cytosolic paxillin fluorescence) versus FA size at different times after EGF stimulation (PS, 0′ green, 5′ red, and 20′ blue). Lines represent linear fits to the data. Right, the average area (dark bars) or normalized paxillin fluorescence (light bars) of FAs after 0′ (green), 5′ (red), and 20′ (blue) min of EGF stimulation. Error bars, ±SEM. (C) Graph of the normalized cell area (gray, right axis) and paxillin-EGFP in FAs (gray, left axis) for the cell in D. (D) Top row, TIRF images of a cell expressing paxillin-EGFP at the times noted after stimulation with 5 nM EGF, with enlarged views of the region highlighted by a white box. Bottom row, FA segmented as described in Materials and Methods. Arrows denote small, newly assembled FAs. Bars, 10 μm. (E) Left, Western blots of cell lysates probed for pY118-paxillin and total paxillin at the noted times after EGF stimulation. Center, the average normalized paxillin-EGFP fluorescence in FAs (n = 5 cells, black) and the average of quantified Western blots of pY118-paxillin level normalized to total paxillin level (n = 3, red). Right, enlargement of the 0–3 min time points plotted in the center graph. Error bars, ±SEM.
To better analyze the kinetics of this process, we transfected cells with either paxillin-EGFP or -mCherry and imaged them using TIRF microscopy during EGF stimulation (Supplemental Video 4). The intensity of segmented FAs was normalized to cytosolic paxillin fluorescence, multiplied by the segmented area, and ratioed to the prestimulus value to give a normalized measure of paxillin in FAs with respect to the prestimulus level. Increases included both new FA assembly and paxillin recruitment to existing FAs. Analysis of individual FAs that were present before EGF stimulation showed that EGF induced recruitment of paxillin, and most of these preexisting FAs began to elongate and treadmill or slide centripetally within 2–5 min after EGF treatment (Figure 6D). Analysis of all segmented FAs within a cell showed that at 4 min PS, paxillin increase in FAs peaked, followed by a slow decay that continued through the retraction event (Figure 6, C and E). Thus, EGF stimulates rapid assembly of small FAs concomitant with cell protrusion, followed by FA growth mediated by recruitment of paxillin to both newly formed and existing FAs and subsequent dissociation of paxillin from FAs and their disassembly during retraction.
Dephosphorylation of paxillin on Y118 is a biochemical marker of FA maturation (Zaidel-Bar et al., 2007b). Unfortunately, we were unable to reliably immunofluorescently localize pY118-paxillin because of a strongly reactive band at a molecular weight distinct from that of paxillin in immunoblots after EGF stimulation (not shown). However, immunoblots could reliably report the level of pY118- paxillin in whole cell lysates from EGF stimulated cells (Figure 6E). This analysis revealed a slight dip or lag in pY118-paxillin for ∼1 min PS, followed by a rapid increase above the basal level that reached a maximum at 3 min and that was comparable to the relative increase in fluorescent paxillin in FAs measured by microscopy and similar to the timing of EGF-stimulated protrusion. This was followed by a subsequent decrease in pY118-paxillin toward the basal level before the cell retraction. Together these results suggest that EGF stimulates the assembly of FAs and recruitment and phosphorylation of paxillin on Y118, followed by Y118 paxillin dephosphorylation, indicating FA maturation and finally FA disassembly and cell retraction.
EGF-induced Contraction Drives FA Maturation
We next sought to determine how EGF promotes FA growth and maturation. This could be triggered by EGF-induced biochemical signals. Alternatively, because myosin-II–mediated contraction drives FA growth, maturation could be driven by EGF-dependent myosin-II–mediated mechanical signals. To determine how myosin-II contributes to EGF-stimulated FA changes, we first examined FA morphology by immunofluorescence after EGF stimulation in pharmacologically perturbed cells. Before EGF stimulation, inhibition of either myosin-II ATPase with blebbistatin or ROCK activity with Y-27632 inhibited large FAs, and cells exhibited diffuse paxillin staining and many small FAs near the cell edge (Figures 7A, Supplemental Figures S1 and S2A). After EGF stimulation, FAs in blebbistatin-treated cells were unchanged (Figure 7A), whereas in Y-27632–treated cells some small FAs near the cell edge elongated slightly at 5 min PS (Figure S2A), agreeing with the slight increase in pS19-MRLC observed behind lamellipodia after Y-27632 treatment and EGF stimulation (Figure 5). TIRF imaging of blebbistatin- and Y-27632–treated cells expressing paxillin-EGFP or -mCherry revealed no appreciable recruitment of paxillin to FAs after EGF stimulation (Figure 7, B and C, Supplemental Figure S2C, and Supplemental Video 5). Thus, EGF-induced paxillin recruitment and FA growth is dependent on ROCK-mediated myosin-II contraction.
Figure 7.

Myosin-II is required for EGF-mediated recruitment of paxillin to FAs and modulates phosphorylation and dephosphorylation of paxillin and Fak. (A) Epifluorescence images of HaCat cells that were pretreated for 1–2 h with 30 μM blebbistatin and then stimulated with 5 nM EGF for 0, 5, and 20 min as noted and then fixed and processed for localization of F-actin and paxillin. Right, enlarged views of the regions denoted by the white squares. (B) TIRF images of paxillin-mCherry in cells similarly pretreated with 30 μM blebbistatin and stimulated with 5 nM EGF. Time after EGF stimulation in min is shown. Bottom, enlarged views of the region highlighted by a white box. Bars, 10 μm. (C) Left, Western blots of lysates of cells that had been either pretreated for 1–2 h with 50 μM blebbistatin (blebb.) or not (control) before stimulation with 5 nM EGF. Blots probed for pY118-paxillin and total paxillin (top four panels) or pY397 FAK or total FAK (bottom four panels) at the noted times after EGF stimulation. Right, the average was normalized paxillin-EGFP fluorescence in FAs (n = 4 cells, black), and the average of quantified Western blots of pY118-paxillin level was normalized to total paxillin level (n = 2, red) in blebbistatin–pretreated cells stimulated with 5 nM EGF. Error bars, ±SEM.
To determine the role of myosin-II in the biochemical aspects of FA maturation, we analyzed Y118-paxillin phosphorylation by immunoblot in cells treated with contraction inhibitors. As noted, control cells stimulated with EGF exhibit a rapid increase in pY118-paxillin phosphorylation followed by a decrease after 10 min PS (Figure 6E). Surprisingly, in the presence of blebbistatin, EGF stimulation induced rapid and extensive reduction in pY118-paxillin level (Figure 7C). Phosphorylation of paxillin on Y118 can be controlled through Fak activity (Schaller and Parsons, 1995). Therefore, we examined the level of activated Fak (pY397-Fak) by immunoblot. Although pY397-Fak did not show an increase after EGF stimulation, in the presence of blebbistatin, EGF induced a dramatic decrease in level of pY397-Fak, similar to the kinetics of pY118-paxillin dephosphorylation (Figure 7C). Together, these results show that myosin-II–mediated contraction is required for EGF-stimulated Y118-paxillin phosphorylation, which counteracts an EGF-mediated signal for the deactivation of Fak and dephosphorylation of Y118 on paxillin.
Although these experiments show that EGF-induced paxillin recruitment, FA growth and Y118-paxillin phosphorylation requires myosin-II activity, it does not determine specifically if the myosin-II activity spike stimulated by EGF is required or if a basal level of myosin-II activity may be sufficient for these responses. Furthermore, because myosin-II inhibition locks FAs in an immature state, it is unclear if some level of FA size is required before FAs are receptive to a growth/maturation signal from EGF. To sort out these issues, we added EGF and Y-27632 to cells simultaneously, so that FAs were in various states of assembly, maturation, and disassembly upon EGF stimulation and myosin-II inhibition. By immunoblot, we verified that acute Y-27632 treatment blocked EGF-stimulated increases in pS19-MRLC (Figure 8C). Simultaneous induction of EGF signaling and inhibition of contraction resulted in normal cell protrusion kinetics (∼2 min, Figure 8A), allowed FA formation in the protruding lamellipodium, but blocked the further growth of these FAs (Figure 8B) and blocked the cell retraction response (Figure 8, A and B, and Supplemental Video 6). Similarly, immunoblots of cell lysates showed that cells simultaneously treated with blebbistatin and EGF did not exhibit the increase in Y118-paxillin phosphorylation seen after stimulation with EGF alone (Figure 8D). However, in contrast to EGF stimulation of blebbistatin-pretreated cells, cells simultaneously treated with EGF and blebbistatin did not exhibit an immediate decrease in pY118-paxillin level, supporting the role of basal contraction in initial Y118-paxillin dephosphorylation (Figure 8D). Overall, these results show that EGF-stimulated, ROCK-dependent contraction is required for the effects of EGF on FA growth and maturation.
Figure 8.

EGF-stimulated, ROCK-dependent contraction is required for EGF-induced paxillin recruitment and FA growth. (A) Left, phase-contrast images at various times (in minutes) after stimulation with either 5 nM EGF alone (top row) or EGF with 10 μM Y-27632 (bottom row). Right, kymographs taken along the lines highlighted in the 0-min images, with time after stimulation (min) below. (B) Epifluorescence images of cells stimulated with 5 nM EGF and 10 mM Y-27632 simultaneously, fixed, and processed for localization of F-actin, MHC, and paxillin. Time after stimulation (in min) is shown. Color overlays show higher magnification of the area highlighted by a white box. Bars, 10 μm. (C) Left, Western blots of cell lysates probed for pS19-MRLC and total MRLC, collected after stimulation with 5 nM EGF alone (top two panels) or 5 nM EGF with 10 μM Y-27632 (bottom two panels) for the indicated times (in min). Right, quantification of Western blotting for pS19-MRLC normalized to total MRLC. Error bars, ±SEM for each condition (control, n = 4, ·; Y-27632, n = 2, ▴). (D) The average of quantified western blots of pY118-paxillin level normalized to total paxillin level is shown (5 nM EGF, n = 7, ·; 5 nM EGF + 30 μM blebbistatin simultaneously, n = 3, ■; 5 nM EGF + 30 μM blebbistatin pretreatment, n = 3, ♦; 30 μM blebbistatin alone, n = 2, ▴).
Paxillin Dephosphorylation Contributes to the EGF-induced Retraction Response
Because paxillin phosphoregulation on Y31 and Y118 is involved in FA maturation and/or disassembly (Zaidel-Bar et al., 2007), we sought to determine if regulation at these sites was necessary for the EGF-induced cell retraction response. We used siRNA to inhibit expression of endogenous paxillin (reducing paxillin levels by ∼90%; Supplemental Figure S3) and reexpressed EGFP-fused wild-type, nonphosphorylatable (Y31F/Y118F), or phosphomimic (Y31E/Y118E) mutants of paxillin (Zaidel-Bar et al., 2007b). Both mutant and wild-type paxillin-enhanced green fluorescent protein (EGFP) proteins localized normally to FAs (Figure 9A), and all exhibited a normal protrusion response to EGF stimulation. To determine effects on EGF-induced retraction, we used kymograph analysis of image series and scored whether cells retracted within 30 min PS. This showed that both knockdown of endogenous paxillin or replacement of endogenous paxillin with EGFP-phosphomimic paxillin mutant inhibited the EGF-induced retraction response compared with untransfected cells or cells in which endogenous paxillin was replaced with either wild-type or nonphosphorylatable EGFP-paxillins (Figure 9B, Supplemental Video 7). Interestingly, cells with the phosphomimic replacing endogenous paxillin contained large FAs at the leading edge, even 30 min after EGF stimulation (Figure 9A). Taken together, these results indicate that paxillin is required for EGF induced cell retraction, and that paxillin dephosphorylation is required for FA disassembly to mediate this process.
Figure 9.

EGF-mediated retraction depends on paxillin dephosphorylation. (A) Left and right, epifluorescence images of EGFP-tagged wild-type and mutant paxillins before and after the phase-contrast time course. Center, phase-contrast images of cells after EGF stimulation (time in min). Bars, 10 μm. (B) Fraction of cells that retracted within 30 min after stimulation with EGF. (C) Time line of the lags (left bar) and maximum levels (right bar) of the cellular outputs measured after EGF stimulation in the presence and absence of myosin-II activity. (D) Arrow diagram explaining how EGF regulates retraction. Red areas correspond to early events, and green areas correspond to late events.
DISCUSSION
This work provides mechanistic insight into the kinetic control of protrusion, adhesion, traction generation, and retraction during cell migration. Understanding how these events are temporally ordered has been elusive, because cells undergoing steady-state migration may protrude, adhere, generate traction, and retract at many different places and times within the cell. The ensemble average of these individually timed cycles may determine the net movement of the whole cell. By using acute EGF stimulation of migration, we were able to synchronize these normally asynchronous cycles. We found that EGF stimulation elicits protrusion at ∼2 min PS, which was followed by retraction at ∼10 min PS, thus defining, under synchronous conditions, the duration of a full cell migration cycle in epidermal keratinocytes. Surprisingly, we found that the intervening events, adhesion, and traction generation, are not initiated at intermediate time points, but rather that protrusion, adhesion, contraction, and traction generation all are initiated within 2 min after EGF stimulation, followed by a lag of ∼10 min before retraction.
Supplemental Table S1 and Figure 9C outline the kinetics of protrusion, FA characteristics, myosin-II regulation, and traction generation and retraction that occur after EGF stimulation. After EGF stimulation, S19-MRLC phosphorylation is initiated first (tlag < 15 s and tmax ∼ 15–30 s), followed by traction force generation (tlag ∼ 20 s and tmax ∼ 7.4 min). Before the traction force reaches its maximum, paxillin is assembled in new FAs and recruited to existing FAs (tlag ∼ 1.6 min and tmax ∼ 5.2 min) and paxillin Y118 is phosphorylated (tlag ∼ 1.1 min and tmax ∼ 3.0 min). Surprisingly, protrusion shows slower kinetics and lags behind the signaling and traction responses (tlag ∼ 1.9 min and tmax ∼ 7.8 min), but is concomitant with adhesion assembly. Finally, retraction ensues with a tlag = 11.2 min. These results suggest that the increase in traction force at ∼2 min PS is mediated by much more rapid activation of contraction, followed closely by increased adhesion. The contraction increase was indicated by ROCK-dependent MRLC phosphorylation, implicating EGF in the rapid activation of RhoGTPase signaling. Increased adhesion was indicated by up-regulation of paxillin phosphorylation and formation of many small, presumably biochemically immature FAs. The delay between myosin-II activation and traction generation is surprising and likely represents the time for myosin-II filament assembly (Dulyaninova et al., 2007), transmission of forces through the actin cytoskeleton to FAs and the formation and growth of FAs capable of transmitting these forces to the ECM. The precedence of Y118-paxillin phosphorylation before focal adhesion growth implies that this phosphoregulation may be required for growth.
Contraction Drives FA Maturation to Time a Delay in Cell Retraction
Our results suggest the existence of an EGF-stimulated switch in tension sensing at the level of FA maturation and adhesive strength. Adherent cells exist in a homeostatic state where the contractile strength almost matches the adhesion strength (Powers et al., 1997). This close matching between contraction and adhesion strengths occurs because of feedback loops between them. Consequently, cells tend not to have excess adhesion strength. In order for a cell (or a protrusion) to retract, the cell must either increase contraction or decrease adhesion. Although we found that EGF induced a robust increase in myosin-II activity, this occurred well before retraction and was nearly cotemporal with protrusion and increased traction force generation (Figure 9B). Because this early rise in contraction and traction did not induce retraction, it must have been balanced by increased adhesion, as indicated by the myosin-II–dependent assembly and recruitment of phosphorylated paxillin to FAs. However, after the protrusion phase and preceding the retraction phase, contraction decreased slightly and FA maturation mediated by pY118-paxillin dephosphorylation ensued, eventually allowing FA disassembly to decrease adhesion strength, and thus promoting the subsequent retraction.
We suggest that EGF-mediated contractility drives a FA maturation cycle that acts as a 10-min timer, regulating a switch between high adhesion and low adhesion. This adhesion switch cooperates with sustained contraction to generate traction force at early times and retraction much later, as pictured in Figure 9D. EGF stimulates leading edge protrusion that is tightly coupled with the formation of new FAs. The “maturation timer cycle” is initiated as newly assembled FAs are immediately acted on by the EGF-stimulated myosin-II activity spike to promote FA growth, drive Y118 paxillin phosphorylation and increase traction force. Importantly, in the absence of contractile activity, EGF induced small FAs and immediate paxillin and Fak dephosphorylation, suggesting that EGF promotes biochemical signals that drive Fak inactivation and paxillin dephosphorylation, but that these are overridden by the myosin-II–mediated mechanical signals driving adhesion assembly and paxillin phosphorylation. Once the FA assembly and growth process has ceased (∼5 min PS), myosin-II activity decreases, ending the contraction-induced up-regulation of paxillin phosphorylation and allowing the EGF-mediated biochemical signal driving pY118-paxillin dephosphorylation to dominate, likely mediated by both Fak down-regulation and phosphatase activity. This delayed paxillin dephosphorylation is required for FA disassembly and adhesion weakening, because blocking paxillin expression or inhibiting paxillin dephosphorylation by replacing the endogenous protein with a phosphomimic mutant prevented FA disassembly and cell retraction. Once FA maturation and weakening occurs, the sustained myosin-II–mediated contraction that remains elevated through 20 min PS switches its role from generating traction to driving retraction. We suggest that the paxillin phosphorylation-dephosphorylation cycle sets the timing of FA maturation and is the root cause of the delay between initial traction generation and retraction. This scenario agrees with data showing that blocking myosin-II function slows focal adhesion disassembly (Webb et al., 2004). Thus, our results suggest the existence of an EGF-stimulated switch in tension sensing at the level of focal adhesion maturation and adhesive strength and indicate that, contrary to the notion that adhesion maturation is inhibitory to migration, the process is critical to the timing of events during the cell migration cycle.
Myosin-II–mediated Contraction May Affect EGF-mediated Signaling, Metastasis, and Chemotaxis
The dramatically different kinetics of EGF-stimulated paxillin phosphorylation/dephosphorylation, depending on the contractile state of the cell illustrates a very interesting feature of EGF-mediated signaling pathways, i.e., their dependence on intracellular tension. This difference in signaling could play a role in pathological processes such as cancer cell behavior. Tumors are stiffer than the surrounding tissues, thus affecting the level of contractility in cells within tumors, which likely affects their response to EGF signaling (Paszek et al., 2005). In soft environments, lower levels of cell contractility could reduce EGF-mediated paxillin phosphorylation, thus inhibiting cell traction and preventing migration, whereas in stiff tumors the EGF-mediated contraction could be higher, leading to FA strengthening and maturation to facilitate migration out of the tumor. It is also possible that EGF-induced maturation of FAs may serve as a point of control for chemotaxing cells. In steep chemoattractant gradients, chemotaxis is thought to proceed by biasing protrusion; however, it was shown recently that cells migrating in very shallow chemoattractant gradients extend multiple protrusions, even in unproductive directions (Andrew and Insall, 2007). Perhaps protrusions that are exposed to higher chemoattractant concentrations activate contraction in a way that stabilizes adhesion to the surface, whereas protrusions that are exposed to lower chemoattractant concentration activate contraction to a lesser extent.
In summary, kinetic analysis of EGF-mediated protrusion has already been carried out with success (Mouneimne et al., 2004); however, until now there was limited information on the kinetics of the processes of adhesion, contraction, traction generation, and retraction. This kinetic information on EGF-stimulated adhesion and contraction is vital in understanding how the cell might temporally segregate the processes of traction force generation and retraction during cell migration in wound healing, metastasis, and chemotaxis.
Supplementary Material
ACKNOWLEDGMENTS
We thank Robert Fischer, Margaret Gardel, and Ana Pasapera for discussion and technical advice. We thank Rick Horwitz (University of Virginia), David Schlaepfer (University of California, San Diego), Mark Ginsberg (University of California, San Diego), and Velia Fowler (Scripps) for reagents and Gaudenz Danuser (Scripps) for computational algorithms. This work was supported by the Intramural Research Program of the National Institutes of Health, National Heart, Lung, and Blood Institute, Grant GM61804 to C.M.W. and S.L.S. and a fellowship from the Damon Runyon Cancer Research Foundation to I.C.S. The Scripps manuscript number is 19540.
Abbreviations used:
- DIC
differential interference contrast
- EGF
epidermal growth factor
- EGFP
enhanced green fluorescent protein
- ECM
extracellular matrix
- FA
focal adhesion
- Fak
focal adhesion kinase
- MRLC
myosin-II regulatory light chain
- pS19-MRLC
serine-19 phosphorylated myosin-II regulatory light chain
- MHC
myosin-IIA heavy chain
- MLCK
myosin light chain kinase
- PS
post-stimulation
- pY118-paxillin
tyrosine-118–phosphorylated paxillin
- pY397-Fak
tyrosine-397–phosphorylated Fak
- ROCK
rho- kinase
- TIRF
total internal reflection fluorescence.
Footnotes
This article was published online ahead of print in MBC in Press (http://www.molbiolcell.org/cgi/doi/10.1091/mbc.E09-03-0219) on April 29, 2009.
REFERENCES
- Adams M. C., Matov A., Yarar D., Gupton S. L., Danuser G., Waterman-Storer C. M. Signal analysis of total internal reflection fluorescent speckle microscopy (TIR-FSM) and wide-field epi-fluorescence FSM of the actin cytoskeleton and focal adhesions in living cells. J. Microsc. 2004;216:138–152. doi: 10.1111/j.0022-2720.2004.01408.x. [DOI] [PubMed] [Google Scholar]
- Adams M. C., Salmon W. C., Gupton S. L., Cohan C. S., Wittmann T., Prigozhina N., Waterman-Storer C. M. A high-speed multispectral spinning-disk confocal microscope system for fluorescent speckle microscopy of living cells. Methods. 2003;29:29–41. doi: 10.1016/s1046-2023(02)00282-7. [DOI] [PubMed] [Google Scholar]
- Adelstein R. S., Conti M. A. Phosphorylation of platelet myosin increases actin-Activated myosin ATPase activity. Nature. 1975;256:597–598. doi: 10.1038/256597a0. [DOI] [PubMed] [Google Scholar]
- Amano M., Ito M., Kimura K., Fukata Y., Chihara K., Nakano T., Matsuura Y., Kaibuchi K. Phosphorylation and activation of myosin by Rho-associated kinase (Rho-kinase) J. Biol. Chem. 1996;271:20246–20249. doi: 10.1074/jbc.271.34.20246. [DOI] [PubMed] [Google Scholar]
- Andrew N., Insall R. H. Chemotaxis in shallow gradients is mediated independently of PtdIns 3-kinase by biased choices between random protrusions. Nat. Cell Biol. 2007;9:193–200. doi: 10.1038/ncb1536. [DOI] [PubMed] [Google Scholar]
- Bailly M., Yan L., Whitesides G. M., Condeelis J. S., Segall J. E. Regulation of protrusion shape and adhesion to the substratum during chemotactic responses of mammalian carcinoma cells. Exp. Cell Res. 1998;241:285–299. doi: 10.1006/excr.1998.4031. [DOI] [PubMed] [Google Scholar]
- Beningo K. A., Dembo M., Kaverina I., Small J. V., Wang Y. L. Nascent focal adhesions are responsible for the generation of strong propulsive forces in migrating fibroblasts. J. Cell Biol. 2001;153:881–887. doi: 10.1083/jcb.153.4.881. [DOI] [PMC free article] [PubMed] [Google Scholar]
- Bershadsky A. D., Balaban N. Q., Geiger B. Adhesion-dependent cell mechanosensitivity. Annu. Rev. Cell Rev. Dev. Biol. 2003;19:677–695. doi: 10.1146/annurev.cellbio.19.111301.153011. [DOI] [PubMed] [Google Scholar]
- Burridge K., ChrzanowskaWodnicka M. Focal adhesions, contractility, and signaling. Annu. Rev. Cell Dev. Biol. 1996;12:463–518. doi: 10.1146/annurev.cellbio.12.1.463. [DOI] [PubMed] [Google Scholar]
- Cai Y. F., et al. Nonmuscle myosin IIA-dependent force inhibits cell spreading and drives F-actin flow. Biophys. J. 2006;91:3907–3920. doi: 10.1529/biophysj.106.084806. [DOI] [PMC free article] [PubMed] [Google Scholar]
- Choi C. K., Vicente-Manzanares M., Zareno J., Whitmore L. A., Mogilner A., Horwitz A. R. Actin and alpha-actinin orchestrate the assembly and maturation of nascent adhesions in a myosin II motor-independent manner. Nat. Cell Biol. 2008;10:1039–1050. doi: 10.1038/ncb1763. [DOI] [PMC free article] [PubMed] [Google Scholar]
- Dulyaninova N. G., House R. P., Betapudi V., Bresnick A. R. Myosin-IIA heavy-chain phosphorylation regulates the motility of MDA-MB-231 carcinoma cells. Mol. Biol. Cell. 2007;18:3144–3155. doi: 10.1091/mbc.E06-11-1056. [DOI] [PMC free article] [PubMed] [Google Scholar]
- Engler A. J., Sen S., Sweeney H. L., Discher D. E. Matrix elasticity directs stem cell lineage specification. Cell. 2006;126:677–689. doi: 10.1016/j.cell.2006.06.044. [DOI] [PubMed] [Google Scholar]
- Galbraith C. G., Yamada K. M., Sheetz M. P. The relationship between force and focal complex development. J. Cell Biol. 2002;159:695–705. doi: 10.1083/jcb.200204153. [DOI] [PMC free article] [PubMed] [Google Scholar]
- Giannone G., Dubin-Thaler B. J., Dobereiner H. G., Kieffer N., Bresnick A. R., Sheetz M. P. Periodic lamellipodial contractions correlate with rearward actin waves. Cell. 2004;116:431–443. doi: 10.1016/s0092-8674(04)00058-3. [DOI] [PubMed] [Google Scholar]
- Giannone G., Sheetz M. P. Substrate rigidity and force define form through tyrosine phosphatase and kinase pathways. Trends Cell Biol. 2006;16:213–223. doi: 10.1016/j.tcb.2006.02.005. [DOI] [PubMed] [Google Scholar]
- Hu K., Ji L., Applegate K. T., Danuser G., Waterman-Storer C. M. Differential transmission of actin motion within focal adhesions. Science. 2007;315:111–115. doi: 10.1126/science.1135085. [DOI] [PubMed] [Google Scholar]
- Iwabu A., Smith K., Allen F. D., Lauffenburger D. A., Wells A. Epidermal growth factor induces fibroblast contractility and motility via a protein kinase C delta-dependent pathway. J. Biol. Chem. 2004;279:14551–14560. doi: 10.1074/jbc.M311981200. [DOI] [PubMed] [Google Scholar]
- Ji L., Danuser G. Tracking quasi-stationary flow of weak fluorescent signals by adaptive multi-frame correlation. J. Microsc. 2005;220:150–167. doi: 10.1111/j.1365-2818.2005.01522.x. [DOI] [PubMed] [Google Scholar]
- Ji L., Lim J., Danuser G. Fluctuations of intracellular forces during cell protrusion. Nat. Cell Biol. 2008;10:1393–1400. doi: 10.1038/ncb1797. [DOI] [PMC free article] [PubMed] [Google Scholar]
- Kimura K., et al. Regulation of myosin phosphatase by Rho and Rho-associated kinase (Rho-kinase) Science. 1996;273:245–248. doi: 10.1126/science.273.5272.245. [DOI] [PubMed] [Google Scholar]
- Lauffenburger D. A., Horwitz A. F. Cell migration: a physically integrated molecular process. Cell. 1996;84:359–369. doi: 10.1016/s0092-8674(00)81280-5. [DOI] [PubMed] [Google Scholar]
- Laukaitis C. M., Webb D. J., Donais K., Horwitz A. F. Differential dynamics of alpha 5 integrin, paxillin, and alpha-actinin during formation and disassembly of adhesions in migrating cells. J. Cell Biol. 2001;153:1427–1440. doi: 10.1083/jcb.153.7.1427. [DOI] [PMC free article] [PubMed] [Google Scholar]
- Li W., Fan J., Chen M., Woodley D. T. Mechanisms of human skin cell motility. Histol. Histopathol. 2004;19:1311–1324. doi: 10.14670/HH-19.1311. [DOI] [PubMed] [Google Scholar]
- Lu Z. M., Jiang G. Q., Blume-Jensen P., Hunter T. Epidermal growth factor-induced tumor cell invasion and metastasis initiated by dephosphorylation and downregulation of focal adhesion kinase. Mol. Cell. Biol. 2001;21:4016–4031. doi: 10.1128/MCB.21.12.4016-4031.2001. [DOI] [PMC free article] [PubMed] [Google Scholar]
- Mouneimne G., Soon L., DesMarais V., Sidani M., Song X. Y., Yip S. C., Ghosh M., Eddy R., Backer J. M., Condeelis J. Phospholipase C and cofilin are required for carcinoma cell directionality in response to EGF stimulation. J. Cell Biol. 2004;166:697–708. doi: 10.1083/jcb.200405156. [DOI] [PMC free article] [PubMed] [Google Scholar]
- Palecek S. P., Schmidt C. E., Lauffenburger D. A., Horwitz A. F. Integrin dynamics on the tail region of migrating fibroblasts. J. Cell Sci. 1996;109:941–952. doi: 10.1242/jcs.109.5.941. [DOI] [PubMed] [Google Scholar]
- Paszek M. J., M., et al. Tensional homeostasis and the malignant phenotype. Cancer Cell. 2005;8:241–254. doi: 10.1016/j.ccr.2005.08.010. [DOI] [PubMed] [Google Scholar]
- Pelham R. J., Wang Y. L. Cell locomotion and focal adhesions are regulated by substrate flexibility. Proc. Natl. Acad. Sci. USA. 1997;94:13661–13665. doi: 10.1073/pnas.94.25.13661. [DOI] [PMC free article] [PubMed] [Google Scholar]
- Pires E., Perry S. V., Thomas M.A.W. Myosin light-chain kinase, a new enzyme from striated-muscle. FEBS Lett. 1974;41:292–296. doi: 10.1016/0014-5793(74)81232-9. [DOI] [PubMed] [Google Scholar]
- Ponti A., Vallotton P., Salmon W. C., Waterman-Storer C. M., Danuser G. Computational analysis of F-actin turnover in cortical actin meshworks using fluorescent speckle microscopy. Biophys. J. 2003;84:3336–3352. doi: 10.1016/S0006-3495(03)70058-7. [DOI] [PMC free article] [PubMed] [Google Scholar]
- Powers M. J., Rodriguez R. E., Griffith L. G. Cell-substratum adhesion strength as a determinant of hepatocyte aggregate morphology. Biotechnol. Bioeng. 1997;53:415–426. doi: 10.1002/(SICI)1097-0290(19970220)53:4<415::AID-BIT10>3.0.CO;2-F. [DOI] [PubMed] [Google Scholar]
- Riveline D., Zamir E., Balaban N. Q., Schwarz U. S., Ishizaki T., Narumiya S., Kam Z., Geiger B., Bershadsky A. D. Focal contacts as mechanosensors: externally applied local mechanical force induces growth of focal contacts by an mDia1-dependent and ROCK-independent mechanism. J. Cell Biol. 2001;153:1175–1185. doi: 10.1083/jcb.153.6.1175. [DOI] [PMC free article] [PubMed] [Google Scholar]
- Rottner K., Hall A., Small J. V. Interplay between Rac and Rho in the control of substrate contact dynamics. Curr. Biol. 1999;9:640–648. doi: 10.1016/s0960-9822(99)80286-3. [DOI] [PubMed] [Google Scholar]
- Russell A. J., Fincher E. F., Millman L., Smith R., Vela V., Waterman E. A., Dey C. N., Guide S., Weaver V. M., Marinkovich M. P. alpha 6 beta 4 integrin regulates keratinocyte chemotaxis through differential GTPase activation and antagonism of alpha 3 beta 1 integrin. J. Cell Sci. 2003;116:3543–3556. doi: 10.1242/jcs.00663. [DOI] [PubMed] [Google Scholar]
- Schaller M. D., Parsons J. T. Pp125(Fak)-dependent tyrosine phosphorylation of paxillin creates a high-affinity binding-site for Crk. Mol. Cell. Biol. 1995;15:2635–2645. doi: 10.1128/mcb.15.5.2635. [DOI] [PMC free article] [PubMed] [Google Scholar]
- Segall J. E., Tyerech S., Boselli L., Masseling S., Helft J., Chan A., Jones J., Condeelis J. EGF stimulates lamellipod extension in metastatic mammary adenocarcinoma cells by an actin-dependent mechanism. Clin. Exp. Metastasis. 1996;14:61–72. doi: 10.1007/BF00157687. [DOI] [PubMed] [Google Scholar]
- Shi Q., Boettiger D. A novel mode for integrin-mediated signaling: tethering is required for phosphorylation of FAK Y397. Mol. Biol. Cell. 2003;14:4306–4315. doi: 10.1091/mbc.E03-01-0046. [DOI] [PMC free article] [PubMed] [Google Scholar]
- Sieg D. J., Hauck C. R., Ilic D., Klingbeil C. K., Schaefer E., Damsky C. H., Schlaepfer D. D. FAK integrates growth-factor and integrin signals to promote cell migration. Nat. Cell Biol. 2000;2:249–256. doi: 10.1038/35010517. [DOI] [PubMed] [Google Scholar]
- Tapia J. A., Camello C., Jensen R. T., Garcia L. J. EGF stimulates tyrosine phosphorylation of focal adhesion kinase (p125(FAK)) and paxillin in rat pancreatic acini by a phospholipase C-independent process that depends on phosphatidylinositol 3-kinase, the small GTP-binding protein, p21(rho), and the integrity of the actin cytoskeleton. Biochim. Biophys. Acta Mol. Cell Res. 1999;1448:486–499. doi: 10.1016/s0167-4889(98)00157-8. [DOI] [PubMed] [Google Scholar]
- Totsukawa G., Wu Y., Sasaki Y., Hartshorne D. J., Yamakita Y., Yamashiro S., Matsumura F. Distinct roles of MLCK and ROCK in the regulation of membrane protrusions and focal adhesion dynamics during cell migration of fibroblasts. J. Cell Biol. 2004;164:427–439. doi: 10.1083/jcb.200306172. [DOI] [PMC free article] [PubMed] [Google Scholar]
- Tumbarello D. A., Brown M. C., Hetey S. E., Turner C. E. Regulation of paxillin family members during epithelial-mesenchymal transformation: a putative role for paxillin delta. J. Cell Sci. 2005;118:4849–4863. doi: 10.1242/jcs.02615. [DOI] [PubMed] [Google Scholar]
- von Wichert G., Haimovich B., Feng G. S., Sheetz M. P. Force-dependent integrin-cytoskeleton linkage formation requires downregulation of focal complex dynamics by Shp2. EMBO J. 2003;22:5023–5035. doi: 10.1093/emboj/cdg492. [DOI] [PMC free article] [PubMed] [Google Scholar]
- Webb D. J., Donais K., Whitmore L. A., Thomas S. M., Turner C. E., Parsons J. T., Horwitz A. F. FAK-Src signalling through paxillin, ERK and MLCK regulates adhesion disassembly. Nat. Cell Biol. 2004;6:154–161. doi: 10.1038/ncb1094. [DOI] [PubMed] [Google Scholar]
- Wells A., Gupta K., Chang P., Swindle S., Glading A., Shiraha H. Epidermal growth factor receptor-mediated motility in fibroblasts. Microsc. Res. Tech. 1998;43:395–411. doi: 10.1002/(SICI)1097-0029(19981201)43:5<395::AID-JEMT6>3.0.CO;2-T. [DOI] [PubMed] [Google Scholar]
- Xie H., Pallero M. A., Gupta K., Chang P., Ware M. F., Witke W., Kwiatkowski D. J., Lauffenburger D. A., Murphy-Ullrich J. E., Wells A. EGF receptor regulation of cell motility: EGF induces disassembly of focal adhesions independently of the motility-associated PLC gamma signaling pathway. J. Cell Sci. 1998;111:615–624. doi: 10.1242/jcs.111.5.615. [DOI] [PubMed] [Google Scholar]
- Yeung T., Georges P. C., Flanagan L. A., Marg B., Ortiz M., Funaki M., Zahir N., Ming W. Y., Weaver V., Janmey P. A. Effects of substrate stiffness on cell morphology, cytoskeletal structure, and adhesion. Cell Motil. Cytoskelet. 2005;60:24–34. doi: 10.1002/cm.20041. [DOI] [PubMed] [Google Scholar]
- Zaidel-Bar R., Ballestrem C., Kam Z., Geiger B. Early molecular events in the assembly of matrix adhesions at the leading edge of migrating cells. J. Cell Sci. 2003;116:4605–4613. doi: 10.1242/jcs.00792. [DOI] [PubMed] [Google Scholar]
- Zaidel-Bar R., Itzkovitz S., Ma'ayan A., Iyengar R., Geiger B. Functional atlas of the integrin adhesome. Nat. Cell Biol. 2007a;9:858–868. doi: 10.1038/ncb0807-858. [DOI] [PMC free article] [PubMed] [Google Scholar]
- Zaidel-Bar R., Milo R., Kam Z., Geiger B. A paxillin tyrosine phosphorylation switch regulates the assembly and form of cell-matrix adhesions. J. Cell Sci. 2007b;120:137–148. doi: 10.1242/jcs.03314. [DOI] [PubMed] [Google Scholar]
- Zamir E., Geiger B. Molecular complexity and dynamics of cell-matrix adhesions. J. Cell Sci. 2001;114:3583–3590. doi: 10.1242/jcs.114.20.3583. [DOI] [PubMed] [Google Scholar]
- Zamir E., Geiger B., Kam Z. Quantitative multicolor compositional imaging resolves molecular domains in cell-matrix adhesions. PLoS One. 2008;3:e1901, 1–11. doi: 10.1371/journal.pone.0001901. [DOI] [PMC free article] [PubMed] [Google Scholar]
Associated Data
This section collects any data citations, data availability statements, or supplementary materials included in this article.