

Abstract
The class III histone deacetylase SIRT1 plays an important role in epigenetic gene silencing. Inhibition of SIRT1 reactivates silenced genes, suggesting a possible therapeutic approach of targeted reversal of aberrantly silenced genes. In addition, SIRT1 may play a role in the well-known link between obesity, cellular energy balance and cancer. However, a comprehensive study of SIRT1 using human cancer tissue with clinical outcome data is currently lacking, and its prognostic significance is uncertain. Utilizing the database of 485 colorectal cancers in two independent prospective cohort studies, we detected SIRT1 overexpression in 180 (37%) tumors by immunohistochemistry. We examined its relationship to the CpG island methylator phenotype, related molecular events, clinical features including body mass index, and patient survival. We quantified DNA methylation in 8 CIMP-specific promoters (CACNA1G, CDKN2A, CRABP1, IGF2, MLH1, NEUROG1, RUNX3, SOCS1) and 8 other CpG islands (CHFR, HIC1, IGFBP3, MGMT, MINT1, MINT31, p14, WRN) by MethyLight. SIRT1 overexpression was associated with CIMP-high (≥6/8 methylated CIMP-specific promoters, p=0.002) and MSI-high, (p<0.0001). In both univariate and multivariate analyses, SIRT1 overexpression was significantly associated with the CIMP-high MSI-high phenotype (multivariate odds ratio, 3.20; 95% confidence interval, 1.35–7.59; p=0.008). In addition, mucinous component (p=0.01), high tumor grade (p=0.02) and fatty acid synthase overexpression (p=0.04) were significantly associated with SIRT-positivity in multivariate analysis. SIRT1 was not significantly related with age, sex, tumor location, stage, signet ring cells, cyclooxygenase-2, LINE-1 hypomethylation, KRAS, BRAF, BMI, PIK3CA, HDAC, p53, β-catenin, COX-2, or patient prognosis. In conclusion, SIRT1 expression is associated with CIMP-high MSI-high colon cancer, suggesting a role of SIRT1 in gene silencing in this unique tumor subtype.
Keywords: colon cancer, epigenetics, SIRT, HDAC, DNA methylation, histone, acetylation
INTRODUCTION
Various histone modifications that affect chromatin structures represent an important epigenetic mechanism of gene silencing.1, 2 DNA methylation and histone modifications seem to form reinforcing networks for stable gene silencing during carcinogenic process.1, 2 SIRT1, which is one of the class III histone deacetylases,1 is a human homolog of the SIR2; a protein that is activated during calorie restriction and has been associated with increased lifespan.3–6 The role of SIRT1 in cancer is controversial, and perhaps multifaceted.7–17 On one hand, its ability to deacetylate p53 implies its role as an oncogene,11–13 while other evidence suggests its tumor suppressor activity by deacetylating β-catenin.14, 17 In colon cancer cells, inhibition of SIRT1 reactivates silenced genes even with retention of DNA methylation.16 These data collectively imply a link between DNA methylation, SIRT1 and cancer, and suggest the possibility of targeted reversal of aberrantly silenced tumor suppressor genes. In addition, SIRT1 may play a role in the well-known link between obesity, cellular energy balance and cancer. However, a large-scale study of SIRT1 expression using human cancer tissue is currently lacking.
The CpG island methylator phenotype (CIMP) is a major epigenetic phenotype in colorectal cancer, and characterized by widespread CpG island methylation.18–21 CIMP-high in colorectal cancer has been associated with older age, female, proximal tumor location, BRAF mutation, microsatellite instability (MSI), wild-type TP53 and stable chromosomes.22–26 Although overexpression of SIRT1 has been reported in human colorectal cancer,17, 27 the relationship between SIRT1 and CIMP is uncertain.
In this study, we assessed SIRT1 expression in 485 colorectal cancers, and examined its relationship to CIMP, related molecular events, clinical features (including obesity) and prognosis. We have found that SIRT1 expression is associated with CIMP and MSI, independent of other clinical and molecular variables.
MATERIALS AND METHODS
Study group
We utilized the databases of two large prospective cohort studies; the Nurses’ Health Study (N =121,700 women followed since 1976),28, 29 and the Health Professional Follow-up Study (N = 51,500 men followed since 1986).29 Data on height and weight were obtained by biennial questionnaire. A subset of the cohort participants developed colorectal cancers during prospective follow-up. Previous studies on the Nurses’ Health Study and Health Professionals Follow-up Study have described baseline characteristics of cohort participants and incident colorectal cancer cases, and confirmed that our colorectal cancers were well representative as a population-based sample.28, 29 Data on tumor location and stage were obtained through medical record review. We collected paraffin-embedded tissue blocks from hospitals where cohort participants with colorectal cancers had undergone resections of primary tumors. Based on availability of adequate tissue specimens and results, a total of 485 colorectal cancers were included. Written informed consent was obtained from all study subjects. Among our cohort studies, there was no significant difference in demographic features between cases with tissue available and those without available tissue.29 This current analysis represents a new analysis of SIRT1 in the well-established colorectal cancer database,29–32 which is analogous to novel studies using the well-described cell lines or animal models. In any of our previous studies, we have not examined SIRT1 expression or the relations of SIRT1 with clinical, outcome or other molecular variables. This study represents a unique novel study in term of 1) a large sample size analyzed for SIRT1; 2) the clinical and tissue molecular database, including the long-term follow-up outcome data; and 3) a number of molecular variables that have been analyzed. Tissue collection and analyses were approved by the Harvard School of Public Health and Brigham and Women’s Hospital Institutional Review Boards.
Histopathologic evaluations
Hematoxylin and eosin (H&E) stained tissue sections were examined by a pathologist (S.O.) unaware of other data. The tumor grade was categorized as low (≥50% gland formation) vs. high (<50% gland formation). The presence and extent of extracellular mucin were categorized as 0% (no mucin), 1–49% or ≥50% of the tumor volume. The presence and extent of signet ring cells were categorized as 0% (no signet ring cells) or ≥1% of the tumor volume.
Sequencing of KRAS, BRAF and PIK3CA, and microsatellite instability (MSI) analysis
DNA was extracted from dissected tumor tissue sections, and PCR and Pyrosequencing targeted for KRAS (codons 12 and 13),33 BRAF (codon 600)34 and PIK3CA (exons 9 and 20)35 were performed as previously described. MSI analysis was performed, using 10 microsatellite markers (D2S123, D5S346, D17S250, BAT25, BAT26, BAT40, D18S55, D18S56, D18S67 and D18S487).36 MSI-high was defined as the presence of instability in ≥30% of the markers. MSI-low was defined as instability in <30% of the markers, and “microsatellite stable (MSS)” tumors were defined as tumors without an unstable marker.
Real-time PCR (MethyLight) to measure CpG island methylation
Sodium bisulfite treatment on genomic DNA and subsequent real-time PCR (MethyLight)37 were validated and performed as previously described.38 We quantified DNA methylation in 8 CIMP-specific promoters [CACNA1G, CDKN2A (p16), CRABP1, IGF2, MLH1, NEUROG1, RUNX3 and SOCS1],24, 30, 36 all of which were selected from screening of 195 CpG islands.24, 36 CIMP-high was defined as the presence of ≥6 of 8 methylated promoters, CIMP-low as the presence of 1/8–5/8 methylated promoters, and CIMP-0 as the absence (0/8) of methylated promoters, according to the previously established criteria.30 In addition, we quantified DNA methylation in 8 other CpG islands (not in the CIMP panel), including CHFR, HIC1, IGFBP3, MGMT, MINT1, MINT31, p14, and WRN.39 Primers and probes were previously described.32, 39 The PCR condition for all markers was initial denaturation at 95°C for 10 min followed by 45 cycles of 95°C for 15 sec and 60°C for 1 min.
Pyrosequencing to measure LINE-1 methylation
In order to accurately quantify relatively high methylation levels in LINE-1 repetitive elements, we utilized Pyrosequencing as previously described.40 LINE-1 methylation level measured by Pyrosequencing has been shown to correlate with overall 5-methylcytosine level (i.e., genome-wide DNA methylation level) in tumor cells.41
Immunohistochemistry for p53, β-catenin, COX2, FASN and SIRT1
Tissue microarrays (TMAs) were constructed as previously described.29 Methods of immunohistochemical procedures and interpretations were previously described for p53,42 FASN,43, 44 and β-catenin,45 and COX-2.29, 44 For SIRT1 immunohistochemistry (Figure 1), antigen retrieval was performed, and deparaffinized tissue sections in Antigen Retrieval Citra Solution (Biogenex Laboratories, San Ramon, CA) were treated with microwave for 15 min. Tissue sections were incubated with 3% H2O2 (10 min) to block endogenous peroxidase (Dako Cytomation Carpinteria, CA), with 10% normal goat serum (Vector Laboratories, Burlingame, CA) in phosphate-buffered saline (10 min), and with serum-free protein block (Dako Cytomation) (10 min). Primary antibody against SIRT1 (Rabbit monoclonal to SIRT1, 1:100 dilution; Epitomics, Burlingame, CA) was applied, and the slides were maintained overnight at room temperature. Next, we applied anti- rabbit IgG antibody (Biogenex Laboratories) for 20 min, followed by a streptavidin-HRP conjugate (Biogenex Laboratories) for 20 min, diaminobenzidine (5 min) and methyl-green counterstain. Nuclear SIRT1 expression was recorded as no expression, weak expression, or moderate/strong expression. SIRT1 positivity (i.e., overexpression) was defined as the presence of at least focal moderate/strong staining. Appropriate positive and negative controls were included in each run of immunohistochemistry. All immunohistochemically stained slides were interpreted by one of the investigators (SIRT1 and β-catenin by K.N.; p53, COX-2 and FASN by S.O.) unaware of other data. A random selection of 174 cases was examined for SIRT1 by a second observer (K.S.) unaware of other data, and concordance between the two observers was 0.85 (κ=0.68, p<0.0001), indicating substantial agreement. For the other markers, a random selection of 108–402 cases was reexamined for each marker by a second pathologist (p53 and FASN by K.N.; β-catenin by S.O.; COX-2 by R. Dehari, Kanagawa Cancer Center, Japan) unaware of other data, and concordance rates and κ coefficients between the two pathologists were as follows: 0.87 (κ=0.75; N=118) for p53; 0.93 (κ=0.57; N=246) for FASN; 0.83 (κ=0.65; N=402); and 0.92 (κ=0.62; N=108) for COX-2, indicating generally substantial agreement.
Figure 1.
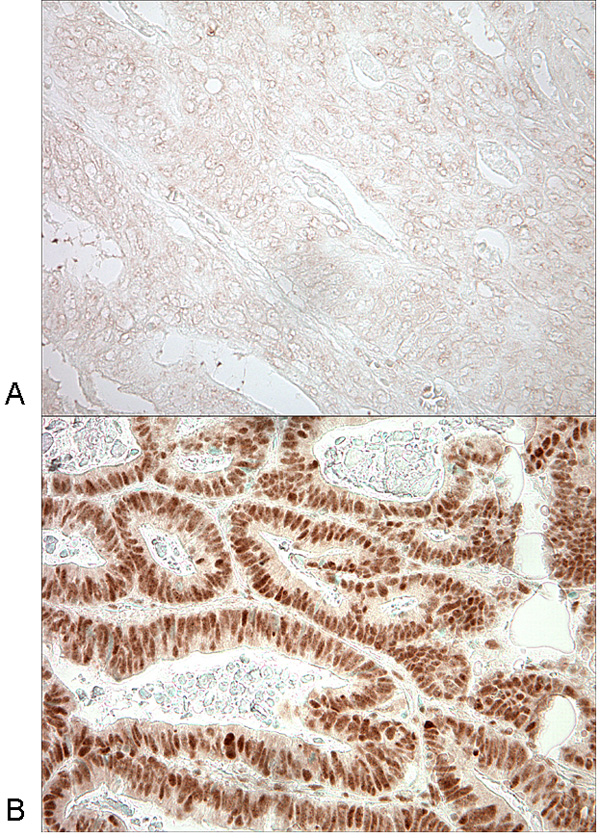
SIRT1 expression in colorectal cancer.
A. No overexpression of SIRT1 in colon cancer cells. B. Overexpression of SIRT1 in nuclei of colorectal cancer cells.
Statistical analysis
For categorical data, the chi-square test (or Fisher’s exact test when any expected cell count was <5) was performed and odds ratio with 95% confidence interval (CI) was computed. The κ coefficient was calculated to assess an agreement between the two interpreters in immunohistochemistry. To confirm independent relations between SIRT1 and clinical and molecular features, a multivariate logistic regression analysis was performed. Odds ratio was adjusted for age (<65 vs. ≥65 year old), sex, tumor location (proximal vs. distal), body mass index (≥30 vs. <30 kg/m2), tumor stage (I–II vs. III–IV), grade (low vs. high), mucin (present vs. absent), signet ring cells (present vs. absent), CIMP/MSI status (CIMP-high MSI-high vs. all other CIMP/MSI subtypes), LINE-1 methylation (as a continuous variable), p53, β-catenin, FASN, COX2, BRAF, KRAS and PIK3CA. We also examined the possibility of non-linear relations between age and SIRT1 and between body mass index and SIRT1, non-parametrically with restricted cubic splines.46 This method allowed us to examine the relations with SIRT1 without any categorization of age or body mass index.
For survival analysis, the Kaplan-Meier method was used to compare survival time distributions between SIRT1-positive and SIRT1-negative patients. Multivariate, stage-matched conditional Cox proportional hazard models computed hazard ratios (HRs) according to SIRT1 status, adjusted for age, sex, year of diagnosis, tumor location, stage, grade, CIMP, MSI, KRAS, BRAF, PIK3CA, p53, β-catenin, FASN, COX-2 and LINE-1 methylation. We also performed univariate Cox regression to assess main effect of SIRT1 on patient mortality. An interaction was assessed by including the cross product of the SIRT1 variable and another variable of interest in a multivariate Cox model, and the likelihood ratio test was performed. All statistical analyses used SAS program (Version 9.1, SAS Institute, Cary, NC). All p values were two-sided, and statistical significance was set at p ≤ 0.05; however, p values were conservatively interpreted, considering multiple hypotheses testing.
RESULTS
SIRT1 expression in colorectal cancers
Among the 485 colorectal cancers assessed by immunohistochemistry, 180 (37%) tumors showed nuclear overexpression of SIRT1 (Figure 1). Table 1 summarizes the frequencies of SIRT1 overexpression in relation to various clinical and pathologic features. SIRT1 overexpression was significantly associated with high tumor grade (p=0.003) and mucinous component (≥50% mucin, p=0.04). Because of the potential links between SIRT1 and aging,6, 9 and between SIRT1, calorie restriction and cellular energy balance,4, 6 we examined the relations between SIRT1 expression and patient age, and between SIRT1 expression and body mass index (body mass index), non-parametrically with restricted cubic splines46 (Figure 2). This method allowed us to examine the relations to SIRT1 without any categorization of age or body mass index. However, there was no significant association of SIRT1 expression with patient age or body mass index.
Table 1.
Frequency of SIRT1 overexpression in colorectal cancer
| Clinical or pathologic feature | Total N | SIRT1+ | Odds ratio (95% confidence interval) |
P value | |
|---|---|---|---|---|---|
| All cases | 485 | 180 (37%) | |||
| Gender | |||||
| Men | 194 | 64 (33%) | 1 | ||
| Women | 291 | 116 (40%) | 1.35 (0.92–1.97) | ||
| Age | |||||
| ≤59 | 125 | 45 (36%) | 1 | ||
| 60–69 | 207 | 78 (38%) | 1.07 (0.68–1.70) | ||
| ≥70 | 153 | 57 (37%) | 1.06 (0.65–1.72) | ||
| Body mass index (kg/m2) | |||||
| <25 | 199 | 74 (37%) | 1 | ||
| 25–30 | 172 | 66 (38%) | 1.05 (0.69–1.60) | ||
| ≥30 | 87 | 30 (34%) | 0.89 (0.52–1.51) | ||
| Tumor location | |||||
| Distal (splenic flexure to rectum) | 233 | 79 (34%) | 1 | ||
| Proximal (cecum to transverse colon) | 234 | 92 (39%) | 1.26 (0.87–1.84) | ||
| Stage | |||||
| I | 97 | 35 (36%) | 1 | ||
| II | 147 | 61 (42%) | 1.26 (0.74–2.13) | ||
| III | 132 | 44 (33%) | 0.89 (0.51–1.54) | ||
| IV | 69 | 25 (36%) | 1.01 (0.53–1.91) | ||
| Tumor grade | |||||
| Low | 422 | 149 (35%) | 1 | Referent | |
| High | 47 | 27 (57%) | 2.47 (1.34–4.56) | 0.003 | |
| Mucinous component | |||||
| 0% | 261 | 88 (34%) | 1 | Referent | |
| 1–49% | 106 | 46 (43%) | 1.51 (0.95–2.39) | 0.08 | |
| ≥50% | 65 | 31 (48%) | 1.79 (1.03–3.11) | 0.04 | |
| Signet ring cell component | |||||
| 0% | 453 | 168 (37%) | 1 | ||
| ≥1% | 32 | 12 (38%) | 1.02 (0.49–2.13) | ||
Only significant p values are described.
Figure 2.
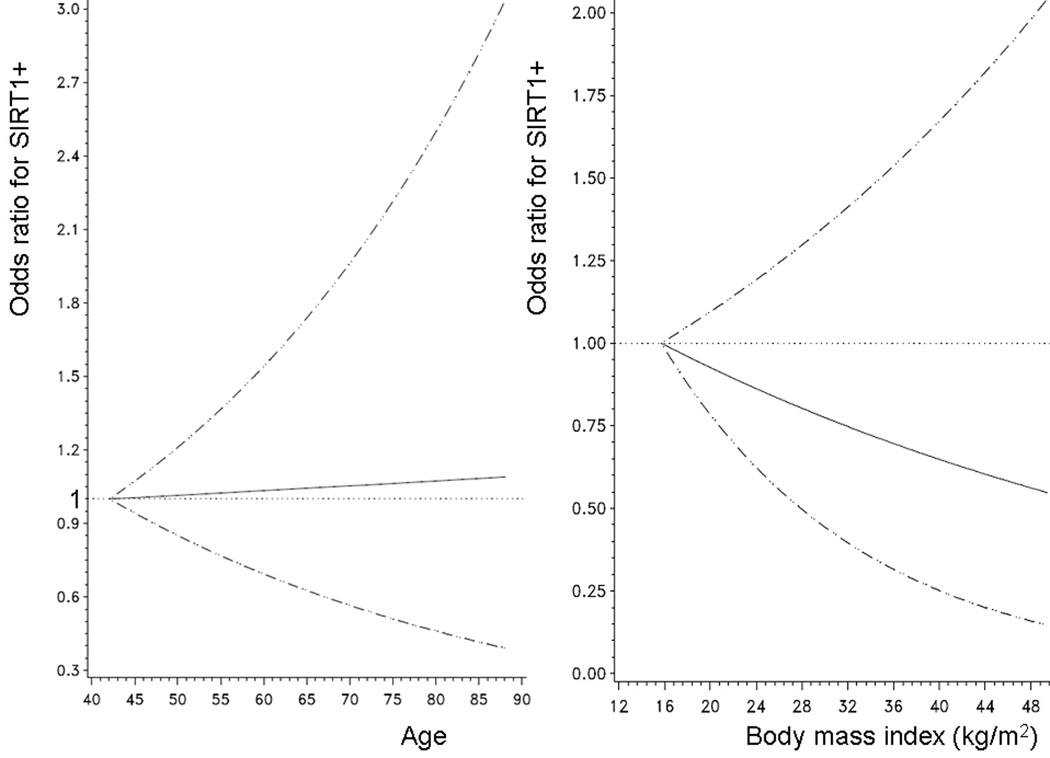
Smoothing spline plots for the relations between age and SIRT1 (left panel) and between body mass index and SIRT1 (right panel).
Unadjusted odds ratio for the association with SIRT1+ is shown as young age (left panel) or low body mass index (right panel) as a referent. 95% confidence interval is indicated by hatched lines.
SIRT1 overexpression is associated with MSI-high and CIMP-high
Table 2 summarizes the frequencies of SIRT1 overexpression in relation to molecular alterations in colorectal cancer. SIRT1 overexpression was significantly more common in microsatellite instability-high (MSI-high) tumors (59%=49/83, p<0.0001) than in microsatellite stable (MSS) tumors (34%=117/345). We determined CpG island methylator phenotype (CIMP) status using MethyLight assays on a panel of 8 CIMP-specific promoters (CACNA1G, CDKN2A, CRABP1, IGF2, MLH1, NEUROG1, RUNX3 and SOCS1).24, 30, 36 SIRT1 overexpression was significantly more common in CIMP-high tumors (57%=42/74, p=0.002) than in CIMP-0 tumors (36%=76/209).
Table 2.
Frequency SIRT1 overexpression in colorectal cancer according to various molecular features
| Molecular feature | Total N | SIRT1+ | Odds ratio (95% confidence interval) |
P value | |
|---|---|---|---|---|---|
| CIMP status (No. of methylated CIMP markers) |
|||||
| CIMP-0 (0) | 209 | 76 (36%) | 1 | Referent | |
| CIMP-low (1–5) | 187 | 58 (31%) | 1.27 (0.84–1.93) | ||
| CIMP-high (6–8) | 74 | 42 (57%) | 2.30 (1.34–3.94) | 0.002 | |
| MSI status | |||||
| MSS | 345 | 117 (34%) | 1 | Referent | |
| MSI-low | 55 | 14 (25%) | 1.50 (0.79–2.87) | ||
| MSI-high | 83 | 49 (59%) | 2.81 (1.72–4.59) | <0.0001 | |
| CIMP and MSI status | |||||
| CIMP-low/0 MSI-low/MSS | 367 | 121 (33%) | 1 | Referent | |
| CIMP-high MSI-low/MSS | 22 | 7 (32%) | 0.95 (0.38–2.39) | ||
| CIMP-low/0 MSI-high | 28 | 13 (46%) | 1.76 (0.81–3.82) | ||
| CIMP-high MSI-high | 52 | 35 (67%) | 4.19 (2.25–7.77) | <0.0001 | |
| BRAF mutation | |||||
| (−) | 404 | 143 (35%) | 1 | ||
| (+) | 68 | 31 (46%) | 1.53 (0.91–2.57) | ||
| KRAS mutation | |||||
| (−) | 310 | 120 (39%) | 1 | ||
| (+) | 173 | 59 (34%) | 0.82 (0.56–1.21) | ||
| PIK3CA mutation | |||||
| (−) | 374 | 137 (37%) | 1 | ||
| (+) | 57 | 23 (40%) | 1.17 (0.66–2.07) | ||
| LINE-1 methylation | |||||
| ≥70% | 58 | 22 (38%) | 1 | ||
| 60–70% | 155 | 61 (39%) | 1.06 (0.57–1.98) | ||
| 50–60% | 184 | 72 (39%) | 1.05 (0.57–1.93) | ||
| <50% | 66 | 20 (30%) | 0.71 (0.34–1.50) | ||
| p53* | |||||
| (−) | 285 | 110 (39%) | 1 | ||
| (+) | 197 | 69 (35%) | 0.86 (0.59–1.25) | ||
| Nuclear β-catenin* | |||||
| (−) | 269 | 104 (39%) | 1 | ||
| (+) | 166 | 68 (41%) | 1.10 (0.74–1.63) | ||
| FASN (fatty acid synthase)* | |||||
| (−) | 427 | 149 (35%) | 1 | Referent | |
| (+) | 52 | 28 (54%) | 2.18 (1.22–3.89) | 0.008 | |
| COX-2 (cyclooxygenase-2)* | |||||
| (−) | 92 | 32 (35%) | 1 | ||
| (+) | 391 | 147 (38%) | 1.13 (0.70–1.82) | ||
Only significant p values are described.
p53, β-catenin, COX-2 and FASN were assessed by immunohistochemistry.
In order to examine combined effect of MSI and CIMP on SIRT1 expression, we classified tumors into 4 subtypes according to MSI and CIMP status (Table 2). SIRT1 overexpression was more common in CIMP-high MSI-high tumors (67%=35/52) than all other subtypes (32–46%).
SIRT1 and other molecular changes
SIRT1 expression was not significantly associated with LINE-1 methylation, or alteration in KRAS, BRAF, PIK3CA, p53, β-catenin, or COX-2 (Table 2). SIRT1 expression was associated with FASN overexpression (p=0.008).
Relations between SIRT1 and methylation in individual CpG islands
Since SIRT1 expression is associated with CIMP-high, we examined whether SIRT1 expression was related with methylation in any specific individual CpG island. We examined the 8 CIMP-panel markers (CACNA1G, CDKN2A, CRABP1, IGF2, MLH1, NEUROG1, RUNX3 and SOCS1) as well as 8 other CpG islands (CHFR, HIC1, IGFBP3, MGMT, MINT1, MINT31, p14 and WRN). SIRT1 expression was significantly associated with hypermethylation at CACNA1G, IGF2, MLH1, NEUROG1, RUNX3, SOCS1, MINT31 and p14 (Supplemental Table).
The association between SIRT1 overexpression and CIMP-high MSI-high tumors according to BRAF status
Because BRAF mutation has been tightly linked to CIMP-high, we examined the frequency of the CIMP-high MSI-high phenotype according to SIRT1 and BRAF status (Figure 3). Among BRAF-mutated tumors, SIRT1 expression was significantly associated with the CIMP-high MSI-high phenotype [odds ratio (OR) 10.4; 95% CI, 3.39–32.0; p<0.0001]. Notably, the frequency of the CIMP-high MSI-high phenotype was 74% (23/31) in BRAF-mutated SIRT1-positive tumors in contrast to only 6.3% (28/441) in all other subtypes combined (i.e., BRAF-wild-type or SIRT1-negative tumors).
Figure 3.
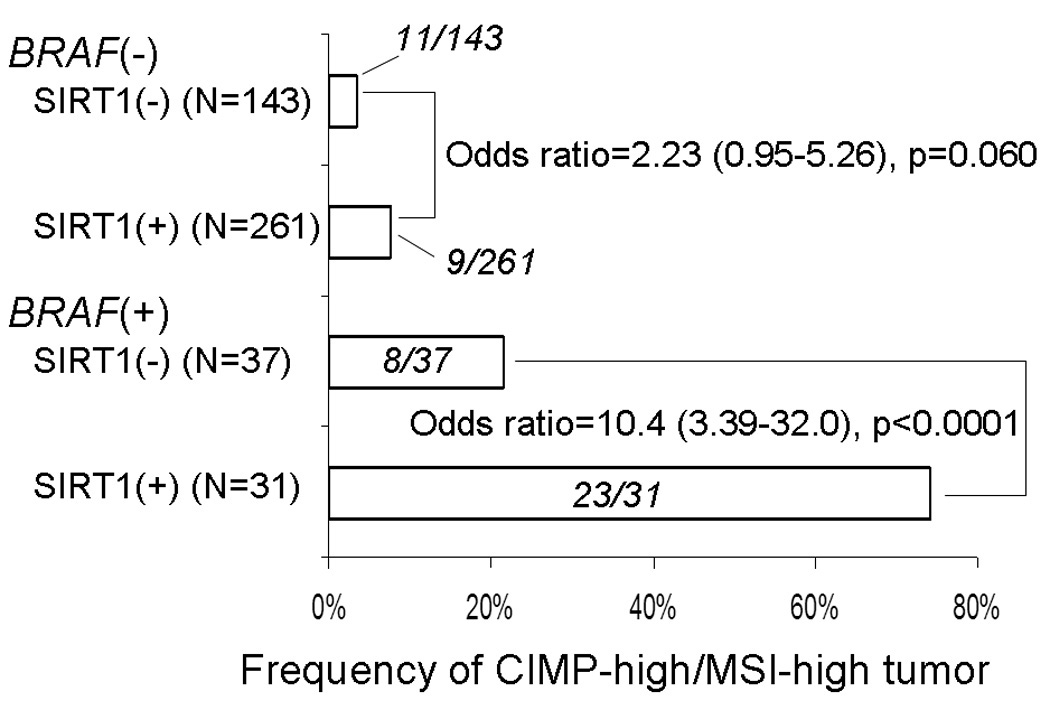
Frequency of the CIMP-high/MSI-high phenotype colorectal cancers stratified by SIRT1 and BRAF status.
SIRT1 is independently associated with CIMP-high MSI-high subtype
We performed multivariate logistic regression analysis, to confirm that the relation between SIRT1 and MSI-high CIMP-high subtype was independent of any other clinical and molecular variables (Table 3). SIRT1 was associated with CIMP-high MSI-high (multivariate OR, 3.20; 95% CI, 1.35–7.59; p=0.008) independent of any other variables. Mucinous component, high tumor grade and FASN expression were also independently associated with SIRT1. However, significance levels were lower (p values between 0.01 and 0.05) and any of these associations might be a chance event given multiple hypothesis testing.
Table 3.
Multivariate analysis of the relations with SIRT1 in colorectal cancer
| Variable independently associated with SIRT1 |
Multivariate odds ratio (95% confidence interval) |
P value |
|---|---|---|
| CIMP-high MSI-high (vs. all other MSI CIMP subtypes) |
3.20 (1.35–7.59) | 0.008 |
| Any mucinous component (vs. 0% mucin) | 1.86 (1.15–3.01) | 0.01 |
| High tumor grade (vs. low grade) | 2.71 (1.19–6.15) | 0.02 |
| FASN (fatty acid synthase) | 1.95 (1.03–3.69) | 0.04 |
Multivariate logistic regression analysis assessing the relations with SIRT1 included age, sex, body mass index, tumor location, stage, grade, mucin, signet ring cells, MSI/CIMP subtype, p53, FASN, COX-2, β-catenin, LINE-1, KRAS, PIK3CA and BRAF. Only significant variables are listed.
SIRT1 expression and patient survival
We assessed the influence of SIRT1 overexpression on survival of patients with stage I–IV colorectal cancers. In Kaplan-Meier analysis, SIRT1 expression was not related with colorectal cancer-specific (log rank p=0.63) or overall survival (log rank p =0.87). We performed Cox regression analysis to assess mortalities according to SIRT1 status (Table 4). For both cancer-specific and overall mortalities, SIRT1 was not significantly related with patient mortality in univariate analysis, stage-matched analysis, or multivariate analysis. When we limited cases to only colon cancers, SIRT1 remained unrelated with patient outcome, despite the fact that we have previously shown that molecular features in colon cancer such as CIMP, BRAF mutation and LINE-1 methylation are highly associated with prognosis in our cohort studies.31, 32
Table 4.
SIRT1 expression and patient mortality in colorectal cancer
| Total N | Cancer-specific mortality | Overall mortality | ||||||||
|---|---|---|---|---|---|---|---|---|---|---|
| Deaths / person- years |
Univariate hazard ratio |
Stage- matched hazard ratio |
Multivariate hazard ratio |
Deaths / person- years |
Univariate hazard ratio |
Stage- matched hazard ratio |
Multivariate hazard ratio |
|||
| (95% confidence interval) |
(95% confidence interval) |
(95% confidence interval) |
(95% confidence interval) |
(95% confidence interval) |
(95% confidence interval) |
|||||
| Colon and rectum | ||||||||||
| SIRT1 (−) | 286 (63%) |
76/2341 | 1 (referent) | 1 (referent) | 1 (referent) | 130/2341 | 1 (referent) | 1 (referent) | 1 (referent) | |
| SIRT1 (+) | 170 (37%) |
40/1211 | 0.91 (0.62–1.34) |
0.94 (0.63–1.39) |
0.98 (0.61–1.59) |
70/1211 | 1.03 (0.77–1.38) |
1.02 (0.76–1.37) |
1.07 (0.76–1.52) |
|
| Colon | ||||||||||
| SIRT1 (−) | 229 (61%) |
57/1924 | 1 (referent) | 1 (referent) | 1 (referent) | 103/1924 | 1 (referent) | 1 (referent) | 1 (referent) | |
| SIRT1 (+) | 147 (39%) |
36/1043 | 1.02 (0.67–1.54) |
0.99 (0.64–1.53) |
1.18 (0.69–2.00) |
62/1043 | 1.10 (0.80–1.52) |
1.06 (0.76–1.47) |
1.20 (0.82–1.75) |
|
The multivariate, stage-matched conditional Cox model included age, year of diagnosis, sex, body mass index, tumor location, stage, grade, KRAS, BRAF, PIK3CA, p53, COX2, FASN, β-catenin, LINE-1 methylation, microsatellite instability, and the CpG island methylator phenotype.
We examined whether SIRT1 was associated with patient mortality in any of the strata of clinical or molecular variables (such as age, sex, tumor stage, location, CIMP, MSI, BRAF, LINE-1, etc.). However, there was no evidence for significant interaction between SIRT1 and any of the variables in survival analysis (data not shown).
DISCUSSION
We conducted this study to examine the relations of the class III histone deacetylase (HDAC) SIRT1 with the CpG island methylator phenotype (CIMP), related molecular events and patient outcome in colorectal cancer. Molecular correlates with SIRT1 activation may be important for better understanding of epigenetic and epigenomic aberrations during the carcinogenic process. We have found that SIRT1 expression is significantly associated with CIMP-high and microsatellite instability (MSI). Moreover, SIRT1 expression is significantly associated with the CIMP-high MSI-high phenotype, independent of other clinical and molecular variables. In contrast, SIRT1 expression is not related with global DNA methylation level as measured in LINE-1 repetitive sequence. Our data support the hypothesis that SIRT1 is related with methylation at individual CpG islands, but not with global DNA methylation, in colorectal cancer.
Studying molecular changes is important in cancer research.47–53 To measure DNA methylation, we utilized real-time PCR (MethyLight technology) for DNA methylation at the 8 CIMP-specific loci 30 and 8 other CpG islands. We also utilized Pyrosequencing to measure LINE-1 methylation that has been correlated with cellular 5-methylcytosine level (i.e., genome-wide DNA methylation level).41 Our resource of a large number of colorectal cancers derived from the two prospective cohort studies has enabled us to precisely estimate the frequency of colorectal cancers with a specific molecular feature (such as SIRT1 overexpression, CIMP-high, MSI-high, etc.). The large number of cases has also provided a sufficient power in our multivariate logistic regression analysis and survival analysis.
Recent studies have reported that up-regulation of SIRT1 may prolong cell survival through multiple mechanisms, and play an important role in the regulation of epigenetic alterations.1, 2, 16, 17 In addition, SIRT1 silences genes through deacetylation of the histone residue, H4K16.8, 54, 55 Our data are likely important, because no study has demonstrated the relationship between SIRT1 and CIMP in human colorectal cancer. On the other hand, our data do not support a direct link between SIRT1 and genome-wide DNA methylation level. SIRT1 has been reported to localize to the promoters of several aberrantly silenced tumor suppressor genes in colon cancer cells, in which CpG islands are hypermethylated, but not to these same promoters in cell lines in which the promoters are not hypermethylated and the genes are expressed.16 These experimental data are consistent with our data of the positive association between SIRT1 and CIMP-high, but no significant relation between SIRT1 and genome-wide DNA methylation level.
With regard to the relationship between MSI and HDACs, a recent study has reported the presence of a truncating mutation in HDAC2 (class I) in MSI-high colorectal cancers.56 However, no study has reported the relation between SIRT1 and MSI. It is important to analyze both CIMP and MSI to decipher the interrelationship between SIRT1, CIMP and MSI. In the current study, we have shown the significant association between SIRT1 and the CIMP-high MSI-high subtype, and it is particularly strong among BRAF-mutated cancers. Further studies are necessary to elucidate the relation between SIRT1 activity, BRAF, MSI and CIMP.
Recent studies have reported that epigenetic inactivation of HIC1 results in up-regulation of SIRT1, which deacetylates p53, and that SIRT1 down-regulates p53 through histone deacetylation.15, 16 In addition, SIRT1 has been reported to down-regulate β-catenin through deacetylation and suppresses its ability to facilitate transcription and cell proliferation.17 However, we failed to show associations of SIRT1 with HIC1 methylation, p53 expression and β-catenin activation. Possible explanations include a difference in patient cohorts, and false positive/negative results in immunohistochemistry. In particular, the presence of poorly preserved tissue specimens might show false negative results on either SIRT1 or β-catenin, which might obscure the inverse relation between nuclear β-catenin and SIRT1 expression. Nonetheless, our classification of SIRT1 status appeared to be valid, since we were able to show the strong association between SIRT1 and the CIMP-high MSI-high subtype.
SIRT1 has been reported to be induced by calorie restriction in multiple tissues of mammals.3–5 Moreover, at the cellular level, SIRT1 may facilitate this process by regulating energy metabolism.8 Although we have shown no significant relation between patient body mass index and SIRT1 expression, we have shown the relation between SIRT1 and FASN. These results suggest that SIRT1 may cooperate with FASN in regulating energy metabolism in cancer cells.
Many studies have reported anti-tumor effects of HDAC inhibitors, DNA methyltransferase inhibitors and histone lysine demethylases.1, 2, 57, 58 Interestingly, a recent study has reported that blocking SIRT1 function synergizes with both promoter demethylation and inhibition of class I and II HDACs for gene reactivation.16 Moreover, this inhibition of SIRT1 leads to gene reactivation even with retention of DNA methylation.16 These results suggest new directions for targeting reversal of abnormal gene silencing and demonstrate the importance of ongoing and future studies, which may lead to the eventual translation into clinical practice. In the current study, we have demonstrated a significant association between SIRT1 and CIMP-high MSI-high colorectal cancer. These findings may indicate that therapies targeting SIRT1 may be particularly useful for this CIMP-high MSI-high subtype of cancer.
In conclusion, SIRT1 expression is significantly associated with CIMP-high MSI-high status, particularly in the presence of BRAF mutation. Our data also indicate that SIRT1 is related with DNA methylation in gene-specific CpG islands, rather than global DNA methylation level. Considering that SIRT1 is a promising target of chemotherapy and chemoprevention, our findings may have considerable clinical implications.
Supplementary Material
Acknowledgments
We deeply thank the Nurses’ Health Study and Health Professionals Follow-up Study cohort participants who have generously agreed to provide us with biological specimens and information through responses to questionnaires. We thank Frank Speizer, Walter Willett, Susan Hankinson, Graham Colditz, Meir Stampfer, and many other staff members who implemented and have maintained the cohort studies.
Funding: This work was supported by The U.S. National Institute of Health (NIH) grants P01 CA87969, P01 CA55075, P50 CA127003 and K07 CA122826 (to S.O.), and in part by grants from the Bennett Family Fund and the Entertainment Industry Foundation (EIF) National Colorectal Cancer Research Alliance (NCCRA). K.N. was supported by a fellowship grant from the Japan Society for Promotion of Science. These funding sponsors had no role or involvement in the study design, the collection, analysis and interpretation of data, or writing and submission of the manuscript.
Footnotes
Disclosure/Conflict of Interest: None exists.
References
- 1.Mariadason JM. HDACs and HDAC inhibitors in colon cancer. Epigenetics. 2008;3:28–37. doi: 10.4161/epi.3.1.5736. [DOI] [PubMed] [Google Scholar]
- 2.Esteller M. Cancer epigenomics: DNA methylomes and histone-modification maps. Nat Rev Genet. 2007;8:286–298. doi: 10.1038/nrg2005. [DOI] [PubMed] [Google Scholar]
- 3.Cohen HY, Miller C, Bitterman KJ, et al. Calorie restriction promotes mammalian cell survival by inducing the SIRT1 deacetylase. Science. 2004;305:390–392. doi: 10.1126/science.1099196. [DOI] [PubMed] [Google Scholar]
- 4.Guarente L, Picard F. Calorie restriction--the SIR2 connection. Cell. 2005;120:473–482. doi: 10.1016/j.cell.2005.01.029. [DOI] [PubMed] [Google Scholar]
- 5.Michan S, Sinclair D. Sirtuins in mammals: insights into their biological function. Biochem J. 2007;404:1–13. doi: 10.1042/BJ20070140. [DOI] [PMC free article] [PubMed] [Google Scholar]
- 6.Bishop NA, Guarente L. Genetic links between diet and lifespan: shared mechanisms from yeast to humans. Nat Rev Genet. 2007;8:835–844. doi: 10.1038/nrg2188. [DOI] [PubMed] [Google Scholar]
- 7.Olaharski AJ, Rine J, Marshall BL, et al. The flavoring agent dihydrocoumarin reverses epigenetic silencing and inhibits sirtuin deacetylases. PLoS Genet. 2005;1:e77. doi: 10.1371/journal.pgen.0010077. [DOI] [PMC free article] [PubMed] [Google Scholar]
- 8.Guarente L. Sir2 links chromatin silencing, metabolism, and aging. Genes Dev. 2000;14:1021–1026. [PubMed] [Google Scholar]
- 9.Guarente L, Kenyon C. Genetic pathways that regulate ageing in model organisms. Nature. 2000;408:255–262. doi: 10.1038/35041700. [DOI] [PubMed] [Google Scholar]
- 10.Nemoto S, Fergusson MM, Finkel T. Nutrient availability regulates SIRT1 through a forkhead-dependent pathway. Science. 2004;306:2105–2108. doi: 10.1126/science.1101731. [DOI] [PubMed] [Google Scholar]
- 11.Vaziri H, Dessain SK, Ng Eaton E, et al. hSIR2(SIRT1) functions as an NAD-dependent p53 deacetylase. Cell. 2001;107:149–159. doi: 10.1016/s0092-8674(01)00527-x. [DOI] [PubMed] [Google Scholar]
- 12.Luo J, Nikolaev AY, Imai S, et al. Negative control of p53 by Sir2alpha promotes cell survival under stress. Cell. 2001;107:137–148. doi: 10.1016/s0092-8674(01)00524-4. [DOI] [PubMed] [Google Scholar]
- 13.Langley E, Pearson M, Faretta M, et al. Human SIR2 deacetylates p53 and antagonizes PML/p53-induced cellular senescence. Embo J. 2002;21:2383–2396. doi: 10.1093/emboj/21.10.2383. [DOI] [PMC free article] [PubMed] [Google Scholar]
- 14.Motta MC, Divecha N, Lemieux M, et al. Mammalian SIRT1 represses forkhead transcription factors. Cell. 2004;116:551–563. doi: 10.1016/s0092-8674(04)00126-6. [DOI] [PubMed] [Google Scholar]
- 15.Chen WY, Wang DH, Yen RC, et al. Tumor suppressor HIC1 directly regulates SIRT1 to modulate p53-dependent DNA-damage responses. Cell. 2005;123:437–448. doi: 10.1016/j.cell.2005.08.011. [DOI] [PubMed] [Google Scholar]
- 16.Pruitt K, Zinn RL, Ohm JE, et al. Inhibition of SIRT1 reactivates silenced cancer genes without loss of promoter DNA hypermethylation. PLoS Genet. 2006;2:e40. doi: 10.1371/journal.pgen.0020040. [DOI] [PMC free article] [PubMed] [Google Scholar]
- 17.Firestein R, Blander G, Michan S, et al. The SIRT1 deacetylase suppresses intestinal tumorigenesis and colon cancer growth. PLoS ONE. 2008;3:e2020. doi: 10.1371/journal.pone.0002020. [DOI] [PMC free article] [PubMed] [Google Scholar]
- 18.Toyota M, Ahuja N, Ohe-Toyota M, et al. CpG island methylator phenotype in colorectal cancer. Proc Natl Acad Sci U S A. 1999;96:8681–8686. doi: 10.1073/pnas.96.15.8681. [DOI] [PMC free article] [PubMed] [Google Scholar]
- 19.Issa JP, Shen L, Toyota M. CIMP, at Last. Gastroenterology. 2005;129:1121–1124. doi: 10.1053/j.gastro.2005.07.040. [DOI] [PubMed] [Google Scholar]
- 20.Grady WM. CIMP and colon cancer gets more complicated. Gut. 2007;56:1498–1500. doi: 10.1136/gut.2007.125732. [DOI] [PMC free article] [PubMed] [Google Scholar]
- 21.Teodoridis JM, Hardie C, Brown R. CpG island methylator phenotype (CIMP) in cancer: Causes and implications. Cancer Lett. 2008;268:177–186. doi: 10.1016/j.canlet.2008.03.022. [DOI] [PubMed] [Google Scholar]
- 22.Whitehall VL, Wynter CV, Walsh MD, et al. Morphological and molecular heterogeneity within nonmicrosatellite instability-high colorectal cancer. Cancer Res. 2002;62:6011–6014. [PubMed] [Google Scholar]
- 23.Samowitz W, Albertsen H, Herrick J, et al. Evaluation of a large, population-based sample supports a CpG island methylator phenotype in colon cancer. Gastroenterology. 2005;129:837–845. doi: 10.1053/j.gastro.2005.06.020. [DOI] [PubMed] [Google Scholar]
- 24.Weisenberger DJ, Siegmund KD, Campan M, et al. CpG island methylator phenotype underlies sporadic microsatellite instability and is tightly associated with BRAF mutation in colorectal cancer. Nat Genet. 2006;38:787–793. doi: 10.1038/ng1834. [DOI] [PubMed] [Google Scholar]
- 25.Ogino S, Goel A. Molecular classification and correlates in colorectal cancer. J Mol Diagn. 2008;10:13–27. doi: 10.2353/jmoldx.2008.070082. [DOI] [PMC free article] [PubMed] [Google Scholar]
- 26.Derks S, Postma C, Carvalho B, et al. Integrated analysis of chromosomal, microsatellite and epigenetic instability in colorectal cancer identifies specific associations between promoter methylation of pivotal tumour suppressor and DNA repair genes and specific chromosomal alterations. Carcinogenesis. 2008;29:434–439. doi: 10.1093/carcin/bgm270. [DOI] [PubMed] [Google Scholar]
- 27.Stunkel W, Peh BK, Tan YC, et al. Function of the SIRT1 protein deacetylase in cancer. Biotechnol J. 2007;2:1360–1368. doi: 10.1002/biot.200700087. [DOI] [PubMed] [Google Scholar]
- 28.Colditz GA, Hankinson SE. The Nurses' Health Study: lifestyle and health among women. Nat Rev Cancer. 2005;5:388–396. doi: 10.1038/nrc1608. [DOI] [PubMed] [Google Scholar]
- 29.Chan AT, Ogino S, Fuchs CS. Aspirin and the Risk of Colorectal Cancer in Relation to the Expression of COX-2. New Engl J Med. 2007;356:2131–2142. doi: 10.1056/NEJMoa067208. [DOI] [PubMed] [Google Scholar]
- 30.Ogino S, kawasaki T, Kirkner GJ, et al. Evaluation of markers for CpG island methylator phenotype (CIMP) in colorectal cancer by a large population-based sample. J Mol Diagn. 2007;9:305–314. doi: 10.2353/jmoldx.2007.060170. [DOI] [PMC free article] [PubMed] [Google Scholar]
- 31.Ogino S, Nosho K, Kirkner GJ, et al. A cohort study of tumoral LINE-1 hypomethylation and prognosis in colon cancer. J Natl Cancer Inst. 2008;100:1734–1738. doi: 10.1093/jnci/djn359. [DOI] [PMC free article] [PubMed] [Google Scholar]
- 32.Ogino S, Nosho K, Kirkner GJ, et al. CpG island methylator phenotype, microsatellite instability, BRAF mutation and clinical outcome in colon cancer. Gut. 2009;58:90–96. doi: 10.1136/gut.2008.155473. [DOI] [PMC free article] [PubMed] [Google Scholar]
- 33.Ogino S, Kawasaki T, Brahmandam M, et al. Sensitive sequencing method for KRAS mutation detection by Pyrosequencing. J Mol Diagn. 2005;7:413–421. doi: 10.1016/S1525-1578(10)60571-5. [DOI] [PMC free article] [PubMed] [Google Scholar]
- 34.Ogino S, Kawasaki T, Kirkner GJ, et al. CpG island methylator phenotype-low (CIMP-low) in colorectal cancer: possible associations with male sex and KRAS mutations. J Mol Diagn. 2006;8:582–588. doi: 10.2353/jmoldx.2006.060082. [DOI] [PMC free article] [PubMed] [Google Scholar]
- 35.Nosho K, Kawasaki T, Ohnishi M, et al. PIK3CA mutation in colorectal cancer: relationship with genetic and epigenetic alterations. Neoplasia. 2008;10:534–541. doi: 10.1593/neo.08336. [DOI] [PMC free article] [PubMed] [Google Scholar]
- 36.Ogino S, Cantor M, Kawasaki T, et al. CpG island methylator phenotype (CIMP) of colorectal cancer is best characterised by quantitative DNA methylation analysis and prospective cohort studies. Gut. 2006;55:1000–1006. doi: 10.1136/gut.2005.082933. [DOI] [PMC free article] [PubMed] [Google Scholar]
- 37.Eads CA, Danenberg KD, Kawakami K, et al. MethyLight: a high-throughput assay to measure DNA methylation. Nucleic Acids Res. 2000;28:E32. doi: 10.1093/nar/28.8.e32. [DOI] [PMC free article] [PubMed] [Google Scholar]
- 38.Ogino S, kawasaki T, Brahmandam M, et al. Precision and performance characteristics of bisulfite conversion and real-time PCR (MethyLight) for quantitative DNA methylation analysis. J Mol Diagn. 2006;8:209–217. doi: 10.2353/jmoldx.2006.050135. [DOI] [PMC free article] [PubMed] [Google Scholar]
- 39.Nosho K, Irahara N, Shima K, et al. Comprehensive biostatistical analysis of CpG island methylator phenotype in colorectal cancer using a large population-based sample. PLoS ONE. 2008;3:e3698. doi: 10.1371/journal.pone.0003698. [DOI] [PMC free article] [PubMed] [Google Scholar]
- 40.Ogino S, Kawasaki T, Nosho K, et al. LINE-1 hypomethylation is inversely associated with microsatellite instability and CpG island methylator phenotype in colorectal cancer. Int J Cancer. 2008;122:2767–2773. doi: 10.1002/ijc.23470. [DOI] [PMC free article] [PubMed] [Google Scholar]
- 41.Yang AS, Estecio MR, Doshi K, et al. A simple method for estimating global DNA methylation using bisulfite PCR of repetitive DNA elements. Nucleic Acids Res. 2004;32:e38. doi: 10.1093/nar/gnh032. [DOI] [PMC free article] [PubMed] [Google Scholar]
- 42.Ogino S, kawasaki T, Kirkner GJ, et al. Loss of nuclear p27 (CDKN1B/KIP1) in colorectal cancer is correlated with microsatellite instability and CIMP. Mod Pathol. 2007;20:15–22. doi: 10.1038/modpathol.3800709. [DOI] [PubMed] [Google Scholar]
- 43.Ogino S, Nosho K, Meyerhardt JA, et al. Cohort Study of Fatty Acid Synthase Expression and Patient Survival in Colon Cancer. J Clin Oncol. 2008;26:5713–5720. doi: 10.1200/JCO.2008.18.2675. [DOI] [PMC free article] [PubMed] [Google Scholar]
- 44.Ogino S, Brahmandam M, Cantor M, et al. Distinct molecular features of colorectal carcinoma with signet ring cell component and colorectal carcinoma with mucinous component. Mod Pathol. 2006;19:59–68. doi: 10.1038/modpathol.3800482. [DOI] [PubMed] [Google Scholar]
- 45.Kawasaki T, Nosho K, Ohnishi M, et al. Correlation of beta-catenin localization with cyclooxygenase-2 expression and CpG island methylator phenotype (CIMP) in colorectal cancer. Neoplasia. 2007;9:569–577. doi: 10.1593/neo.07334. [DOI] [PMC free article] [PubMed] [Google Scholar]
- 46.Durrleman S, Simon R. Flexible regression models with cubic splines. Stat Med. 1989;8:551–561. doi: 10.1002/sim.4780080504. [DOI] [PubMed] [Google Scholar]
- 47.Dong Y, Wang J, Sheng Z, et al. Downregulation of EphA1 in colorectal carcinomas correlates with invasion and metastasis. Mod Pathol. 2009;22:151–160. doi: 10.1038/modpathol.2008.188. [DOI] [PubMed] [Google Scholar]
- 48.Hamilton SR. Targeted therapy of cancer: new roles for pathologists in colorectal cancer. Mod Pathol. 2008;21(Suppl 2):S23–S30. doi: 10.1038/modpathol.2008.14. [DOI] [PubMed] [Google Scholar]
- 49.Lugli A, Tzankov A, Zlobec I, et al. Differential diagnostic and functional role of the multi-marker phenotype CDX2/CK20/CK7 in colorectal cancer stratified by mismatch repair status. Mod Pathol. 2008;21:1403–1412. doi: 10.1038/modpathol.2008.117. [DOI] [PubMed] [Google Scholar]
- 50.Sung CO, Seo JW, Kim KM, et al. Clinical significance of signet-ring cells in colorectal mucinous adenocarcinoma. Mod Pathol. 2008;21:1533–1541. doi: 10.1038/modpathol.2008.170. [DOI] [PubMed] [Google Scholar]
- 51.Ye SR, Yang H, Li K, et al. Human leukocyte antigen G expression: as a significant prognostic indicator for patients with colorectal cancer. Mod Pathol. 2007;20:375–383. doi: 10.1038/modpathol.3800751. [DOI] [PubMed] [Google Scholar]
- 52.Minoo P, Zlobec I, Baker K, et al. Prognostic significance of mammalian sterile20-like kinase 1 in colorectal cancer. Mod Pathol. 2007;20:331–338. doi: 10.1038/modpathol.3800740. [DOI] [PubMed] [Google Scholar]
- 53.Kaifi JT, Reichelt U, Quaas A, et al. L1 is associated with micrometastatic spread and poor outcome in colorectal cancer. Mod Pathol. 2007;20:1183–1190. doi: 10.1038/modpathol.3800955. [DOI] [PubMed] [Google Scholar]
- 54.Kimura A, Umehara T, Horikoshi M. Chromosomal gradient of histone acetylation established by Sas2p and Sir2p functions as a shield against gene silencing. Nat Genet. 2002;32:370–377. doi: 10.1038/ng993. [DOI] [PubMed] [Google Scholar]
- 55.Suka N, Luo K, Grunstein M. Sir2p and Sas2p opposingly regulate acetylation of yeast histone H4 lysine16 and spreading of heterochromatin. Nat Genet. 2002;32:378–383. doi: 10.1038/ng1017. [DOI] [PubMed] [Google Scholar]
- 56.Ropero S, Fraga MF, Ballestar E, et al. A truncating mutation of HDAC2 in human cancers confers resistance to histone deacetylase inhibition. Nat Genet. 2006;38:566–569. doi: 10.1038/ng1773. [DOI] [PubMed] [Google Scholar]
- 57.Konishi K, Issa JP. Targeting aberrant chromatin structure in colorectal carcinomas. Cancer J. 2007;13:49–55. doi: 10.1097/PPO.0b013e31803c72fe. [DOI] [PubMed] [Google Scholar]
- 58.Shi Y. Histone lysine demethylases: emerging roles in development, physiology and disease. Nat Rev Genet. 2007;8:829–833. doi: 10.1038/nrg2218. [DOI] [PubMed] [Google Scholar]
Associated Data
This section collects any data citations, data availability statements, or supplementary materials included in this article.