

Abstract
Nicotine exerts its central effects by activating pre- and post-synaptic nicotinic acetylcholine receptors (nAChRs). Pre-synaptic nAChRs modulate the release of many neurotransmitters that bind to post-synaptic receptors. These may be coupled to the activation of cytosolic phospholipase A2 (cPLA2), which hydrolyzes arachidonic acid (AA) from membrane phospholipids. We hypothesized that nicotine would modify brain signaling involving AA by binding to nAChRs. Nicotine (0.1 mg/kg s.c.) or saline was injected 2 or 10 min before infusing [1-14C]AA in unanesthetized rats. The AA incorporation coefficient k* (a marker of the AA signal) was measured in 80 brain regions by quantitative autoradiography. Nicotine, compared to saline, when given 2 min before [1-14C]AA, significantly decreased k* for AA in 26 regions, including cerebral cortex, thalamus and habenula-interpeduncular regions, by 13% to 45%. These decreases could be entirely prevented by pretreatment with mecamylamine (1.0 mg/kg s.c.). When given 10 min before [1-14C]AA, nicotine did not alter any value of k*. In summary, nicotine given to unanesthetized rats rapidly reduces signaling involving AA in brain regions containing nAChRs, likely by modulating pre-synaptic release of neurotransmitters. The effect shows rapid desensitization and is produced at a nicotine dose equivalent to smoking one cigarette in humans.
Keywords: arachidonic acid, imaging, receptors, mecamylamine, nicotine, phospholipase A2
Introduction
Nicotine, as the S(−)-isomer, is a major component in tobacco products and is an important cause of addiction (Henningfield and Fant 1999). It binds to and activates nicotinic acetylcholine receptors (nAChRs) and can improve memory in animals and humans (Henningfield and Fant 1999). nAChRs are thought to be involved in the pathophysiology of autism, schizophrenia, Parkinson disease, Alzheimer disease and depression, and to change with aging (Gotti et al 2006). They are widely distributed in brain, particularly at pre-synaptic nerve terminals, where they modulate the release of acetylcholine, γ-aminobutyric acid (GABA), dopamine, serotonin and glutamate in a concentration- and region-dependent manner. This presynaptic modulation is considered to be their predominant role in brain (Gotti et al 2006). nAChRs also are present on postsynaptic nerve terminals, neuronal cell bodies and dendrites (Dajas-Bailador and Wonnacott 2004; Gotti et al 2006).
nAChRs are pentameric ligand-gated ion channels selective for Ca2+ and Na+. Combinations of different subunits produce different nAChR subtypes with distinct pharmacological properties. The homomeric α7 and heteromeric α4β receptor subtypes are highly expressed in rat brain (Gotti et al 2006). α4β2 nAChRs, which account for 90% of nAChRs, have a high affinity for nicotine, a moderate Ca2+ relative to Na+ permeability, and are reported to undergo desensitization within 10–15 min in interneurons of the rat hippocampus and in whole brain slices, as well as in other in vitro preparations (Alkondon et al 2000; Dajas-Bailador and Wonnacott 2004; Quick and Lester 2002). α7 nAChRs have a low affinity for nicotine, a higher Ca2+ permeability than the other subtypes, and become desensitized within milliseconds in hippocampal neuron cultures (Dajas-Bailador and Wonnacott 2004; Quick and Lester 2002; Wang and Sun 2005).
The released neurotransmitters (e.g., acetylcholine, dopamine, serotonin and/or glutamate), resulting from nicotine binding to pre-synaptic nAChRs, can bind to post-synaptic neuroreceptors (e.g. cholinergic muscarinic M1,3,5, dopaminergic D2-like, serotonergic 5-HT2A/2C and N-methyl-D-aspartate (NMDA) receptors) that are coupled to the activation of arachidonic acid (AA)-selective cytosolic phospholipase A2 (cPLA2). This results in the release of AA from membrane phospholipid (Clark et al 1995; Felder et al 1990a; Felder et al 1990b; Vial and Piomelli 1995; Weichel et al 1999).
Brain cPLA2 activation involving AA can be imaged in vivo by infusing radiolabeled AA intravenously following the administration of a drug acting at a cPLA2-coupled neuroreceptor, then measuring tracer uptake into brain phospholipid in terms of an incorporation coefficient k* (brain radioactivity/integrated plasma radioactivity). k* for AA is independent of changes in cerebral blood flow, and thus is a specific marker of the brain AA signal (Basselin et al 2006a; Basselin et al 2006b; Bhattacharjee et al 2005; Robinson et al 1992). Because AA is nutritionally essential and cannot be synthesized de novo in brain nor converted in brain from its shorter-chain linoleic acid (18:2n-6) precursor, k* for AA represents the plasma AA that has replaced the brain AA that was released by cPLA2 activation and then lost by metabolism to eicosanoids such as prostaglandin E2 (PGE2) (Basselin et al 2006b).
Since nicotine can increase synaptic concentrations of various neurotransmitters (see above) and thereby modulate AA release at postsynaptic sites (Vijayaraghavan et al 1995), we hypothesized that acute administration of nicotine would alter k* for AA in brain regions having nAChRs. Since nicotine readily enters the brain (Ghosheh et al 1999) and nAChRs are known to be rapidly desensitized following exposure to nicotine (Alkondon et al 2000; Quick and Lester 2002), we also predicted that nicotine’s signaling effects would be rapid and transient.
To test these hypotheses, nicotine (0.1 mg/kg, s.c.) was injected 2 min and 10 min before infusing [1-14C]AA intravenously in unanesthetized rats. AA incorporation coefficients k* were measured 20 min after beginning tracer infusion with quantitative autoradiography in 80 identified brain regions. In addition, the nonspecific nAChR antagonist, mecamylamine (1.0 mg/kg, s.c.), was given alone or before nicotine administration. The doses and time points of measurement were based on studies of brain glucose metabolism in unanesthetized rats (London et al 1988a; London et al 1988b).
Materials and methods
Animals
Experiments were conducted following the "Guide for the Care and Use of Laboratory Animals" (National Institutes of Health Publication No. 86–23) and were approved by the Animal Care and Use Committee of the Eunice Kennedy Shriver National Institute of Child Health and Human Development. Three-month-old male Fischer CDF (F-344)/CrlBR rats (Charles River Laboratories, Wilmington, MA) were housed in an animal facility in which temperature, humidity and light cycle were regulated, with free access to water and food (Rodent NIH-31 auto 18–4 diet, Zeigler Bros, Gardners, PA). The diet contained (as percent of total fatty acids) 20.1% saturated, 22.5% monounsaturated, 47.9% linoleic, 5.1% α-linolenic, 0.02% AA, 2.0% eicosapentaenoic, and 2.3% docosahexaenoic acid.
Chemicals
[1-14C]AA in ethanol (50 mCi/mmol, 99% pure) was purchased from Moravek Biochemicals (Brea, CA). (−)-Nicotine hydrogen tartrate, mecamylamine hydrochloride, HEPES, and fatty acid-free bovine serum albumin were purchased from Sigma Chemical Co. (St. Louis, MO). Sodium pentobarbital was purchased from Abbott Laboratories (North Chicago, IL). Nicotine was dissolved in saline (0.9% NaCl), and solution pH was adjusted to 7.0 with 1N NaOH. Nicotine doses are expressed as the free base.
Arterial and venous catheter placement
A rat was anesthetized with 2–3% halothane in O2, and PE 50 polyethylene catheters were inserted into the right femoral artery and vein, as described previously (Basselin et al 2006a). The wound was closed with surgical clips and the rat was wrapped loosely, with its upper body remaining free, in a fast-setting plaster cast that then was taped to a wooden block. Surgery lasted 20–25 min. The rat was allowed to recover from anesthesia for 3–4 h in a quiet environment maintained at 23°C. Arterial systolic and diastolic pressures and heart rate were measured with a blood pressure recorder (Model 2400, Gould, Cleveland, OH). Arterial blood pH, partial pressure of oxygen (pO2) and partial pressure of carbon dioxide (pCO2) were measured with a blood gas analyzer (Model 248, Bayer Health Care, Norwood, MA). All physiological parameters were measured before drug injection and 10 min after [1-14C]AA infusion.
Treatment schedules
Rats were injected with 0.1 mg/kg nicotine, followed at 2 min or 10 min by an intravenous infusion of [1-14C]AA. Control animals were given saline followed at 2 min by [1-14C]AA. Additional groups were administered mecamylamine (1.0 mg/kg) at 17 min before [1-14C]AA, or mecamylamine (1.0 mg/kg ) at 15 min followed with 0.1 mg/kg nicotine at 2 min before [1-14C]AA. Drugs as well as saline were injected s.c. in a volume of 1 ml/kg.
Radiolabeled AA infusion
A pump (Model 22, Harvard Apparatus, Natick, MA) was used to infuse a rat intravenously at a constant rate of 0.4 ml/min for 5 min, with [1-14C]AA (170 µCi/kg) in 2 ml of 5 mM HEPES buffer, pH 7.4, containing 50 mg/ml fatty acid-free bovine serum albumin. Thirteen timed arterial aliquots (80 – 120 µl) were collected before, during, and after tracer infusion to time of death 20 min later. At 20 min after starting the infusion, the rat was killed with an overdose of sodium pentobarbital (80 mg/kg, i.v.) and then decapitated. The brain was removed (< 30 s), frozen in 2-methylbutane at −40°C, and stored at −80°C for later quantitative autoradiography.
Radiolabeled unesterified AA in plasma
The arterial blood samples were centrifuged immediately (30 s at 18,000 g). Total lipids were extracted from 30 µl of plasma, with 3 ml chloroform:methanol (2:1, by vol) and 1.5 ml 0.1 M KCl, using the Folch procedure (Folch et al 1957). As reported, more than 97% of plasma radioactivity was radiolabeled AA at 5 min, and brain phospholipids accounted for greater than 81% of brain lipid radioactivity and remained stable for 2 hours (Basselin et al 2006a).
Quantitative autoradiography
Frozen brains were cut in serial 20-µm thick coronal sections in a cryostat at −20°C. Sections were exposed together with calibrated [14C]methylmethacrylate standards to Ektascan C/RA film (Eastman Kodak Company, Health Imaging Group, Rochester, NY) for 5 weeks. Brain regions from autoradiographs, identified from a stereotaxic rat brain atlas (Paxinos and Watson 1987), were sampled in both hemispheres. The average of bilateral measurements for each region from three consecutive brain sections was used to calculate regional radioactivity (nCi/g of brain) by digital quantitative densitometry, using the public domain NIH Image program 1.62 (developed at the U.S. National Institutes of Health and available on the Internet at http://rsb.info.nih.gov/nih-image/). Regional AA incorporation coefficients k* (ml plasma/s/g brain) were calculated as (Robinson et al 1992),
| (Eq.1) |
(nCi/ml) equals plasma radioactivity determined by scintillation counting, (20 min)(nCi/g) equals brain radioactivity determined by densitometry at 20 min, and t (min) equals time after beginning of [1-14C]AA infusion.
Brain prostaglandin E2
In separate experiments, rats were given nicotine (0.1 mg/kg, s.c.) or saline for 7 min. Then, they were anesthetized with Nembutal® (50 mg/kg, i.p.) and subjected to head-focused microwave irradiation (5.5 kW, 3.6 s; Cober Electronics, Stamford, CT) to stop brain metabolism. Frozen half-brains were weighed, homogenized with 18 vol of hexane:isopropanol (3:2 by vol) using a glass Tenbroeck homogenizer and the homogenate was centrifuged for 5 min at 800 g. Tissue residues were then rinsed with 3 × 2 vol of the same solvent. The resultant lipid extract was concentrated to dryness under nitrogen and resuspended in an enzyme immunoassay buffer provided with polyclonal PGE2 assay kit (Oxford Biochemical Research, Oxford, MI).
Statistical analysis
Data are expressed as means ± SD. Physiological parameters were analyzed by paired t-tests in the same animal before and after drug injection (GraphPad Prism Software, San Diego, CA, www.graphpad.com). The significance of drug treatments on arterial plasma radioactivity and k* values for each brain region was determined by one-way ANOVA. For each of the 80 regions, we used a one-way ANOVA to test for significant differences among group means. We set our alpha at 0.05 and all tests were two-tailed. We then applied a false discovery rate (FDR) procedure (Benjamini and Hochberg 1995) to control the false discovery rate at 0.05. Each significant ANOVA result that survived the FDR procedure then was followed up with a Bonferroni’s post hoc test for multiple mean comparisons. Our post hoc comparisons corresponded to our hypotheses and included all groups versus control, and mecamylamine + nicotine (2 min) versus nicotine (2 min).
Results
Physiology and arterial plasma radioactivity
As illustrated in table 1, nicotine (0.1 mg/kg s.c.) at 2 min significantly decreased heart rate by 24%, compared to saline. Nicotine at 2 min increased pO2 by 13%, whereas it reduced pCO2 by 12%. Mecamylamine alone decreased heart rate by 14% and blood pressure by 22%. The combination of mecamylamine plus nicotine blocked nicotine-induced heart rate response but decreased blood pressure by 20%.
Table 1.
Effects of nicotine and mecamylamine on physiological parameters.
| Saline | Nicotine 2 min | Nicotine 10 min | Mecamylamine | Mecamylamine + Nicotine 2 min | ||||||
|---|---|---|---|---|---|---|---|---|---|---|
| Before | After | Before | After | Before | After | Before | After | Before | After | |
| Body temperature (°C) | ||||||||||
| 36.7 ± 0.3 | 36.8 ± 0.4 | 36.7 ± 0.3 | 36.7 ± 0.3 | 36.4 ± 0.5 | 36.2 ± 0.5 | 36.2 ± 0.3 | 36.1 ± 0.3 | 36.5 ± 0.3 | 36.5 ± 0.5 | |
| Heart rate (beats/min) | ||||||||||
| 422 ± 31 | 438 ± 29 | 422 ± 29 | 321 ± 21*** | 416 ± 33 | 377 ± 55 | 427 ± 27 | 368 ± 25*** | 393 ± 35 | 351 ± 44 | |
| Arterial blood pressure (mmHg) | ||||||||||
| Systolic | 153 ± 21 | 152 ± 19 | 145 ± 13 | 153 ± 7 | 155 ± 15 | 153 ± 11 | 157 ± 18 | 123 ± 8*** | 148 ± 28 | 117 ± 12** |
| Diastolic | 105 ± 7 | 99 ± 7 | 93 ± 6 | 99 ± 3 | 92 ± 10 | 99 ± 5 | 98 ± 11 | 77 ± 9*** | 101 ± 9 | 82 ± 10** |
| pH | 7.44 ± 0.02 | 7.44 ± 0.01 | 7.44 ± 0.02 | 7.49 ± 0.02 | 7.44 ± 0.02 | 7.46 ± 0.02 | 7.46 ± 0.02 | 7.46 ± 0.02 | 7.47 ± 0.02 | 7.48 ± 0.01 |
| pO2 (mmHg) | 95.2 ± 7.0 | 92.2 ± 4.3 | 92.1 ± 6.9 | 104.1 ± 6.1** | 104.2 ± 4.8 | 103.2 ± 5.8 | 103.2 ± 5.9 | 107.1 ± 6.3 | 102.1 ± 7.3 | 109.7 ± 9.9 |
| pCO2 (mmHg) | 37.2 ± 2.6 | 39.9 ± 0.7 | 38.0 ± 2.3 | 33.6 ± 1.6** | 36.7 ± 2.2 | 37.5 ± 3.0 | 34.7 ± 2.7 | 37.7 ± 3.0 | 34.8 ± 2.7 | 32.6 ± 4.7 |
Values are the means ± SD (n = 10) measured before saline or drug injection (nicotine 0.1 mg/kg, s.c., mecamylamine 1.0 mg/kg, s.c.) and 10 min after starting [14C]AA infusion.
p < 0.05
p < 0.01
p < 0.001, paired t-tests were used to means in same animal before and after drug injection.
The mean integral of radioactivity in the plasma organic fraction (nCi × s)/ml, the input function in equation (1), did not differ significantly between groups: 200,957 ± 33,731 following saline; 214,412 ± 12,364 following nicotine (2 min), 173,297 ± 17,958 following nicotine (10 min); 218,876 ± 16,926 following mecamylamine and 211,397 ± 38,314 following mecamylamine plus nicotine (2 min).
Regional brain AA incorporation coefficients, k*
Figure 1 illustrates coronal autoradiographs from rats injected with saline, nicotine 2 min, nicotine 10 min, and mecamylamine plus nicotine 2 min before [1-14C]AA infusion. Compared with saline, reductions in k* for AA are evident when [1-14C]AA was injected at 2 but not 10 min following nicotine. Pretreatment with mecamylamine blocked these 2-min reductions.
Figure 1. Coronal autoradiographs showing effects of nicotine on AA incorporation coefficients k* in rats.
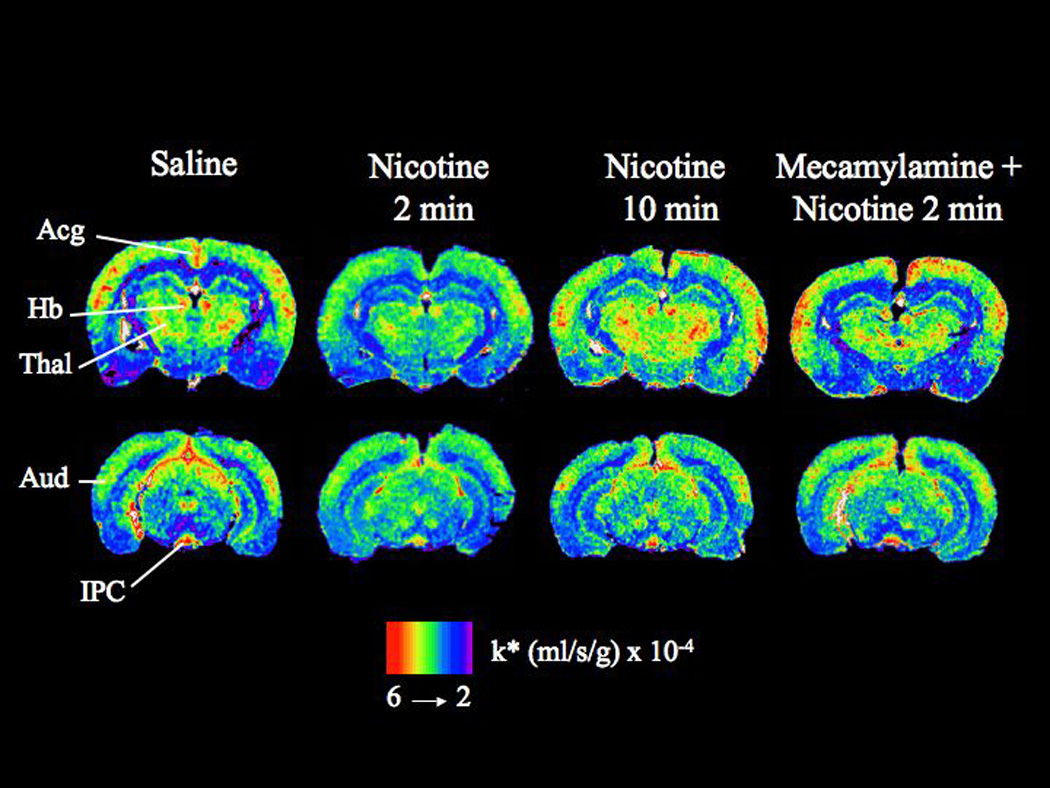
Studies involved injection of saline or nicotine and measuring k* for AA after 2 min or 10 min, and injection of nicotine after pretreatment with mecamylamine. Values of k* (ml/s/g brain × 10−4) are given on a color scale. Abbreviations: Acg, anterior cingulate cortex; Thal, thalamus; Hb, habenular nucleus; Aud, auditory cortex; IPC, interpeduncular nucleus
Nicotine, injected 2 min before [1-14C]AA, decreased k* significantly in 26 of 80 brain regions, by 13% to 45% (Table 2). Affected regions included prefrontal cortex layer IV (−25%), frontal cortex 10 layer I (−30%) and IV (−30%), frontal cortex 8 layer IV (−20%), anterior cingulate cortex (−32%), motor cortex layer V (−25%), somatosensory cortex layer II/III IV and V (−23 to −30%), auditory cortex layer I (−31%), olfactory tubercle (−26%), lateral and medial caudate putamen (−24–25%), medial septal nucleus (−29%), lateral and medial habenular nuclei (−35–39%), dorsal lateral geniculate nucleus (−34%), anteroventral and anteromedial thalamic nuclei (−24–40%), reticular thalamic nucleus (−27%), parafascicular thalamic nucleus (−39%), supraoptic nucleus (−13%), posterior hypothalamic nucleus (−26%), interpeduncular nucleus (−45%), substantia nigra (−27%) and gray matter of the cerebellar (−30%). The effects on k* dissipated by 10 min after nicotine injection.
Table 2.
Mean values of arachidonic acid incorporation coefficients k* in rats at baseline (in response to saline) and in response to nicotine and mecamylamine
| Brain Region | Saline | Nicotine 2 min | Nicotine 10 min | Mecamylamine | Mecamylamine + Nicotine 2 min | ||
|---|---|---|---|---|---|---|---|
| Telencephalon | |||||||
| Prefrontal cortex layer I | 3.48 ± 0.58 | 2.83 ± 0.41 | 3.13 ± 0.55 | 2.84 ± 0.67 | 3.18 ± 0.67 | ||
| Prefrontal cortex layer IV | 3.76 ± 0.64 | 2.83 ± 0.57** | 3.62 ± 0.55 | 3.31 ± 0.59 | 3.60 ± 0.70# | ||
| Primary olfactory cortex | 3.67 ± 0.86 | 2.88 ± 0.56 | 3.27 ± 0.65 | 3.15 ± 0.75 | 3.62 ± 0.88 | ||
| Frontal cortex (10) | |||||||
| Layer I | 4.00 ± 0.93 | 2.80 ± 0.41** | 3.31 ± 0.43 | 3.67 ± 0.82 | 3.47 ± 0.94# | ||
| Layer IV | 4.57 ± 0.86 | 3.18 ± 0.59*** | 3.89 ± 0.50 | 3.80 ± 0.57 | 4.18 ± 0.81## | ||
| Frontal cortex (8) | |||||||
| Layer I | 4.05 ± 0.75 | 3.06 ± 0.63 | 3.56 ± 0.54 | 3.39 ± 0.73 | 3.82 ± 0.98 | ||
| Layer IV | 4.73 ± 0.87 | 3.24 ± 0.77*** | 4.38 ± 0.67 | 3.87 ± 0.96 | 4.35 ± 1.07# | ||
| Pyriform cortex | 2.47 ± 0.62 | 2.65 ± 0.68 | 2.33 ± 0.87 | 2.64 ± 0.27 | 2.87 ± 0.73 | ||
| Anterior cingulate cortex | 4.58 ± 0.80 | 3.10 ± 0.53*** | 4.11 ± 0.57 | 4.08 ± 0.70 | 4.10 ± 1.24# | ||
| Motor cortex | |||||||
| Layer I | 3.29 ± 0.46 | 2.82 ± 0.32 | 3.33 ± 0.45 | 3.05 ± 0.50 | 3.51 ± 0.96 | ||
| Layer II – III | 3.55 ± 0.29 | 2.98 ± 0.54 | 3.50 ± 0.48 | 3.21 ± 0.59 | 3.78 ± 0.73 | ||
| Layer IV | 4.19 ± 0.65 | 3.29 ± 0.18 | 4.12 ± 0.34 | 3.87 ± 0.51 | 3.96 ± 1.07 | ||
| Layer V | 3.26 ± 0.40 | 2.43 ± 0.42** | 2.91 ± 0.38 | 2.88 ± 0.50 | 3.17 ± 0.75## | ||
| Layer VI | 2.87 ± 0.39 | 2.40 ± 0.40 | 2.60 ± 0.42 | 2.71 ± 0.50 | 2.99 ± 0.91 | ||
| Somatosensory cortex | |||||||
| Layer I | 3.72 ± 0.52 | 2.99 ± 0.52 | 3.35 ± 0.47 | 3.21 ± 0.62 | 3.65 ± 0.81 | ||
| Layer II–III | 3.94 ± 0.34 | 3.05 ± 0.68** | 3.71 ± 0.52 | 3.51 ± 0.58 | 3.94 ± 0.62## | ||
| Layer IV | 4.49 ± 0.87 | 3.14 ± 0.70** | 4.28 ± 0.55 | 4.02 ± 0.55 | 4.13 ± 1.03# | ||
| Layer V | 3.72 ± 0.53 | 2.78 ± 0.39** | 3.52 ± 0.46 | 3.52 ± 0.60 | 3.83 ± 0.95## | ||
| Layer VI | 3.59 ± 0.71 | 2.92 ± 0.45 | 3.32 ± 0.36 | 3.24 ± 0.66 | 3.76 ± 0.79 | ||
| Auditory cortex | |||||||
| Layer I | 4.64 ± 1.14 | 3.21 ± 0.48*** | 3.78 ± 0.62 | 3.80 ± 0.74 | 4.17 ± 0.62# | ||
| Layer IV | 4.55 ± 1.07 | 3.85 ± 0.73 | 4.21 ± 0.79 | 4.21 ± 1.22 | 4.15 ± 1.47 | ||
| Layer VI | 3.98 ± 0.80 | 3.10 ± 0.66 | 3.38 ± 0.71 | 3.21 ± 0.83 | 3.67 ± 1.28 | ||
| Visual cortex | |||||||
| Layer I | 3.78 ± 0.88 | 2.84 ± 0.47 | 3.21 ± 0.63 | 3.17 ± 0.75 | 3.53 ± 0.98 | ||
| Layer IV | 4.35 ± 0.98 | 3.27 ± 0.85 | 3.64 ± 0.72 | 3.78 ± 1.15 | 3.93 ± 0.94 | ||
| Layer VI | 3.92 ± 0.81 | 2.60 ± 0.58 | 3.16 ± 0.66 | 3.36 ± 0.90 | 3.64 ± 0.97 | ||
| Preoptic area (LPO/MPO) | 2.48 ± 0.50 | 2.48 ± 0.72 | 2.02 ± 0.79 | 2.64 ± 0.30 | 2.91 ± 0.53 | ||
| Suprachiasmatic nu | 2.40 ± 0.71 | 2.51 ± 0.75 | 2.09 ± 0.72 | 2.72 ± 0.40 | 2.90 ± 0.54 | ||
| Globus pallidus | 2.48 ± 0.40 | 2.49 ± 0.73 | 2.26 ± 0.76 | 2.86 ± 0.27 | 2.94 ± 0.46 | ||
| Bed nu stria terminalis | 2.97 ± 0.40 | 2.62 ± 0.70 | 2.66 ± 0.54 | 2.93 ± 0.34 | 3.28 ± 0.48 | ||
| Olfactory tubercle | 4.01 ± 0.76 | 2.96 ± 0.29*** | 3.52 ± 0.27 | 3.50 ± 0.41 | 3.57 ± 0.64## | ||
| Diagonal band Dorsal | 3.19 ± 0.63 | 2.89 ± 0.50 | 3.04 ± 0.63 | 3.02 ± 0.50 | 3.42 ± 0.87 | ||
| Ventral | 3.42 ± 0.53 | 2.77 ± 0.54 | 2.74 ± 0.63 | 3.05 ± 0.73 | 3.26 ± 0.93 | ||
| Amygdala basolat/med | 3.42 ± 0.52 | 2.79 ± 0.39 | 2.98 ± 0.73 | 2.89 ± 0.56 | 2.94 ± 0.79 | ||
| Hippocampus | CA1 | 3.02 ± 0.46 | 2.67 ± 0.47 | 2.41 ± 0.55 | 2.31 ± 0.64 | 2.67 ± 0.67 | |
| CA2 | 3.38 ± 0.67 | 2.74 ± 0.45 | 2.50 ± 0.42 | 2.41 ± 0.65 | 2.83 ± 0.74 | ||
| CA3 | 3.12 ± 0.35 | 2.80 ± 0.44 | 2.62 ± 0.56 | 2.51 ± 0.66 | 2.82 ± 0.69 | ||
| Dentate gyrus | 3.35 ± 0.43 | 2.83 ± 0.41 | 2.88 ± 0.75 | 3.00 ± 0.44 | 3.32 ± 0.77 | ||
| Accumbens nucleus | 3.91 ± 0.95 | 3.05 ± 0.39 | 3.37 ± 0.76 | 3.36 ± 0.72 | 3.57 ± 0.90 | ||
| Caudate putamen | |||||||
| Dorsal | 3.77 ± 0.55 | 2.88 ± 0.54 | 3.18 ± 0.47 | 3.42 ± 0.52 | 3.51 ± 0.90 | ||
| Ventral | 3.73 ± 0.55 | 2.93 ± 0.54 | 3.07 ± 0.44 | 3.26 ± 0.63 | 3.56 ± 0.84 | ||
| Lateral | 3.85 ± 0.58 | 2.90 ± 0.55** | 3.09 ± 0.34 | 3.40 ± 0.49 | 3.71 ± 0.79# | ||
| Medial | 3.71 ± 0.51 | 2.82 ± 0.52** | 3.14 ± 0.41 | 3.31 ± 0.52 | 3.69 ± 0.82# | ||
| Septal nucleus lateral | 2.95 ± 0.44 | 2.71 ± 0.61 | 2.48 ± 0.53 | 2.83 ± 0.36 | 2.85 ± 0.78 | ||
| medial | 4.08 ± 1.09 | 2.91 ± 0.52* | 3.50 ± 0.47 | 3.69 ± 0.65 | 4.47 ± 1.00# | ||
| Diencephalon | |||||||
| Habenular nu lateral | 5.05 ± 1.19 | 3.09 ± 0.64*** | 4.14 ± 1.24 | 4.26 ± 0.61 | 4.89 ± 1.27### | ||
| medial | 5.05 ± 0.90 | 3.29 ± 0.74*** | 4.16 ± 0.82 | 4.15 ± 0.69 | 4.57 ± 1.28### | ||
| Dorsal lateral geniculate nu | |||||||
| 4.67 ± 0.93 | 3.08 ± 0.64** | 3.65 ± 0.71 | 3.70 ± 0.78 | 4.21 ± 1.29# | |||
| Medial Geniculate nu | 4.03 ± 0.70 | 3.48 ± 0.87 | 3.94 ± 0.50 | 4.21 ± 1.14 | 4.38 ± 1.29 | ||
| Thalamus | |||||||
| Ventroposterior nu lat | 4.32 ± 0.80 | 3.35 ± 0.88 | 3.37 ± 0.73 | 3.68 ± 1.04 | 4.03 ± 1.08 | ||
| Ventroposterior nu med | 4.07 ± 0.71 | 3.55 ± 0.95 | 3.27 ± 0.69 | 3.66 ± 0.97 | 4.18 ± 0.86 | ||
| Paratenial nu | 3.47 ± 0.46 | 2.78 ± 0.53 | 2.96 ± 0.45 | 3.14 ± 0.51 | 3.45 ± 0.81 | ||
| Anteroventral nu | 5.38 ± 0.76 | 3.24 ± 0.77*** | 4.86 ± 0.91 | 4.82 ± 0.81 | 5.01 ± 1.69## | ||
| Anteromedial nu | 3.82 ± 0.51 | 2.91 ± 0.64* | 3.48 ± 0.63 | 4.03 ± 0.62 | 4.29 ± 0.72### | ||
| Reticular nu | 4.19 ± 0.74 | 3.07 ± 0.62** | 3.56 ± 0.45 | 3.56 ± 0.51 | 4.28 ± 1.02## | ||
| Paraventricular nu | 3.44 ± 0.56 | 2.82 ± 0.50 | 2.86 ± 0.44 | 3.21 ± 0.43 | 3.46 ± 0.90 | ||
| Parafascicular nu | 4.52 ± 0.87 | 2.74 ± 0.62*** | 3.84 ± 0.74 | 3.72 ± 0.98 | 3.80 ± 0.78# | ||
| Subthalamic nucleus | 4.80 ± 0.93 | 3.10 ± 0.70 | 3.70 ± 0.70 | 3.87 ± 0.96 | 3.99 ± 0.95 | ||
| Hypothalamus | |||||||
| Supraoptic nu | 3.28 ± 0.39 | 2.87 ± 0.57** | 2.66 ± 0.67 | 3.14 ± 0.51 | 3.83 ± 1.00### | ||
| Lateral | 2.87 ± 0.48 | 2.82 ± 1.16 | 2.29 ± 0.61 | 2.80 ± 0.38 | 2.80 ± 0.38 | ||
| Anterior | 2.41 ± 0.43 | 2.58 ± 0.60 | 2.17 ± 0.70 | 2.76 ± 0.25 | 2.87 ± 0.67 | ||
| Periventricular | 2.07 ± 0.44 | 2.17 ± 0.54 | 1.83 ± 0.59 | 2.29 ± 0.23 | 2.39 ± 0.56 | ||
| Arcuate | 2.74 ± 0.39 | 2.60 ± 0.61 | 2.25 ± 0.70 | 2.75 ± 0.50 | 2.86 ± 0.73 | ||
| Ventromedial | 2.83 ± 0.29 | 2.64 ± 0.68 | 2.34 ± 0.70 | 2.74 ± 0.41 | 2.88 ± 0.73 | ||
| Posterior | 4.11 ± 0.54 | 3.04 ± 0.34*** | 3.82 ± 0.39 | 3.77 ± 0.33 | 3.77 ± 0.43## | ||
| Mammillary nucleus | 3.93 ± 0.75 | 3.15 ± 0.88 | 3.31 ± 0.96 | 3.05 ± 0.66 | 3.53 ± 1.12 | ||
| Mesencephalon | |||||||
| Interpeduncular nucleus | 6.61 ± 1.15 | 3.65 ± 1.18*** | 5.43 ± 1.24 | 5.54 ± 1.34 | 5.70 ± 2.27# | ||
| Substantia nigra | 3.78 ± 0.91 | 2.77 ± 0.33*** | 2.73 ± 0.53 | 3.07 ± 0.86 | 3.55 ± 0.50## | ||
| Pretectal area | 4.44 ± 1.19 | 3.19 ± 0.74 | 3.59 ± 0.59 | 3.67 ± 0.86 | 4.08 ± 1.15 | ||
| Superior colliculus | 3.97 ± 0.81 | 3.17 ± 0.62 | 3.71 ± 0.67 | 3.63 ± 1.08 | 4.10 ± 1.09 | ||
| Deep layers | 4.01 ± 0.58 | 2.98 ± 0.63 | 3.76 ± 0.79 | 3.66 ± 0.96 | 4.10 ± 0.98 | ||
| Inferior colliculus | 6.40 ± 1.59 | 4.25 ± 1.09 | 5.55 ± 1.23 | 5.34 ± 1.16 | 5.70 ± 1.79 | ||
| Rhombencephalon | |||||||
| Flocculus | 4.72 ± 0.88 | 3.23 ± 0.84 | 4.01 ± 0.77 | 3.94 ± 1.05 | 4.46 ± 1.42 | ||
| Cerebellar gray matter | 4.13 ± 0.67 | 2.88 ± 0.79*** | 3.91 ± 0.76 | 4.17 ± 1.09 | 4.26 ± 1.05## | ||
| Molecular layer cerebellar | 5.00 ± 0.64 | 3.96 ± 1.21 | 4.74 ± 0.80 | 5.20 ± 0.89 | 5.31 ± 1.17 | ||
| gray matter | |||||||
| White matter | |||||||
| Corpus callosum | 2.19 ± 0.63 | 2.25 ± 0.39 | 2.15 ± 0.67 | 2.12 ± 0.63 | 2.28 ± 0.38 | ||
| Zona incerta | 2.63 ± 0.68 | 2.69 ± 0.59 | 2.41 ± 0.41 | 2.24 ± 0.66 | 2.67 ± 0.25 | ||
| Internal capsule | 2.15 ± 0.27 | 2.99 ± 0.61 | 2.01 ± 0.33 | 2.01 ± 0.69 | 2.09 ± 0.33 | ||
| Cerebellar white matter | 2.57 ± 0.36 | 2.34 ± 0.55 | 2.41 ± 0.69 | 3.01 ± 0.91 | 2.82 ± 0.65 | ||
| Non-blood-brain barrier regions | |||||||
| Subfornical organ | 3.30 ± 1.15 | 2.74 ± 0.58 | 2.81 ± 0.75 | 2.78 ± 0.47 | 2.42 ± 0.69 | ||
| Median eminence | 3.38 ± 0.87 | 3.55 ± 0.75 | 3.04 ± 1.09 | 2.75 ± 0.34 | 2.56 ± 0.67 | ||
Abbreviations: nu, nucleus; lat, lateral; med, medial
k* = (ml/s/g) × 10−4
nicotine administration: 0.1 mg/kg s.c.
mecamylamine administration: 1.0 mg/kg s.c., 17 min before nicotine
mecamylamine plus nicotine administration: 1.0 mg/kg s.c., 15 min following by nicotine 0.1 mg/kg, s.c. 2 min
Each value is a mean ± S.D. (n = 10)
For the statistic analysis, all treatments were compared to saline and mecamylamine + nicotine 2 min was compared to nicotine 2 min.
p < 0.05
p < 0.01
p < 0.001 versus saline
p < 0.05
p < 0.01
p < 0.001 versus nicotine 2 min
Mecamylamine given alone had no effect on k*. When administered 15 min prior to nicotine, it completely blocked the effects of nicotine at 2 min (Table 2). Patterns of changes in k* due to nicotine and mecamylamine is illustrated in Figure 2.
Figure 2. Difference patterns of k* responses to nicotine and mecamylamine in sagittal representation of rat brain.

Regions in which k* was decreased significantly are hatched. List of regions: A, amygdala; Acc, nucleus accumbens; Aud, auditory cortex; am, anteromedial thalamic nucleus; av, anteroventral thalamic nucleus; CbG, cerebellar gray matter; CBW, cerebellar white matter; CPu, caudate putamen; DLG, dorsal lateral geniculate nucleus; Fr, frontal cortex; GP, globus pallidus; HB, habenular complex; HIP, hippocampus; HYP, hypothalamus; IC, inferior colliculus; IPC, interpeduncular nucleus; MM, mammillary nucleus; mG, medial geniculate nucleus; OT, olfactory tubercle; PF, prefrontal cortex; pf, parafascicular thalamic nucleus; SN, substantia nigra; S, septum; Som, somatosensory cortex; SCp, deep layer of superior colliculus; SCs, superficial layer of superior colliculus; STH, subthalamic nucleus; THa, thalamus; Vis, visual cortex.
Prostaglandin E2 concentration
Nicotine compared to saline did not significantly modify the net brain PGE2 concentration (20.0 ± 3.1 vs. 18.7 ± 3.6 ng/g, n = 4, p > 0.05).
Discussion
Nicotine (0.1 mg/kg s.c.) significantly decreased k* for AA at 2 min postinjection in 26 of 80 brain regions, by −45% to −13%, but not at 10 min postinjection. The decreases at 2 min were mediated by nAChRs, since pretreatment with the nonspecific nAChR antagonist, mecamylamine, prevented them. Nicotine decreased heart rate, whereas mecamylamine given prior to nicotine blocked the change. The negative effect of nicotine on heart rate, reported previously (London et al 1988a), has been ascribed to nicotine-induced catecholamine release from central and peripheral sources (Gozzi et al 2006). The mecamylamine effects on blood pressure and heart rate are consistent with previous reports (Gozzi et al 2006).
These data support our hypotheses that nicotine would alter k* for AA and that its effect would be transient, consistent with reported receptor desensitization in in vitro studies. The decrements in k* caused by nicotine at 2 min generally occurred at [3H]nicotine-binding sites (London et al 1985). The habenula nuclei, interpeduncular nucleus, thalamic nuclei and dorsal lateral geniculate nucleus, which had significantly reduced values of k* (by −35% to −39%), have high binding capacities for [125I]epibatidine (3.2–5.7 fmol/mg). This agonist has a high affinity for α4β2 nAChRs and for nAChRs containing the α3 but not the α7 subtype (Perry et al 2002). Reductions in k* (by −20% to −30%) also were observed in the frontal, somatosensory and anterior cingulate cortex, substantia nigra, caudate putamen and cerebellum having lower [125I]epibatidine-binding capacities (1.1–2.0 fmol/mg) (Perry et al 2002). In contrast, k* was not significantly affected by nicotine in the hippocampus, which has almost no [3H]nicotine-binding sites (London et al 1985), very low [125I]epibatidine-binding capacity (0.5–0.8 fmol/mg) (Perry et al 2002) and contains mostly the α7 receptor subtype (Gotti et al 2006). Thus, these data and evidence that α4β2 nAChRs are reported to undergo desensitization within 10–15 min in vitro (Alkondon et al 2000; Dajas-Bailador and Wonnacott 2004; Quick and Lester 2002) and that α7 nAChRs become desensitized within milliseconds in hippocampal neuron cultures (Dajas-Bailador and Wonnacott 2004; Quick and Lester 2002) suggest that nicotine’s 2-min effect on the AA signal was largely mediated by α4β2 and α3 subtypes. Significant reductions in k* for AA at 2 min following nicotine also were evident in auditory (medial habenula nucleus and auditory cortex layer I) and visual (lateral habenula nucleus and dorsal lateral geniculate nucleus) circuits. The parafascicular thalamic nucleus, where a reduction also occurred, can participate in visual oculomotor circuits (Van der Werf et al 2002). All these regions belong to the cholinergic system (Woolf 1991). Indeed, the cortex, interpeduncular, thalamus and caudate-putamen are innervated by the pontomesencephalic and/or basal forebrain cholinergic cells.
Nicotine concentrations peak in rat plasma and brain 10 min after s.c. nicotine, and then fall with half-lives of 20 and 50 min, respectively (Ghosheh et al 1999). Thus, although brain nicotine concentrations were higher at 10 than at 2 min, significant reductions in k* for AA were only observed at 2 min, consistent with rapid nAChR desensitization (Alkondon et al 2000; London et al 1988a; London et al 1988b; Quick and Lester 2002). Metabolites of nicotine (cotinine, nornicotine, and norcotinine) likely did not play a role at 2 min since they appear in rat brain only 30 min following s.c. nicotine (Ghosheh et al 1999).
Thus, the data are consistent with the responses in k* for AA to nicotine at 2 min being mediated by activation of α4β2 and α3β4 receptor subtypes, since α7 receptors are very rapidly desensitized (Quick and Lester 2002). Desensitization of nAChRs has been demonstrated in hippocampal and whole-brain slices in vitro, so that this report is the first demonstration on neuroimaging of receptor desensitization in brain in vivo. Pretreatment with selective high-affinity agonists might help to identify the exact subtype of nAChRs involved in desensitization (Gozzi et al 2006). The consequences of nAChR desensitization are multiple, and include homologous upregulation of nAChRs, hypersensitization of muscarinic receptors, modulation of gene expression for ion channels, receptors and signaling systems, learning and memory, and neuroprotection (Wang and Sun 2005).
The basis of the reductions in k* for AA at 2 min following nicotine is not immediately evident insofar as agonist stimulation of cPLA2-coupled postsynaptic D2-like, M1,3,5, 5-HT2A/2C and NMDA receptors increased k* for AA in unanesthetized rats (Basselin et al 2006a; Basselin et al 2006b; Bhattacharjee et al 2005; Qu et al 2003). Nicotine can provoke Ca2+ entry into the cell via nAChRs and voltage-gated Ca2+ channels, and also can trigger Ca2+ release from intracellular stores (Dajas-Bailador and Wonnacott 2004). However, since nAChRs are largely presynaptic (see Introduction), it is unlikely that this release activated Ca2+-dependent AA-selective cPLA2, which is localized mainly at postsynaptic excitatory sites in rat brain (Ong et al 1999). The reductions in k* at 2 min were not likely due to cPLA2 inhibition by nicotine, although nicotine (10 µM to 1 mM) has been reported to inhibit neuronal, cytosolic and membrane-bound PLA2 activities in vitro (Marin et al 1997), since the brain nicotine concentration increased between 2 and 10 min (Ghosheh et al 1999), when significant k* changes were absent.
Although nicotine decreased regional k* values in 26 of 80 brain regions at 2 min, it did not reduce the net brain concentration of PGE2. This may have reflected its transient effect on k* for AA, as studies in which AA turnover was chronically reduced showed reductions in cPLA2 activity as well as PGE2 concentrations (Lee et al 2007).
There are several possible causes for the reductions in k* for AA at 2 min following nicotine, and these might be explored with appropriate antagonist pretreatment in future studies. One is that acute nicotine stimulated GABAergic inhibition of neuronal activity (Contreras et al 1999). Indeed, submicromolar concentrations of nicotine, in addition to activating nAChRs, enhanced the frequency and amplitude of GABAergic postsynaptic currents in interneurons of rat hippocampal and striatal slices (Alkondon et al 2000). Another is that acute nicotine reduced glutamatergic signaling involving AA. Nicotine has been reported to reduce presynaptic glutamate release (Levy et al 2006; Stapleton et al 2003), which would be expected to reduce baseline values of k* for AA by decreasing postsynaptic NMDA receptor-mediated Ca2+ entry into cells and thereby reduce cPLA2 activation (Basselin et al 2006a).
Although most nAChRs are presynaptic, some are found at postsynaptic sites in the brain (Dajas-Bailador and Wonnacott 2004; Gotti et al 2006). However, postsynaptic α4β2 nAChRs are unlikely to have been involved in nicotine’s acute effect on k*, since they have a low Ca2+ permeability compared to NMDA receptors (Rogers and Dani 1995) and do not increase intracellular Ca2+ levels sufficiently to activate cPLA2, which requires 300 nM to 1 µM (Clark et al 1995; Dajas-Bailador and Wonnacott 2004).
The estimated brain nicotine concentration following 0.1 mg/kg s.c. nicotine injection in rats is ~150 ng/g (Ghosheh et al 1999). For comparison, in humans who smoke a single cigarette, the brain nicotine concentration reaches 20–70 ng/ml and results in 90% occupancy of α4β2 receptors for several hours (Brody et al 2006). Thus, we would expect that k* for AA in the brain would be transiently reduced in humans who smoke just one cigarette. This prediction could be tested directly with positron emission tomography (PET) and [1-11C]AA, following the two-measurement paradigm (2 min and 10 min) employed in the rat study (Esposito et al 2007).
The acute reduction in the AA signal by nicotine may have a neuroprotective action. N-methyl-D-aspartate administration increases k* for AA in rat brain (Basselin et al 2006a; Lee et al 2008), and acute nicotine has been shown to reduce N-methyl-D-aspartate-induced excitotoxic damage in hippocampal slices, through its direct activation of α4β2 receptors or indirectly after inhibiting α7 subtype receptors (Ferchmin et al 2003).
In vivo imaging following the intravenous injection of radiolabeled 2-deoxy-D-glucose can be used to measure regional brain glucose consumption over an integrated period of 30– 45 min, and thus would not be expected to pick up the transient reduction in metabolism identified with the pulse-labeling AA method (Sokoloff et al 1977). In this regard, in two studies from the same laboratory in unanesthetized rats (London et al 1988a; London et al 1988b), nicotine (0.1 mg/kg s.c., 2 min) increased glucose utilization significantly in 7 of 21 brain regions in the first, and in 3 of 79 regions in the second, not very different from chance.
A PET study of six drug-naïve human volunteers reported that intravenous 1.5 mg nicotine significantly reduced brain glucose metabolism in 9 of 30 measured bilateral regions, and caused a 9.5% reduction in global glucose metabolism (Stapleton et al 2003). In addition, PET studies using intravenous [15O]water showed that nicotine decreased normalized regional cerebral blood flow in the amygdala in healthy cigarette smokers (Rose et al 2003), and in the left anterior temporal cortex and right amygdala after 12 h of smoking deprivation (Zubieta et al 2001). Our data and these latter studies are consistent in indicating a negative effect of acute nicotine on different aspects of brain activity and metabolism. To our knowledge, the mechanisms for the nicotine-induced reduction of cerebral glucose metabolism and blood flow are not agreed upon.
In summary, nicotine, at a dose that produced a brain nicotine concentration in rats equivalent to that produced by smoking one cigarette in humans, reduced k* for AA in 26 of 80 brain regions examined at 2 min following administration, but did not significantly affect k* for AA at 10 min. Since brain nicotine concentrations are reported to be higher at 10 than 2 min, this difference is consistent with nicotine receptor desensitization, which to date has been reported only in in vitro preparations. The reductions in k* for AA at 2 min could be prevented by pretreatment with the reversible receptor antagonist mecamylamine, and likely reflected nicotine’s modulation of presynaptic neurotransmitter release via nAChRs. Selective antagonists might be used in the future to distinguish which neurotransmitters and which neuroreceptors are involved in the process. Additionally, PET might be employed to see if acute nicotine or smoking has a similar transient effect on AA signaling in the human brain.
Acknowledgements
This research was supported entirely by the Intramural Research Program of the National Institutes of Health, National Institute on Aging. We thank Dr. Angelo O. Rosa for his helpful comments on this paper.
Abbreviations
- AA
arachidonic acid
- cPLA2
Ca2+-dependent cytosolic phospholipase A2
- GABA
γ-aminobutyric acid
- nAChR
nicotinic acetylcholine receptor
- NMDA
N-methyl-D-aspartic acid
- PET
positron emission tomography
- PGE2
prostaglandin E2
Footnotes
Disclosure/Conflict of Interest
None of the authors has a financial or other conflict of interest related to this work.
References
- Alkondon M, Pereira EF, Almeida LE, Randall WR, Albuquerque EX. Nicotine at concentrations found in cigarette smokers activates and desensitizes nicotinic acetylcholine receptors in CA1 interneurons of rat hippocampus. Neuropharmacology. 2000;39:2726–2739. doi: 10.1016/s0028-3908(00)00156-8. [DOI] [PubMed] [Google Scholar]
- Basselin M, Chang L, Bell JM, Rapoport SI. Chronic lithium chloride administration attenuates brain NMDA receptor-initiated signaling via arachidonic acid in unanesthetized rats. Neuropsychopharmacology. 2006a;31:1659–1674. doi: 10.1038/sj.npp.1300920. [DOI] [PubMed] [Google Scholar]
- Basselin M, Villacreses NE, Langenbach R, Ma K, Bell JM, Rapoport SI. Resting and arecoline-stimulated brain metabolism and signaling involving arachidonic acid are altered in the cyclooxygenase-2 knockout mice. J Neurochem. 2006b;96:669–679. doi: 10.1111/j.1471-4159.2005.03612.x. [DOI] [PubMed] [Google Scholar]
- Benjamini Y, Hochberg Y. Controlling the false discovery rate: a practical and powerful approach to multiple testing. J R Statist Soc B. 1995;57:289–300. [Google Scholar]
- Bhattacharjee AK, Chang L, Seeman R, Lee HJ, Bazinet RP. D2 but not D1 dopamine receptor stimulation augments brain signaling involving arachidonic acid in unanesthetized rats. Psychopharmacology (Berl) 2005;180:735–742. doi: 10.1007/s00213-005-2208-4. [DOI] [PubMed] [Google Scholar]
- Brody AL, Mandelkern MA, London ED, Olmstead RE, Farahi J, Scheibal D, Jou J, Allen V, Tiongson E, Chefer SI, Koren AO, Mukhin AG. Cigarette smoking saturates brain α4β2 nicotinic acetylcholine receptors. Arch Gen Psychiatry. 2006;63:907–915. doi: 10.1001/archpsyc.63.8.907. [DOI] [PMC free article] [PubMed] [Google Scholar]
- Clark JD, Schievella AR, Nalefski EA, Lin LL. Cytosolic phospholipase A2. J Lipid Mediat Cell Signal. 1995;12:83–117. doi: 10.1016/0929-7855(95)00012-f. [DOI] [PubMed] [Google Scholar]
- Contreras MA, Chang MC, Kirkby D, Bell JM, Rapoport SI. Reduced palmitate turnover in brain phospholipids of pentobarbital-anesthetized rats. Neurochem Res. 1999;24:833–841. doi: 10.1023/a:1020997728511. [DOI] [PubMed] [Google Scholar]
- Dajas-Bailador F, Wonnacott S. Nicotinic acetylcholine receptors and the regulation of neuronal signalling. Trends Pharmacol Sci. 2004;25:317–324. doi: 10.1016/j.tips.2004.04.006. [DOI] [PubMed] [Google Scholar]
- Esposito G, Giovacchini G, Der M, Liow JS, Bhattacharjee AK, Ma K, Herscovitch P, Channing M, Eckelman WC, Hallett M, Carson RE, Rapoport SI. Imaging signal transduction via arachidonic acid in the human brain during visual stimulation, by means of positron emission tomography. Neuroimage. 2007;34:1342–1351. doi: 10.1016/j.neuroimage.2006.11.018. [DOI] [PMC free article] [PubMed] [Google Scholar]
- Felder CC, Dieter P, Kinsella J, Tamura K, Kanterman RY, Axelrod J. A transfected m5 muscarinic acetylcholine receptor stimulates phospholipase A2 by inducing both calcium influx and activation of protein kinase C. J Pharmacol Exp Ther. 1990a;255:1140–1147. [PubMed] [Google Scholar]
- Felder CC, Kanterman RY, Ma AL, Axelrod J. Serotonin stimulates phospholipase A2 and the release of arachidonic acid in hippocampal neurons by a type 2 serotonin receptor that is independent of inositolphospholipid hydrolysis. Proc Natl Acad Sci USA. 1990b;87:2187–2191. doi: 10.1073/pnas.87.6.2187. [DOI] [PMC free article] [PubMed] [Google Scholar]
- Ferchmin PA, Perez D, Eterovic VA, de Vellis J. Nicotinic receptors differentially regulate N-methyl-D-aspartate damage in acute hippocampal slices. J Pharmacol Exp Ther. 2003;305:1071–1078. doi: 10.1124/jpet.102.048173. [DOI] [PubMed] [Google Scholar]
- Folch J, Lees M, Sloane Stanley GH. A simple method for the isolation and purification of total lipides from animal tissues. J Biol Chem. 1957;226:497–509. [PubMed] [Google Scholar]
- Ghosheh O, Dwoskin LP, Li WK, Crooks PA. Residence times and half-lives of nicotine metabolites in rat brain after acute peripheral administration of [2′-14C]nicotine. Drug Metab Dispos. 1999;27:1448–1455. [PubMed] [Google Scholar]
- Gotti C, Zoli M, Clementi F. Brain nicotinic acetylcholine receptors: native subtypes and their relevance. Trends Pharmacol Sci. 2006;27:482–491. doi: 10.1016/j.tips.2006.07.004. [DOI] [PubMed] [Google Scholar]
- Gozzi A, Schwarz A, Reese T, Bertani S, Crestan V, Bifone A. Region-specific effects of nicotine on brain activity: a pharmacological MRI study in the drug-naive rat. Neuropsychopharmacology. 2006;31:1690–1703. doi: 10.1038/sj.npp.1300955. [DOI] [PubMed] [Google Scholar]
- Henningfield JE, Fant RV. Tobacco use as drug addiction: the scientific foundation. Nicotine Tob Res. 1999;1(Suppl 2):S31–S35. doi: 10.1080/14622299050011781. [DOI] [PubMed] [Google Scholar]
- Lee HJ, Rao JS, Rapoport SI, Bazinet RP. Antimanic therapies target brain arachidonic acid signaling: lessons learned about the regulation of brain fatty acid metabolism. Prostaglandins Leukot Essent Fatty Acids. 2007;77:239–246. doi: 10.1016/j.plefa.2007.10.018. [DOI] [PubMed] [Google Scholar]
- Lee HJ, Rao JS, Chang L, Rapoport SI, Bazinet RP. Chronic N-methyl-D-aspartate administration increases the turnover of arachidonic acid within brain phospholipids of the unanesthetized rat. J Lipid Res. 2008;49:162–168. doi: 10.1194/jlr.M700406-JLR200. [DOI] [PubMed] [Google Scholar]
- Levy RB, Reyes AD, Aoki C. Nicotinic and muscarinic reduction of unitary excitatory postsynaptic potentials in sensory cortex; dual intracellular recording in vitro. J Neurophysiol. 2006;95:2155–2166. doi: 10.1152/jn.00603.2005. [DOI] [PMC free article] [PubMed] [Google Scholar]
- London ED, Waller SB, Wamsley JK. Autoradiographic localization of [3H]nicotine binding sites in the rat brain. Neurosci Lett. 1985;53:179–184. doi: 10.1016/0304-3940(85)90182-x. [DOI] [PubMed] [Google Scholar]
- London ED, Connolly RJ, Szikszay M, Wamsley JK, Dam M. Effects of nicotine on local cerebral glucose utilization in the rat. J Neurosci. 1988a;8:3920–3928. doi: 10.1523/JNEUROSCI.08-10-03920.1988. [DOI] [PMC free article] [PubMed] [Google Scholar]
- London ED, Dam M, Fanelli RJ. Nicotine enhances cerebral glucose utilization in central components of the rat visual system. Brain Res Bull. 1988b;20:381–385. doi: 10.1016/0361-9230(88)90067-6. [DOI] [PubMed] [Google Scholar]
- Marin P, Hamon B, Glowinski J, Prémont J. Nicotine-induced inhibition of neuronal phospholipase A2. J Pharmacol Exp Ther. 1997;280:1277–1283. [PubMed] [Google Scholar]
- Ong WY, Sandhya TL, Horrocks LA, Farooqui AA. Distribution of cytoplasmic phospholipase A2 in the normal rat brain. J Hirnforsch. 1999;39:391–400. [PubMed] [Google Scholar]
- Paxinos G, Watson C. The rat brain in stereotaxic coordinates. Third ed. New York: Academic Press; 1987. [Google Scholar]
- Perry DC, Xiao Y, Nguyen HN, Musachio JL, Davila-Garcia MI, Kellar KJ. Measuring nicotinic receptors with characteristics of α4β2, α3β2 and α3β4 subtypes in rat tissues by autoradiography. J Neurochem. 2002;82:468–481. doi: 10.1046/j.1471-4159.2002.00951.x. [DOI] [PubMed] [Google Scholar]
- Qu Y, Chang L, Klaff J, Balbo A, Rapoport SI. Imaging brain phospholipase A2 activation in awake rat in response to 5-HT2A/2C agonist, (+-)-2,5-dimethoxy-4-iodophenyl-2-aminopropane (DOI) Neuropsychopharmacology. 2003;28:244–252. doi: 10.1038/sj.npp.1300022. [DOI] [PubMed] [Google Scholar]
- Quick MW, Lester RA. Desensitization of neuronal nicotinic receptors. J Neurobiol. 2002;53:457–478. doi: 10.1002/neu.10109. [DOI] [PubMed] [Google Scholar]
- Robinson PJ, Noronha J, DeGeorge JJ, Freed LM, Nariai T, Rapoport SI. A quantitative method for measuring regional in vivo fatty-acid incorporation into and turnover within brain phospholipids: Review and critical analysis. Brain Res Brain Res Rev. 1992;17:187–214. doi: 10.1016/0165-0173(92)90016-f. [DOI] [PubMed] [Google Scholar]
- Rogers M, Dani JA. Comparison of quantitative calcium flux through NMDA, ATP, and ACh receptor channels. Biophys J. 1995;68:501–506. doi: 10.1016/S0006-3495(95)80211-0. [DOI] [PMC free article] [PubMed] [Google Scholar]
- Rose JE, Behm FM, Westman EC, Mathew RJ, London ED, Hawk TC, Turkington TG, Coleman RE. PET studies of the influences of nicotine on neural systems in cigarette smokers. Am J Psychiatry. 2003;160:323–333. doi: 10.1176/appi.ajp.160.2.323. [DOI] [PubMed] [Google Scholar]
- Sokoloff L, Reivich M, Kennedy C, Des Rosiers MH, Patlak CS, Pettigrew KD, Sakurada O, Shinohara M. The [14C]deoxyglucose method for the measurement of local cerebral glucose utilization: Theory, procedure, and normal values in the conscious and anesthetized albino rat. J Neurochem. 1977;28:897–916. doi: 10.1111/j.1471-4159.1977.tb10649.x. [DOI] [PubMed] [Google Scholar]
- Stapleton JM, Gilson SF, Wong DF, Villemagne VL, Dannals RF, Grayson RF, Henningfield JE, London ED. Intravenous nicotine reduces cerebral glucose metabolism: a preliminary study. Neuropsychopharmacology. 2003;28:765–772. doi: 10.1038/sj.npp.1300106. [DOI] [PubMed] [Google Scholar]
- Van der Werf YD, Witter MP, Groenewegen HJ. The intralaminar and midline nuclei of the thalamus. Anatomical and functional evidence for participation in processes of arousal and awareness. Brain Res Brain Res Rev. 2002;39:107–140. doi: 10.1016/s0165-0173(02)00181-9. [DOI] [PubMed] [Google Scholar]
- Vial D, Piomelli D. Dopamine D2 receptors potentiate arachidonate release via activation of cytosolic, arachidonic-specific phospholipase A2. J Neurochem. 1995;64:2765–2772. doi: 10.1046/j.1471-4159.1995.64062765.x. [DOI] [PubMed] [Google Scholar]
- Vijayaraghavan S, Huang B, Blumenthal EM, Berg DK. Arachidonic acid as a possible negative feedback inhibitor of nicotinic acetylcholine receptors on neurons. J Neurosci. 1995;15:3679–3687. doi: 10.1523/JNEUROSCI.15-05-03679.1995. [DOI] [PMC free article] [PubMed] [Google Scholar]
- Wang H, Sun X. Desensitized nicotinic receptors in brain. Brain Res Brain Res Rev. 2005;48:420–437. doi: 10.1016/j.brainresrev.2004.09.003. [DOI] [PubMed] [Google Scholar]
- Weichel O, Hilgert M, Chatterjee SS, Lehr M, Klein J. Bilobalide, a constituent of Ginkgo biloba, inhibits NMDA-induced phospholipase A2 activation and phospholipid breakdown in rat hippocampus. Naunyn Schmiedebergs Arch Pharmacol. 1999;360:609–615. doi: 10.1007/s002109900131. [DOI] [PubMed] [Google Scholar]
- Woolf NJ. Cholinergic systems in mammalian brain and spinal cord. Prog Neurobiol. 1991;37:475–524. doi: 10.1016/0301-0082(91)90006-m. [DOI] [PubMed] [Google Scholar]
- Zubieta J, Lombardi U, Minoshima S, Guthrie S, Ni L, Ohl LE, Koeppe RA, Domino EF. Regional cerebral blood flow effects of nicotine in overnight abstinent smokers. Biol Psychiatry. 2001;49:906–913. doi: 10.1016/s0006-3223(00)01070-2. [DOI] [PubMed] [Google Scholar]