

Abstract
Background
Reported incidences of anaphylaxis range from 3.2 to 20 per 100,000 population. The incidence and trend over time has meaningful public health implications but has not been well characterized because of a lack of a standard definition and deficiencies in reporting of events.
Objective
We sought to determine the incidence and cause of anaphylaxis over a 10-year period.
Methods
We performed a population-based incidence study that was conducted in Rochester, Minnesota, from 1990 through 2000. Anaphylaxis episodes were identified on the basis of symptoms and signs of mast cell and basophil mediator release plus mucocutaneous, gastrointestinal tract, respiratory tract, or cardiovascular system involvement.
Results
Two hundred eleven cases of anaphylaxis were identified (55.9% in female subjects). The mean age was 29.3 years (SD, 18.2 years; range, 0.8–78.2 years). The overall age-and sex-adjusted incidence rate was 49.8 (95% CI, 45.0–54.5) per 100,000 person-years. Age-specific rates were highest for ages 0 to 19 years (70 per 100,000 person-years). Ingested foods accounted for 33.2% (70 cases), insect stings accounted for 18.5% (39 cases), medication accounted for 13.7% (29 cases), radiologic contrast agent accounted for 0.5% (1 case), “other” causes accounted for 9% (19 cases), and “unknown” causes accounted for 25.1% (53 cases). The “other” group included cats, latex, cleaning agents, environmental allergens, and exercise. There was an increase in the annual incidence rate during the study period from 46.9 per 100,000 persons in 1990 to 58.9 per 100,000 persons in 2000 (P = .03).
Conclusion
The overall incidence rate is 49.8 per 100,000 person-years, which is higher than previously reported. The annual incidence rate is also increasing. Food and insect stings continue to be major inciting agents for anaphylaxis.
Keywords: Cause, incidence, anaphylaxis
First described more than 100 years ago, anaphylaxis has been characterized as a serious allergic reaction that is rapid in onset and can cause death.1 Estimates of the incidence of anaphylaxis vary because of the lack of a standard definition, leading to deficiencies in reporting of events.1,2 The traditional views of criteria for diagnosis were narrow, often limited only to those in shock. As a result, many cases of anaphylaxis were commonly coded as an allergic reaction. The few studies available have reported incidence rates ranging from 3.2 to 20 cases per 100,000 person-years.3–5 Epidemiologic studies of related conditions, including food allergies and asthma, have shown a concerning increase in incidence over time.6,7 The incidence of anaphylaxis and trends over time have important public health implications but have not been well characterized.
The present study was undertaken to rigorously determine the incidence and cause of anaphylaxis in a population-based cohort over a 10-year period.
METHODS
Study design, setting, and patients
This retrospective cohort study was performed by identifying cases of anaphylaxis occurring in individuals residing in Rochester, Minnesota, between 1990 and 2000. This population-based study made use of the resources of the Rochester Epidemiology Project, which links and indexes the records of virtually all providers of medical care in Olmsted County, Minnesota.8,9 All patient diagnoses have been coded with either the Hospital Adaptation of the International Classification of Diseases, Second Edition, codes or the International Classification of Diseases, Ninth Revision, codes. These codes are indexed for computerized retrieval. Using this retrieval system, we searched for all patients who had a new diagnostic code related to anaphylaxis from 1990 through 2000; who were residents of Rochester, Minnesota; and who had given permission for their medical records to be used for research. Specifically, all 248 patients with codes representing the following diagnoses were reviewed: anaphylactic shock; anaphylactic shock caused by food; anaphylactic shock not elsewhere classified; and anaphylactic shock after sting. In addition, a random sample of 600 patients (from 2442 potential cases) with the following diagnoses were also reviewed: 300 patients given a diagnosis of either venom, bee sting, or toxic effect of venom and 300 patients given a diagnosis of either allergy, foodstuff; adverse effect, food; dermatitis caused by food taken internally; or toxic effect of specific food. The 2442 patients were sorted by using a random-number generator, and another random number was generated to obtain each sample of 300. All medical records for each identified patient were retrieved and reviewed to confirm cases of anaphylaxis. Patients who met the criteria for a diagnosis of anaphylaxis (see definition below) were included in the study. The study was approved by the Mayo Foundation and Olmsted Medical Center institutional review boards.
Defining a case of anaphylaxis
An episode of anaphylaxis was identified on the basis of symptoms and signs of generalized mast cell and basophil mediator release, including mucocutaneous, oral, and gastrointestinal tract; respiratory tract; or cardiovascular system involvement, as defined below. To classify an event as anaphylaxis, we required at least 1 symptom of generalized mediator release, such as flushing; pruritus or tingling of the lips, axilla, hand, or feet; general pruritus; urticaria or angioedema; lip tingling; and conjunctivitis or chemosis. In addition to 1 symptom of generalized mediator release, we required at least 1 of the following additional symptoms to be present during the event involving the gastrointestinal tract, respiratory tract, or cardiovascular system, as discussed below:
Gastrointestinal tract: oral mucosal pruritus; intraoral angioedema of buccal mucosa, tongue, palate, or oropharynx; nausea, emesis, dysphagia, abdominal cramps, or diarrhea.
Respiratory tract: rhinitis, stridor, cough, hoarseness, aphonia, tightness in the throat, dyspnea, wheezing, hypopharyngeal or laryngeal edema, cyanosis.
Cardiovascular system: chest pain, arrhythmia, hypotension, presyncope, syncope, tachycardia, bradycardia, orthostasis, seizures, and shock.
Two exceptions to these criteria also classified an event as anaphylaxis: isolated laryngeal edema or immediate shock and syncopal event after injection of medication or a radiocontrast agent.
Data collection
Records were screened to determine whether the date and assigned code met the inclusion criteria. Patients were excluded if they were not residents of the defined geographic area or refused to give permission for their medical records to be used for research. Nurse abstractors fully reviewed the complete inpatient and outpatient medical records of each subject to confirm each episode of anaphylaxis, treatment, and outcome of the anaphylactic episode. Demographic data, presenting symptoms, inciting allergens, and episode outcomes were also abstracted.
There were 2 abstractors over the course of the study. Abstractor 1 conducted a pilot study of 22 charts to test the criteria for defining a case of anaphylaxis, to determine the amount of time needed to collect each data point, and to finalize the data collection forms. Abstractor 2 joined the study 2 months after abstractor 1 and reviewed 10 charts that had been reviewed previously by abstractor 1. Time needed to review the charts was approximately the same for both abstractors, and data comparability was excellent (>95%). Abstractors and investigators met monthly to discuss progress and to resolve abstracting or coding questions. Investigators reviewed charts in which collection of data points was unclear and were also available on an ad hoc basis to resolve questions.
Of the group of 248 potential cases including an “anaphylaxis” diagnostic coder, 157 (63.3%) met the criteria for anaphylaxis. Of the randomly chosen 600 cases with less specific “allergy” diagnostic codes, 54 (9%) met the criteria for anaphylaxis. Therefore a total of 211 cases of anaphylaxis were confirmed and included in this study. All data were abstracted by professional nurse abstractors using a standardized abstraction form.
RESULTS
There were 211 cases of anaphylaxis identified. Of these patients, 118 (55.9%) were female. The mean age was 29.3 years (SD, 18.2 years; range, 0.8–78.2 years). Table I summarizes the demographic characteristics of the group. Table II shows the distribution of allergy-related past medical history. There was no past history of allergic conditions in 41.2% (87 cases). Among the coexisting atopic conditions, asthma was the most common.
TABLE I.
Demographic characteristics of the group
| Variable | Value (n = 211) |
|---|---|
| Female sex | 118 (55.9%) |
| Age (y) | |
| Mean (SD) | 29.3 (18.2) |
| Range | 0.8–78.2 |
| Race | |
| White | 178 (84.4%) |
| Hispanic | 1 (0.5%) |
| Black | 6 (2.8%) |
| Asian/Pacific Islander | 7 (3.3%) |
| Other | 1 (0.5%) |
| Unknown | 18 (8.5%) |
TABLE II.
Past medical history of other allergy problems
| Past medical history | No. (%),* n = 211 |
|---|---|
| None | 87 (41.2) |
| Asthma | 64 (30.3) |
| Allergic rhinitis | 60 (28.4) |
| Atopic dermatitis | 37 (17.5) |
| Hives | 11 (5.2) |
| Other | 12 (5.7) |
The percentages exceed 100% because 60 patients had more than 1 condition.
Table III shows the cause, with ingested foods accounting for 33.2% (70 cases), insect sting accounting for 18.5% (39 cases), medication accounting for 13.7% (29 cases), radiologic contrast agent accounting for 0.5% (1 case), and “other” accounting for 9% (19 cases). The “other” inciting agents included cats, latex, cleaning agents, environmental allergens, and exercise. The inciting factor was determined on a case-to-case basis after taking history, skin test results, in vitro test results, and challenge test results into consideration.
TABLE III.
Inciting agent
| 1990–1993 |
1994–1997 |
1998–2000 |
1990–2000 |
|
|---|---|---|---|---|
| Variable | No. (%), n = 60 | No. (%), n = 89 | No. (%), n = 62 | No. (%), n = 211 |
| Inciting allergen | ||||
| Food | 23 (38.3) | 26 (29.2) | 21 (33.9) | 70 (33.2) |
| Insect sting | 7 (11.7) | 21 (23.6) | 11 (17.7) | 39 (18.5) |
| Medication | 7 (11.7) | 12 (13.5) | 10 (16.1) | 29 (13.7) |
| Contrast agent | 0 | 0 | 1 (1.6) | 1 (0.5) |
| Other | 5 (8.3) | 8 (9.0) | 6 (9.7) | 19 (9.0) |
| Barium | 0 | 0 | 1 | 1 |
| Bee or erythromycin | 0 | 0 | 1 | 1 |
| Cats | 0 | 0 | 2 | 2 |
| Cleaning agents | 0 | 1 | 0 | 1 |
| Easter lily | 1 | 0 | 0 | 1 |
| Food and exercise | 1 | 4 | 0 | 5 |
| Glue | 0 | 1 | 0 | 1 |
| Latex | 0 | 0 | 1 | 1 |
| Moldy seeds | 1 | 0 | 0 | 1 |
| Not recorded | 1 | 1 | 0 | 2 |
| Perfume | 0 | 1 | 0 | 1 |
| Picking flowers outside | 0 | 0 | 1 | 1 |
| Starch compound/Sta-Flo* | 1 | 0 | 0 | 1 |
| Unknown | 18 (30.0) | 22 (24.7) | 13 (21.0) | 53 (25.1) |
| Allergy testing done | 3 | 9 | 8 | 20 |
| No allergy tests done | 15 | 12 | 5 | 32 |
| Allergy test done, results unknown | 0 | 1 | 0 | 1 |
Dial Corporation, Scottsdale, Ariz.
After skin prick and RAST tests, the cause could not be identified in 15.2% (32 cases). We could also not find a cause in 9.5% (20 cases) in which allergy testing was not done and in 1 case in which allergy tests were done but in which the results were unknown.
The peak incidence of anaphylaxis occurred in July through September. Insect stings were the most common cause of anaphylaxis during this period.
A detailed listing of all symptoms is provided in Table IV, with the majority showing mucocutaneous and respiratory symptoms, followed by cardiovascular and gastrointestinal symptoms.
TABLE IV.
Signs and symptoms on presentation (n = 211)
| Factor | No. (%) |
|---|---|
| General symptoms | |
| Diffuse urticaria | 108 (51.2) |
| Local angioedema | 103 (48.8) |
| Oral pruritus | 3 (1.4) |
| Pruritus | 102 (48.3) |
| Flushing | 81 (38.4) |
| Local urticaria | 36 (17.1) |
| Conjunctivitis | 23 (10.9) |
| Oropharyngeal or hypopharyngeal edema | 23 (10.9) |
| Intraoral angioedema | 33 (15.6) |
| Diffuse angioedema | 13 (6.2) |
| Diaphoresis | 14 (6.6) |
| Chemosis/edema ocular conjunctiva | 3 (1.4) |
| Gastrointestinal tract symptoms | |
| Emesis | 38 (18.0) |
| Nausea | 35 (16.6) |
| Dysphagia | 25 (11.9) |
| Abdominal cramping | 17 (8.1) |
| Diarrhea | 14 (6.6) |
| Cardiovascular system symptoms | |
| Tachycardia | 75 (35.6) |
| Presyncope/lightheadedness or dizziness | 30 (14.2) |
| Chest pain | 31 (14.7) |
| Hypotension | 26 (12.3) |
| Arrhythmia | 14 (6.6) |
| Headache | 8 (3.8) |
| Syncope | 14 (6.6) |
| Bradycardia | 8 (3.8) |
| Orthostatic hypotension | 2 (1.0) |
| Seizures | 0 |
| Shock with decrease in blood pressures | 2 (1.0) |
| Respiratory tract symptoms | |
| Dyspnea/difficulty breathing | 103 (48.8) |
| Tightness/fullness of the throat | 84 (39.8) |
| Laryngeal edema | 9 (4.3) |
| Wheezing/bronchospasm | 56 (26.5) |
| Cough | 31 (14.7) |
| Hoarseness/raspy voice | 17 (8.1) |
| Rhinitis | 15 (7.1) |
| Cyanosis | 11 (5.2) |
| Stridor | 12 (5.7) |
| Aphonia | 6 (2.8) |
A total of 146 (69.2%) of the 211 patients with anaphylaxis were dismissed home directly from the emergency department. There was no case of fatal outcome caused by anaphylaxis in our cohort. Eight (41.7%) patients were referred to an allergist.
Of the 211 patients who presented with an anaphylactic event, 45 (21.3%) had a second event and 11 (5.2%) had a third event of anaphylaxis. The median time of presentation with the second episode was 395 days (range, 7 days to 13 years).
The overall age- and sex-adjusted incidence rate was 49.8 (95% CI, 45.0–54.5) per 100,000 person-years. Age-specific rates were highest for ages 0 to 19 years (70 per 100,000 person-years, Table V). This includes an age–specific rate of 75.1 per 100,000 person-years for ages 0 to 9 years and 65.2 per 100,000 person-years for ages 10 to 19 years.
TABLE V.
Age- and sex-specific incidence rates of anaphylaxis in Rochester, Minnesota, 1990–2000
| Female | Male | Total | |
|---|---|---|---|
| Age group (y) | Rate* | Rate* | Rate* |
| 0–9 | 59.6 | 89.6 | 75.1 |
| 10–19 | 67.0 | 63.4 | 65.2 |
| 20–29 | 47.0 | 29.8 | 38.8 |
| 30–39 | 66.1 | 40.3 | 53.3 |
| 40–49 | 53.3 | 44.7 | 49.1 |
| 50–59 | 54.9 | 24.6 | 40.4 |
| 80+ | 30.1 | 24.7 | 28.0 |
| Age adjusted (95% CI) | 53.7† (46.7–60.6) | 45.6† (39.0–52.1) | 49.8‡ (45.0–54.5) |
Incidence per 100,000 person-years.
Age adjusted to the population structure of the US total population in 2000.
Age and sex adjusted to the population structure of the US total population in 2000.
Fig 1 shows the annual trend over the 10-year study period. There was a modest increase in the annual incidence rate across the time period (P = .034 based on a test for a linear trend). In 1990, the annual incidence was 46.9 per 100,000 persons compared with 58.9 per 100,000 persons in 2000.
FIG 1.
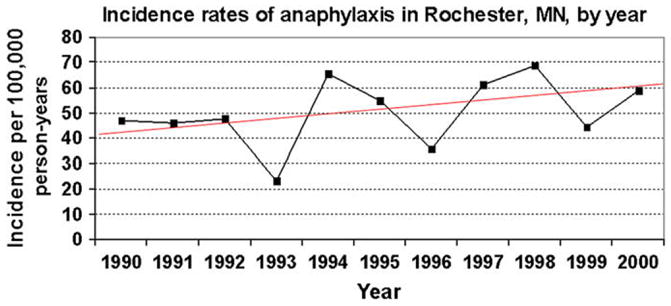
Modest increase in the annual trend of incidence rates of anaphylaxis in Rochester, Minnesota, from 1990 to 2000.
DISCUSSION
We found an overall incidence rate of anaphylaxis of 49.8 per 100,000 person-years. This rate is substantially higher than previously reported estimates of the incidence of anaphylaxis. We detected a modest increase in the incidence of anaphylaxis during our 10-year study interval.
Our rate of 49.8 cases per 100,000 person-years is more than double the rate found by Yocum et al4 in his study of Olmsted County residents from 1983 through 1987. Although few other population-based estimates exist, those that do range from 3.2 to 20 per 100,000 persons per year. We suspect that differences between our study estimates and those of previous investigators might have occurred because of differences in the definitions of anaphylaxis used for these studies. This study did use the same definition of anaphylaxis used in the Yocum et al study, but that definition, although comparable with that developed by the second National Institutes of Health–Food Allergy and Anaphylaxis Network symposium on anaphylaxis,1 is broader than that used in other studies of anaphylaxis.5 We have since reanalyzed our data using the National Institutes of Health–Food Allergy and Anaphylaxis Network criteria. Three cases did not meet the new criteria. However, this did not significantly affect our findings. Additionally, rather than confining our search for cases of anaphylaxis only to diagnostic codes that specified “anaphylaxis,” we also reviewed samples of records with less specific “allergy” codes. Approximately 25% of our final cases were identified through examination of the medical records of patients who had only received these “allergy” codes. This level of thoroughness exceeds the case-finding techniques used by Yocum et al4 and might account for the higher anaphylaxis rate we observed in the same population. Our findings are consistent with a recently published expert consensus statement estimating national anaphylaxis incidence.10
The incidences of other allergic conditions, including asthma7 and peanut allergy,6 have been found to be increasing over time. Is this the case with anaphylaxis? Studies conducted in the United Kingdom11–13 and Australia14 show there has been an increase in hospitalizations for anaphylaxis. We have also detected a modest increase in the incidence of anaphylaxis in this population during our 10-year study timeframe.
As has been previously reported, the primary inciting allergens for cases of anaphylaxis were food or insect sting related. These results are very consistent with previous studies.4 Interestingly, in more than one fourth of the cases, a specific inciting allergen could not be identified.
The primary strength of this study arises from the ability to obtain a true, population-based estimate of the incidence of anaphylaxis over a 10-year timeframe. Thanks to the Rochester Epidemiology Project collaborations between Olmsted County medical institutions and the maintenance of complete and detailed medical records, it was possible for us to identify arguably almost every case of anaphylaxis, details of treatment, and outcomes after treatment that occurred in this community between 1990 and 2000. Such information provides an unbiased estimate of the true incidence of anaphylaxis in this community.
The primary limitation of this study is its retrospective nature. This study relied on complete and accurate recording of pertinent information in the medical record. We expected the medical record to be complete and accurate for the data elements most essential to testing our study hypotheses (eg, date of diagnosis of anaphylactic event, clinical presentation, and follow-up and outcome data). A second limitation imposed by our study setting is that our findings might not be directly applicable to other populations because Olmsted County is predominantly white and middle class. However, the characteristics of the Olmsted County population are very similar to those of the US white population (Table VI). Therefore although caution is necessary for extrapolating study findings to minority or ethnic populations, results should be generalizable to populations with similar characteristics.
TABLE VI.
Demographic characteristics in 2000 of Olmsted County, Minnesota, residents in comparison with Minnesota and US residents and the US white population
| Olmsted County | Minnesota | US white population | Total US population | |
|---|---|---|---|---|
| Race | ||||
| White | 90.3 | 89.4 | 100 | 75.1 |
| Sex | ||||
| Female | 50.9 | 50.6 | 50.9 | 50.9 |
| Age (y) | ||||
| 0–5 | 7.2 | 6.7 | 6.8 | 6.8 |
| 5–9 | 7.3 | 7.2 | 21.8* | 7.3 |
| 10–14 | 7.9 | 7.6 | 7.3 | |
| 15–19 | 7.2 | 7.6 | 7.2 | |
| ≥65 | 10.7 | 12.0 | 14.3 | 12.4 |
| Median age | 35.0 y | 35.4 y | 36.4 y | 35.3 y |
| Income in dollars in 1999 | ||||
| Median per capita | $24,939 | $23,198 | $23,918 | $21,587 |
| Below poverty level | 6.4 | 7.9 | 9.4 | 9.2 |
| Education (of persons ≥25 years old) | ||||
| High school or more | 91.1 | 87.9 | 83.2 | 80.4 |
| Bachelor’s and graduate degree | 34.7 | 27.4 | 25.8 | 24.4 |
| Industry (of employed persons ≥16 years old) | ||||
| Agriculture, forestry, fisheries | 1.3 | 2.6 | 1.9 | 1.9 |
| Construction | 5.7 | 5.9 | 7.0 | 6.8 |
| Manufacturing | 15.5 | 16.3 | 13.9 | 14.1 |
| Transportation | 2.7 | 5.1 | 5.0 | 5.2 |
| Trade (wholesale, retail) | 1.3 | 15.5 | 15.7 | 15.3 |
| Finance, insurance, real estate | 3.8 | 7.2 | 7.2 | 6.9 |
| Entertainment | 6.6 | 7.2 | 7.1 | 7.9 |
| Professional services (health-related services) | 37.1 | 20.9 | 26.9 | 19.9 |
| Public administration | 2.8 | 3.4 | 4.7 | 4.8 |
Values are percentages unless indicated otherwise.
Value for 5 to 19 years.
In summary, we conducted a population-based analysis of the incidence and cause of anaphylaxis over a 10-year period. The overall incidence rate was greater than double the rates that have been previously reported, and our data suggest that anaphylaxis episodes increased between 1990 and 2000. Food and insect stings continue to be major inciting allergens for anaphylaxis.
Acknowledgments
Supported by grant no. 332-05: “The epidemiology and prehospital care of anaphylaxis in Olmsted County, Minnesota” from the Food Allergy and Anaphylaxis Network and the Mayo Foundation for Education and Research.
We thank Ms Susan Puetz for her expert administrative assistance in the conduct of this research and Dr Ediza Giraldez for her insights and assistance.
Footnotes
Clinical implications: This population-based study provides the incidence and cause of anaphylaxis. The overall incidence rate is 49.8 per 100,000 person-years, which is higher than previously reported.
Disclosure of potential conflict of interest: W. W. Decker and R. L. Campbell have received research funding from the Food Allergy and Anaphylaxis Network. J. L. St. Sauver has received research funding from the National Institutes of Health. The rest of the authors have declared that they have no conflict of interest.
References
- 1.Sampson HA, Muñoz-Furlong A, Bock SA, Schmitt C, Bass R, Chowdhury BA, et al. Symposium on the definition and management of anaphylaxis: summary report. J Allergy Clin Immunol. 2005;115:584–91. doi: 10.1016/j.jaci.2005.01.009. [DOI] [PubMed] [Google Scholar]
- 2.Sampson HA, Muñoz-Furlong A, Campbell RL, Adkinson NF, Jr, Bock SA, Branum A, et al. Second symposium on the definition and management of anaphylaxis: summary report: second National Institute of Allergy and Infectious Disease/Food Allergy and Anaphylaxis Network symposium. J Allergy Clin Immunol. 2006;117:391–7. doi: 10.1016/j.jaci.2005.12.1303. [DOI] [PubMed] [Google Scholar]
- 3.Bohlke K, Davis RL, DeStefano F, Marcy SM, Braun MM, Thompson RS, et al. Epidemiology of anaphylaxis among children and adolescents enrolled in a health maintenance organization. J Allergy Clin Immunol. 2004;113:536–42. doi: 10.1016/j.jaci.2003.11.033. [DOI] [PubMed] [Google Scholar]
- 4.Yocum MW, Butterfield JH, Klein JS, Volcheck GW, Schroeder DR, Silverstein MD. Epidemiology of anaphylaxis in Olmsted County: a population-based study. J Allergy Clin Immunol. 1999;104:452–6. doi: 10.1016/s0091-6749(99)70392-1. [DOI] [PubMed] [Google Scholar]
- 5.Mullins RJ. Anaphylaxis: risk factors for recurrence. Clin Exp Allergy. 2003;22:1033–40. doi: 10.1046/j.1365-2222.2003.01671.x. [DOI] [PubMed] [Google Scholar]
- 6.Sicherer SH, Sampson HA. Peanut allergy: emerging concepts and approaches for an apparent epidemic. J Allergy Clin Immunol. 2007;120:491–503. doi: 10.1016/j.jaci.2007.07.015. [DOI] [PubMed] [Google Scholar]
- 7.Anderson HR, Gupta R, Strachan DP, Limb EJ. 50 years of asthma: UK trends from 1955–2004. Thorax. 2007;62:85–90. doi: 10.1136/thx.2006.066407. [DOI] [PMC free article] [PubMed] [Google Scholar]
- 8.Melton LJ., III History of the Rochester Epidemiology Project. Mayo Clin Proc. 1996;71:266–74. doi: 10.4065/71.3.266. [DOI] [PubMed] [Google Scholar]
- 9.Kurland LT, Molgaard CA. The patient record in epidemiology. Sci Am. 1981;245:54–63. doi: 10.1038/scientificamerican1081-54. [DOI] [PubMed] [Google Scholar]
- 10.Lieberman P, Camargo CA, Jr, Bohlke K, Jick H, Miller RL, Sheikh A, et al. Epidemiology of anaphylaxis: findings of the American Collage of Allergy, Asthma and Immunology Epidemiology of Anaphylaxis Working Group. Ann Allergy Asthma Immunol. 2006;97:596–602. doi: 10.1016/S1081-1206(10)61086-1. [DOI] [PubMed] [Google Scholar]
- 11.Gupta R, Sheikh A, Strachan DP, Anderson HR. Time trends in allergic disorders in the UK. Thorax. 2007;62:91–6. doi: 10.1136/thx.2004.038844. [DOI] [PMC free article] [PubMed] [Google Scholar]
- 12.Sheikh A, Alves B. Hospital admissions for acute anaphylaxis: time trend study. BMJ. 2000;320:1441. doi: 10.1136/bmj.320.7247.1441. [DOI] [PMC free article] [PubMed] [Google Scholar]
- 13.Wilson R. Upward trend in acute anaphylaxis continued in 1998–9. BMJ. 2000;321:1021–2. [PMC free article] [PubMed] [Google Scholar]
- 14.Poulos LM, Waters AM, Correll PK, Loblay RH, Marks GB. Trends in hospitalizations for anaphylaxis, angioedema, and urticaria in Australia, 1993–1994 to 2004–2005. J Allergy Clin Immunol. 2007;120:878–8. doi: 10.1016/j.jaci.2007.07.040. [DOI] [PubMed] [Google Scholar]