Abstract
The purpose of this study was to determine the thickness of the macula and the retinal nerve fiber layer (RNFL) in Japanese subjects by Stratus optical coherence tomography (OCT), and to compare the findings with the normative data of subjects from the United States of America (USA). Sixty-one eyes from 31 healthy subjects were used for the measurement of the macular thickness, and 60 eyes from 30 healthy subjects were used for the RNFL thickness measurements. The values obtained from the Japanese subjects were compared with the corresponding values in healthy subjects from the USA. The superior, nasal, temporal, and inferior macular sectors and the mean and inferior areas of the RNFL in the Japanese subjects were significantly thicker than the corresponding areas of normal subjects in the USA (272 ± 13 vs 255 ± 17 μm, 274 ± 12 vs 267 ± 16 μm, 262 ± 12 vs 251 ± 13 μm, 268 ± 13 vs 260 ± 15 μm; p < 0.0001, 104 ± 11 vs 100 ± 12 μm, 134 ± 20 vs. 126 ± 18 μm; p = 0.0167, 0.0047, respectively). In conclusion, the significantly thicker macular regions and RNFL in the Japanese indicate not only that there are racial differences in retinal thicknesses but also that the normative values provided by the Stratus OCT should not be used for different races.
Keywords: macular thickness, Japanese, normal, retinal nerve fiber layer, Stratus optical coherence tomography
Introduction
The Stratus optical coherence tomographic (OCT) instrument (Model 3000, Carl Zeiss, Meditec, Dublin, CA) is a third generation model from which high-resolution B-scan images of the retina can be obtained. From these images, the thickness of the macular and the retinal nerve fiber layer (RNFL) can be measured with a resolution of 8 to 10 μm. These objective measurements are reliable and accurate which enable clinicians to follow patients with diabetic macular edema and glaucoma with greater confidence (Huang et al 1991; Lattanzio et al 2002; Jaffe and Caprioli 2004; Paunescu et al 2004).
Recent studies from the United States of America (USA) provided the normative values of the thicknesses of the macular and RNFL for the Stratus OCT (Chan et al 2006; Budenz et al 2007). This was important because Frank and colleagues (2004) demonstrated that the values obtained by Stratus OCT were significantly different from those obtained by the first generation OCT1. In addition, Budenz and colleagues (2007) reported on possible racial differences in the thicknesses of the macula and RNFL obtained by the Stratus OCT. Because of the small number of Asian subjects in their study, the conclusion that the RNFL was thinner in Caucasians than in Asians should be accepted with some degree of caution (Budenz et al 2007).
The purpose of this study was to obtain normative data of the thickness of the macular and RNFL with the Stratus OCT in Japanese, and to compare these values with those of normal American subjects presented by Chan and colleagues (2006) and by Budenz and colleagues (2007).
Methods
Subjects
Outpatients who visited our clinic for routine ophthalmological examinations from January 2007 to March 2007 were recruited for this study. After an explanation of the procedures to be performed, an informed consent was obtained from all participants. All subjects had a routine ophthalmological examination. The subjects who had a best-corrected visual acuity <20/32 on the Early Treatment Diabetic Retinopathy Study scale, high myopia >−8 diopters, history of diabetic mellitus or hypertension, had previously ocular surgery, ocular hypertension, disc anomaly (small and large disc), and history of optic nerve or retinal diseases were excluded. The research protocol was approved by the Institutional Review Board of the Sannoh Hospital, and the procedures used conformed to the tenets of the World Medical Association Declaration of Helsinki. The demography of the cohorts is shown in Table 1.
Table 1.
The demographic characteristics of the cohorts
| Outpatients who had visited our clinic from January 2007 to March 2007 |
| ↓ |
| Obtained informed consents |
| ↓ |
| Performed routine ophthalmological examinations |
| ↓ |
| Performed OCT measurements for patients fitted with the criteria |
| ↓ |
| Recruited them in this study (Excluded patients with the abnormal or the error OCT findings) |
Sixty-one eyes from 31 subjects were used for the measurements of the macular thicknesses, and 60 eyes from 30 subjects without any optic nerve and retinal diseases were used for the RNFL thickness measurements. Their ages ranged from 27 to 77 years, and there were 19 men and 12 women for the macular thickness measurements and 16 men and 14 women for the RNFL thickness measurements.
OCT measurements
Stratus OCT scans were made through a dilated pupil, and the programs for the Fast RNFL thickness and the Fast Macular thickness measurements were used. The Fast macular thickness protocol consists of 6 radial scans of 6 mm length through the center of the fovea. The scans were made while monitoring the image of the central retina on a video monitor. The retinal thickness was measured as the distance between the vitreoretinal interface and the anterior surface of the retinal pigment epithelium along each A-scan. From the retinal map analysis protocol, we selected 5 sites in the inner rings with a diameter of 3 mm. The foveal thickness was defined as the average in the center 1 mm diameter ring. The outer sectors between 3 mm and 6 mm diameter were not used because the reliability of the measurements was lower than that of the inner sectors.
The Fast RNFL measurements consisted of 3 circular peripapillary scans with a 3.4 mm diameter centered on the optic disc. Each scan consisted of 256 measurement points along the circle, and data were collected for 1.8 seconds. The average overall peripapillary thickness and the thickness of the superior and inferior quadrants were analyzed. The RNFL thickness was defined as the number of pixels between the highly reflective layer at the vitreous surface and the points on each scan’s reflectivity exceeding a specific threshold. The thickness was automatically calculated with the embedded software.
Statistical analysis
All data are expressed as means ± standard deviations (SDs), and the Stat View 5.0 program (SAS Institute Japan Ltd., Tokyo, Japan) was used for all statistical analyses. The macular thickness data were compared to those presented by Chan and colleagues (2006) for subjects in the USA (fovea, 212 ± 20 μm; superior, 255 ± 17 μm; inferior, 260 ± 15 μm; temporal, 251 ± 13 μm; and nasal, 267 ± 16 μm).
The statistical analyses comparing the differences in the macular thickness between men and women, and between the right and the left eyes was performed by t tests. The correlations between age and macular thickness were analyzed by Spearman’s correlation coefficient. A p value <0.05 was considered significant.
We compared the RNFL thicknesses with those presented by Budenz and colleagues (2007) for American subjects (mean RNFL thickness, 100.1 ± 11.6 μm; superior section, 124.2 ± 17.9 μm; and inferior, 126.1 ± 17.8 μm). In addition, the mean RNFL thickness of their Asian subjects (105.8 ± 9.2 μm; n = 11) was compared with our data. To exclude the effect of age, the mean RNFL thickness of the subjects were subdivided into age groups; 40 years (99.9 ± 12.2 μm), 50 years (99.4 ± 12.7 μm), and 60 years (96.9 ± 10.8 μm). Our data were compared with their data obtained from subjects of comparable ages. Statistical analyses were performed by student’s t tests. The comparison of the RNFL thickness between men and women and between the right and the left eyes was performed with t tests. The correlations between age and three RNFL thickness parameters (mean, superior, inferior) were analyzed by Spearman’s correlation coefficient. A p value <0.05 was considered significant.
Results
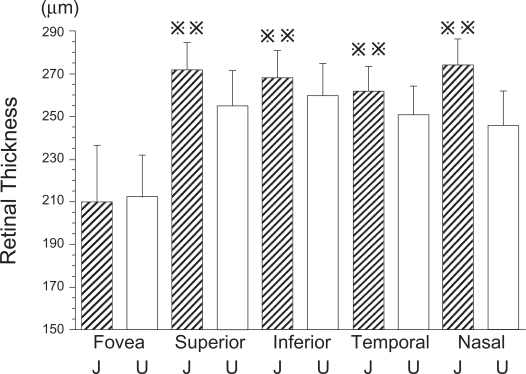
The mean thickness of the fovea was 209.5 ± 26.7 μm, the superior sector was 272.1 ± 12.6 μm, the inferior sector was 268.3 ± 13.0 μm, the temporal sector was 261.7 ±11.9 μm, and the nasal sector was 274.3 ±12.1 μm. A comparison of our data with the data presented by Chan and colleagues (2006) is shown in Figure 1. The mean macular thickness, and the mean thickness of the superior, nasal, inferior, and temporal sectors were significantly thicker in Japanese than in the American subjects (Figure 1). However, the fovea was not significantly thicker in the Japanese than the fovea of the American subjects in Chan and colleagues’s study (p < 0.0001).
Figure 1.
Comparison of macular thickness measured by Stratus OCT of Japanese and American subjects. The mean macula thickness of Japanese subjects was significantly thicker than that of American subjects except for the mean fovea thickness (p < 0.01).
 ; p < 0.01, J; Japanese, U; United States of America.
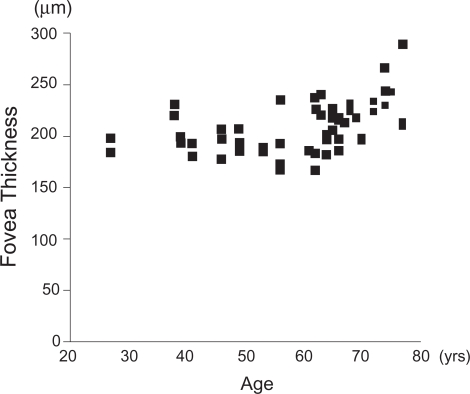
No significant difference was found between men and women in all sectors, and the correlation between the age and the mean thickness was not significant for all sectors except for the fovea (r = 0.57, p < 0.0001; Figure 2).
Figure 2.
Relationship between the mean fovea thickness and age of Japanese subjects. Although the correlation is not linear, a significant coefficient of correlation between mean fovea thickness and age was observed especially in subjects >60 years (r = 0.57, p < 0.0001 by Spearman’s correlation coefficient).
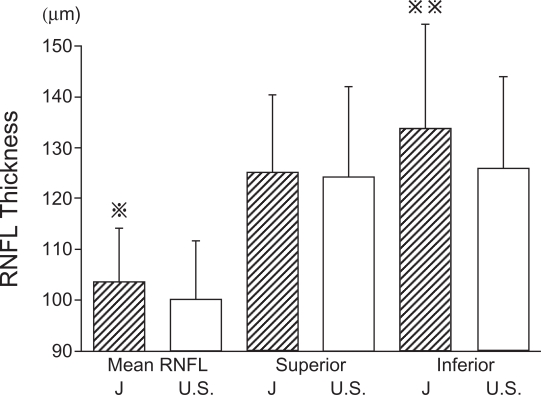
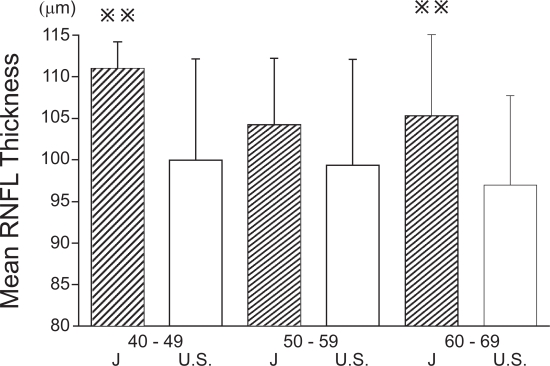
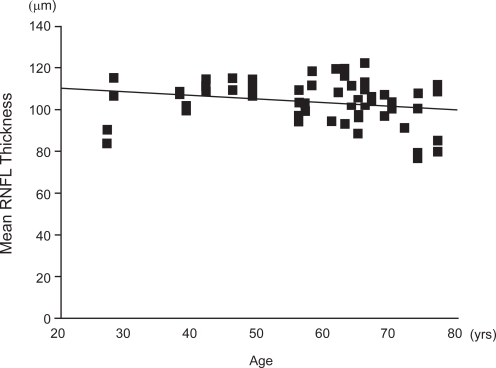
The overall mean RNFL thickness was 103.5 ± 10.6 μm, the superior sector was 125.1 ± 15.3 μm, and the inferior sector was 133.9 ± 20.4 μm. A comparison of our data with those of Budenz and colleagues (2007) is shown in Figure 3. The mean RNFL thickness were subdivided into age groups and compared with the comparable ages of the subjects of Budenz and colleagues (2007) (Figure 4). The mean and inferior areas of the RNFL in the Japanese subjects were significantly thicker than the corresponding areas of the American subjects of comparable ages. However, the mean RNFL of Japanese was not significantly different from that of Asian subjects in the USA (105.8 ± 9.2 vs 103.5 ± 10.6 μm) (Budenz et al 2007). The correlation between the age and mean RNFL thickness was just significant (r = −0.26, p = 0.05; Figure 5). The summarized data of the statistical analysis are shown in Table 2 and 3.
Figure 3.
Comparison of mean RNFL thickness measured by Stratus OCT of Japanese and American subjects. The mean RNFL thickness was significantly thicker in the Japanese subjects than that of American subjects (p < 0.05). The difference of the inferior RNFL thickness was highly significant (p < 0.01).
 p < 0.05,
 ; p < 0.01, J; Japanese, U.S.; United States of America.
Figure 4.
Comparison of mean RNFL thickness in different age groups for Japanese and American subjects. In forties and sixties, mean RNFL thickness of Japanese subjects was significantly thicker than that of American subjects (p < 0.01).
 ; p < 0.01, J; Japanese, U.S.; USA.
Figure 5.
Correlation between the mean RNFL thickness and age measured by Stratus OCT. The coefficient of correlation between mean RNFL thickness and age was significant. A positive linear regression line was fitted to the data (r = −0.26, p < 0.05 by Spearman’s correlation coefficient).
Table 2.
The summarized data obtained from the statistical analysis of the different sectors
| Macular thickness | Fovea | Superior | Temporal | Nasal | Inferior |
| Japanese | 209.5 ± 26.7 | 272.1 ± 12.6 | 261.7 ± 11.9 | 274.3 ± 12.1 | 268.3 ± 13.0 |
| USA | 212 ± 20 | 255 ± 17 | 251 ± 13 | 267 ± 16 | 260 ± 15 |
| p value (t test) | 0.4648 | < 0.0001 | < 0.0001 | < 0.0001 | < 0.0001 |
| t value | −0.736 | 10.518 | 6.968 | 4.678 | 4.938 |
| p value (Spearman) | < 0.0001 | 0.065 | 0.8191 | 0.7835 | 0.1576 |
| r value | 0.569 | −0.24 | 0.03 | 0.036 | −0.184 |
| RNFL thickness | Mean | Superior | Inferior | ||
| Japanese | 103.5 ± 10.6 | 125.1 ± 15.3 | 133.9 ±20.4 | ||
| USA | 100.1 ± 11.6 | 124.2 ± 17.9 | 126.1 ± 17.8 | ||
| p value (t test) | 0.0167 | 0.6388 | 0.0047 | ||
| t value | 2.463 | 0.472 | 2.939 | ||
| p value (Spearman) | 0.0462 | 0.5955 | 0.0534 | ||
| r value | −0.26 | 0.069 | −0.251 | ||
The units of the macular and the RNFL thickness = μm. p values and t values of the student’s t test were obtained from the statistical analysis between Japanese and USA subjects. p values and r values of Spearman’s correlation coefficient were obtained from the correlations between Japanese OCT measurements and age.
Table 3.
OCT measurements of the right and the left eyes
| Macular thickness (μm) | pvalue | tvalue | |
| Fovea (Right) | 208.2 ± 25.0 | 0.4123 | −0.832 |
| Fovea (Left) | 210.7 ± 28.6 | 0.81 | −0.243 |
| Superior (Right) | 271.4 ± 12.2 | < 0.0001 | 7.364 |
| Superior (Left) | 272.7 ± 13.1 | < 0.0001 | 7.414 |
| Temporal (Right) | 262.4 ± 12.8 | < 0.0001 | 4.877 |
| Temporal (Left) | 261 ± 11.1 | < 0.0001 | 4.941 |
| Nasal (Right) | 272.5 ± 11.8 | 0.0163 | 2.55 |
| Nasal (Left) | 276.1 ± 12.2 | 0.0003 | 4.059 |
| Inferior (Right) | 268.4 ± 13.1 | 0.0014 | 3.519 |
| Inferior (Left) | 268.1 ± 13.0 | 0.002 | 3.405 |
| RNFL thickness (μm) | pvalue | tvalue | |
| Mean (Right) | 102.5 ± 10.3 | 0.2094 | 1.284 |
| Mean (Left) | 104.4 ± 10.9 | 0.0392 | 2.159 |
| Superior (Right) | 123.4 ± 16.1 | 0.7791 | −0.283 |
| Superior (Left) | 126.9 ± 14.5 | 0.3174 | 1.017 |
| Inferior (Right) | 132.5 ± 20.6 | 0.0989 | 1.705 |
| Inferior (Left) | 135.2 ± 20.6 | 0.0217 | 2.425 |
There were no statistical significances of the OCT measurements between the right and the left eyes of all sectors. However, the measurements of the left eyes seemed to be thicker than those of the right eyes. The fixation of the left eyes was better than the right eyes because of the effect of the practice. Thus, the data of the left eyes may be more reliable than that of the right eyes. p values and t values were obtained from the student’s t test between Japanese and USA subjects.
Discussion
Although the Stratus OCT has been commercially available since 2002, only three studies were found in a search of MEDLINE and PubMed that presented normative data of macular thickness and RNFL thickness (Paunescu et al 2004; Chan et al 2006; Budenz et al 2007). The Stratus OCT is one of the most popular instrument for following patients with diabetic retinopathy and glaucoma, and normative data for each ethnic group is now needed for clinicians. We have obtained normative data for the Japanese, and have compared them with the normative data obtained from subjects in the USA (Chan et al 2006; Budenz et al 2007).
As in most studies which compare data obtained at different clinics, there will be experimental and procedural differences, eg, the ages, refractive errors, health conditions, and the skills of the examiners. However, an examination of the results suggests that these differences did not affect the conclusions significantly. For example, the mean foveal thickness in the Japanese did not differ significantly from the foveal thickness of the American subjects in Chan and colleagues’s study. In addition, our results showed that the mean macular thickness except for the fovea was not correlated with age (Figure 2; Table 2) as was also found by Chan and colleagues (2006). Another consistency was that the RNFL thickness in our study on Japanese did not differ from that of the Asian subjects in Budenz and colleagues’s study (105.8 ± 9.2 vs 103.5 ± 10.6 μm) (Budenz et al 2007). More relevant to the comparisons, Budenz and colleagues also reported that the RNFL was thinner in his Caucasian subjects than his Asian subjects as we have found.
To exclude the effects of age, we subdivided the subjects according to their ages, and compared the mean RNFL thickness in the Japanese subjects to that of Americans subjects by age groups (Figure 4). Even after the ages had been matched, the mean RNFL thickness of Japanese subjects in the forties and sixties age groups was significantly thicker than that of American subjects of the same ages (Figure 4). These results indicated that the conclusions were not altered because of the age of the subjects.
The differences in the refractive errors may have also affected the results of the RNFL thickness (Budenz et al 2007). However, the agreement of our results of the RNFL thickness with the thicknesses of the Asian subjects in Budenz et al’s study (105.8 ± 9.2 vs 103.5 ± 10.6 μm) (Budenz et al 2007) where refractive errors were not matched, would indicate that the refractive errors were comparable in the two groups or that it was not a significant factor.
We excluded all patients with severe health condition such as hypertension and diabetes. Thus, differences in the health of our participants could not have contributed to the differences in the OCT findings.
All measurements were performed by the first author of this manuscript who is a well-trained retinal surgeon and experienced in performing OCT. The reliability of the OCT measurements can be assessed by the agreement in the foveal thicknesses in the two ethnic groups and with the agreement with the Asians in the American study. Thus, the differences cannot be attributed to differences in the procedures or the skills of the investigator.
Taken together, these findings indicate that our data are valid and can be compared to the data obtained at the American clinics.
Our data showed that the mean thickness of the fovea in the Japanese subjects was not significantly different from that of the subjects in the USA. However, the superior, inferior, temporal, and nasal sectors of the macula were significantly thicker in the Japanese than the comparable sectors of the American subjects (Chan et al 2006). Chan and colleagues (2006) did not separate their data by race. Thus, this is the first report to compare the normative data of the mean macular thickness measured by the Stratus OCT in one race.
Although there were variations in the RNFL thickness measured by the Stratus OCT (Budenz et al 2005), our data showed that the mean thickness of the RNFL was thicker in Japanese than that of subjects in the USA. The differences were especially significant for the inferior sector. Our findings agree with those of Budenz and colleagues (2007) who reported that the RNFL was significantly thinner in his Caucasian subjects than his Asian subjects. On the other hand, Zou and colleagues (2006) reported that the macular thickness of healthy Chinese subjects in China was slightly thinner than that of Western subjects. However, they used the retinal thickness analyzer as opposed to the Stratus OCT for their measurements (Zou et al 2006).
Our data showed that a significant correlation was present between foveal thickness and age especially for subjects >60 years. This does not agree with the findings of Chan and colleagues (2006). However, the decrease in the RNFL thickness with age is consistent with previous reports (Schuman et al 1995; Varma et al 2003; Budenz et al 2007). The relatively higher mean age of our subjects may be the cause of this finding. Chan and colleagues (2006) provided only the median of the age, which was 43 years. In our study, the median age was 64 years. A retraction of a posterior vitreous, reduced compression of the vitreous after vitreous liquefaction, and/or structural weakness may be the cause of the thicker fovea in older subjects. We cannot determine whether the relationship between foveal thickness and age may be caused by the racial differences.
According to clinical and histological studies, a decrease of RNFL thickness with age may be related to the loss of retinal ganglion cell axons with age; 5000 axons/year are lost from birth to death (Balazsi et al 1984; Quigley et al 1989). Thus, the decrease in the mean RNFL thickness with age in the OCT measurements seems to be reasonable.
However, the increase in foveal thickness with age may not be explained by the loss of neurons with age. Further studies are needed to examine the relationship between foveal thickness and age especially at older ages.
In conclusion, the macular and the RNFL measured by Stratus OCT were significantly thicker in the Japanese than the comparable sectors of American subjects. Although the data were collected in different clinics and the procedures were not standardized, we conclude that the data and the comparisons were valid. Most importantly, clinicians should consider these racial differences when using the measurements of the Stratus OCT in their patients.
Acknowledgments
This study is supported from the Grant-in Aid from The Eye Research Foundation for the Aged in Japan. We thank Prof. Duco Hamasaki for editing this manuscript.
References
- Balazsi AG, Rootman J, Drance SM, et al. The effect of age on the nerve fiber population of the human optic nerve. Am J Ophthalmol. 1984;97:760–6. doi: 10.1016/0002-9394(84)90509-9. [DOI] [PubMed] [Google Scholar]
- Budenz DL, Anderson DR, Varma R, et al. 2007Determinants of normal retinal nerve fiber layer thickness measured by Stratus OCT Ophthalmology(in press) [DOI] [PMC free article] [PubMed] [Google Scholar]
- Budenz DL, Chang RT, Huang X, et al. Reproducibility of retinal nerve fiber thickness measurements using the stratus OCT in normal and glaucomatous eyes. Invest Ophthalmol Vis Sci. 2005;46:2440–3. doi: 10.1167/iovs.04-1174. [DOI] [PubMed] [Google Scholar]
- Chan A, Duker JS, Ko TH, et al. Normal macular thickness measurements in healthy eyes using Stratus optical coherence tomography. Arch Ophthalmol. 2006;124:193–8. doi: 10.1001/archopht.124.2.193. [DOI] [PMC free article] [PubMed] [Google Scholar]
- Frank RN, Schulz L, Abe K, et al. Temporal variation in diabetic macular edema measured by optical coherence tomography. Ophthalmology. 2004;111:211–7. doi: 10.1016/j.ophtha.2003.05.031. [DOI] [PubMed] [Google Scholar]
- Huang D, Swanson EA, Lin CP, et al. Optical coherence tomography. Science. 1991;254:1178–81. doi: 10.1126/science.1957169. [DOI] [PMC free article] [PubMed] [Google Scholar]
- Jaffe GJ, Caprioli J. Optical coherence tomography to detect and manage retinal disease and glaucoma. Am J Ophthalmol. 2004;137:156–69. doi: 10.1016/s0002-9394(03)00792-x. [DOI] [PubMed] [Google Scholar]
- Lattanzio R, Brancato R, Pierro L, et al. Macular thickness measured by optical coherence tomography (OCT) in diabetic patients. Eur J Ophthalmol. 2002;12:482–7. doi: 10.1177/112067210201200606. [DOI] [PubMed] [Google Scholar]
- Paunescu LA, Schuman JS, Price LL, et al. Reproducibility of nerve fiber thickness, macular thickness, and optic nerve head measurements using StratusOCT. Invest Ophthalmol Vis Sci. 2004;45:1716–24. doi: 10.1167/iovs.03-0514. [DOI] [PMC free article] [PubMed] [Google Scholar]
- Quigley HA, Dunkelberger GR, Green WR. Retinal ganglion cell atrophy correlated with automated perimetry in human eyes with glaucoma. Am J Ophthalmol. 1989;107:453–64. doi: 10.1016/0002-9394(89)90488-1. [DOI] [PubMed] [Google Scholar]
- Schuman JS, Hee MR, Puliafito CA, et al. Quantification of nerve fiber layer thickness in normal and glaucomatous eyes using optical coherence tomography. Arch Ophthalmol. 1995;113:586–96. doi: 10.1001/archopht.1995.01100050054031. [DOI] [PubMed] [Google Scholar]
- Varma R, Bazzaz S, Lai M. Optical tomography-measured retinal nerve fiber layer thickness in normal latinos. Invest Ophthalmol Vis Sci. 2003;44:3369–73. doi: 10.1167/iovs.02-0975. [DOI] [PubMed] [Google Scholar]
- Zou H, Zhang X, Xu X, et al. Quantitative in vivo retinal thickness measurement in Chinese healthy subjects with retinal thickness analyzer. Invest Ophthalmol Vis Sci. 2006;47:341–7. doi: 10.1167/iovs.05-0480. [DOI] [PubMed] [Google Scholar]


