Abstract
The mechanism by which dipicolylamine (DPA) chelate-appended fluorophores respond to zinc was investigated by the synthesis and study of five new analogs of the 2′,7′-dichlorofluorescein-based Zn2+ sensor Zinpyr-1 (ZP1). With the use of absorption and emission spectroscopy in combination with potentiometric titrations, a detailed molecular picture has emerged of the Zn2+ and H+ binding properties of the ZP1 family of sensors. The two separate N3O donor atom sets on ZP1 each converge to form binding pockets in which all four heteroatoms participate in coordination to either Zn2+ or protons. The position of the pyridyl group nitrogen atom, 2-pyridyl or 4-pyridyl, has a large impact on the fluorescence response of the dyes to protons despite relatively small changes in pKa values. The fluorescence quenching effects of such multifunctional electron-donating units are often taken as a whole. Despite the structural complexity of ZP1, however, we provide evidence that the pyridyl arms of the DPA appendages participate in the quenching process, in addition to the contribution from the tertiary nitrogen amine atom. Potentiometric titrations reveal ZP1 dissociation constants (Kd) for Zn2+ of 0.04 pM and 1.2 nM for binding to the first and second binding pockets of the ligand, respectively, the second of which correlates with the value observed by fluorescence titration. This result demonstrates that both binding pockets of this symmetric, ditopic sensor need to be occupied in order for full fluorescence turn-on to be achieved. These results have significant implications for the design and implementation of fluorescent sensors for studies of mobile zinc ions in biology.
Introduction
The last several years have seen substantial growth in the field of ion-selective fluorescence sensing, including the detection of transition metal ions,1–5 alkali and alkaline earth metal cations,6,7 protons,8–10 and anions.11–13 Because of the biological relevance of these species, many detection efforts have focused on the use of fluorescent sensors in cells and tissues.14–16 Interest in biological Zn2+ is especially high, particularly loosely-bound, mobile populations of the ion in various human tissues including, but not limited to, the pancreas,17,18 intestine,19,20 retina,21,22 and brain.23–26 Although the application of fluorescence-based functional imaging in a biological setting is the ultimate goal, the continued development of improved sensors depends on achieving a thorough understanding of the underlying chemical properties of the available constructs.
Many ion sensors are based on the well-known fluorophore-spacer-receptor design, in which an alkyl spacer separates the fluorescent component from the analyte-binding receptor.1 “Turn-on” sensors are often described as functioning by means of a photoinduced electron transfer (PET) mechanism,27 whereby the receptor unit serves as an electron donor in the absence of analyte, quenching the fluorophore excited state. Upon binding of the analyte to the receptor, electron transfer is prevented and the quenching mechanism is blocked. Descriptions of this process are usually qualitative in nature, although some worthy efforts have been directed toward quantifying the energetics of electron transfer by employing redox potentials28–30 or through theoretical computations.10,31
When the receptor component of such a fluorescent sensor is composed of a single heteroatom or small chemical unit, the quenching behavior of the compound is easily identified.32 One recent study explored the possibility that more distal heteroatoms in a complex fluorescein derivative might serve as electron donors in the quenching process.33 In our previous descriptions of sensors bearing the 2,2-dipicolylamine (2,2-DPA) moiety as the receptor, the tertiary nitrogen atom has been cited as the electron donor in the metal-free state;34 however, some experiments have linked the fluorescence change of related pyridyl-appended sensors at low pH values to protonation of the pyridyl group (Figure 1).9,35 Other reports, using sensors with an extended receptor group that includes 2,2-DPA, ignore any potential quenching contribution from this unit, focusing instead on a more proximal electron donor.36,37
Figure 1.
Examples of fluorescent sensors with DPA receptors that exhibit a quenching mode other than electron transfer from the tertiary nitrogen atom. On the left, a protonated pyridyl group acts as an electron acceptor from the excited anthracene ring (Ref. 9). On the right, quenching is ascribed to donation from the aminobenzoate group into the fluorophore (Ref. 37).
Since the report of our first fluorescent Zn2+ sensor, Zinpyr-1 (1, Chart 1),38 we have prepared a variety of analogs with a range of receptor units, binding affinities, and fluorescent responses.39–41 During the same interval, we evaluated their ability to detect labile zinc in cells and neuronal tissue.42,43 Although many compounds can provide qualitative images of mobile zinc in live cells, it is desirable to identify and quantitate subcellular zinc pools as part of the process of understanding the role of this important metal ion. This goal cannot be realized without thorough knowledge of the fluorescence behavior of the sensors in relation to their ion-binding properties.
Chart 1.
Compounds studied and synthetic precursors
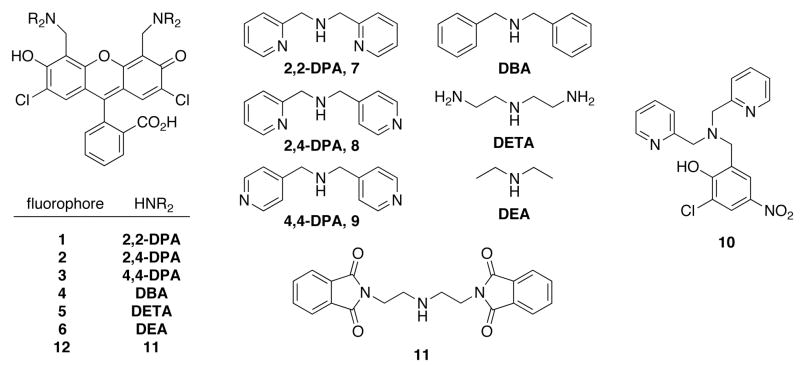
Despite their relative ease of synthesis, symmetrical members of the Zinpyr family of sensors are fairly complex in terms of structure, with two separate metal-binding pockets and several potential protonation sites (Chart 1). Although a few properties were identified that led to improvements to reduce proton-based background fluorescence and to tune the Zn2+ affinity,44 a complete understanding of the solution equilibria and photophysical behavior of these compounds is lacking. To address this deficiency, a series of new ZP1 analogs was synthesized, modifying the receptor groups to tune both the proton affinity and contribution to fluorophore quenching. As described here, by using a combination of spectrophotometric and potentiometric pH titration methods, we obtained a complete set of pKa values for ZP1 and, using this information, have been able to identify the protonated and zinc-bound species in solution responsible for fluorescence turn-on over a wide pH range. This analysis has also led us to revise some previously reported properties of this sensor, including the Zn2+ affinity and extent of fluorescence response to increasing equivalents of both Zn2+ and protons. The results represent a significant step forward in elucidating the solution chemistry of complex ion-responsive fluorescent probes and provide a paradigm for future work in this area.
Experimental Section
Reagents
2′,7′-Dichlorofluorescein (DCF) was purchased from Avocado and recrystallized from EtOH before use. Solvents were supplied by Mallinckrodt and used as received. PIPES, piperazine-N,N′-bis(2-ethanesulfonic acid), and 99.999% KCl were purchased from Calbiochem. The synthesis of 1,5-bis(phthalimido)-3-azapentane (11) was previously described.45 All other reagents were purchased from Aldrich and used as received.
General Methods
NMR spectra were obtained on a Bruker 400 MHz spectrometer at ambient temperature and referenced to the residual proton resonance of the deuterated solvent. Low-resolution mass spectra were obtained by using an Agilent 1100 Series LC/MSD mass spectrometer. High-resolution mass spectra were provided by staff at the MIT Department of Chemistry Instrumentation Facility using a Bruker Daltonics APEXIV 4.7 Tesla FT-ICR mass spectrometer.
Spectroscopic Measurements
Optical absorption spectra were collected with a Cary 1E spectrophotometer and fluorescence emission spectra were recorded with a Photon Technology International QM-4/2003 fluorometer. Measurements at pH 7.0 were performed in aqueous buffer containing 50 mM PIPES and 100 mM KCl. Solutions for quantum yield measurements under basic conditions contained 0.1 M NaOH with no additional electrolyte. Extinction coefficients were obtained at pH 7.0 using dye solutions in the range 0.1–1.0 μM. All quantum yield measurements were performed with a dye concentration of 0.3 μM, exciting each fluorophore at its wavelength of maximal absorbance. Emission spectra were integrated from 490–700 nm after subtracting the signal caused by scattered excitation light. Fluorescence pH titration curves were acquired using a solution containing 10 mM KOH, 100 mM KCl, and 1.0 μM dye, to which was added aliquots of dilute aqueous HCl. Readings at several points between pH 2–10 were recorded using an Orion 720A pH meter. Samples were maintained at 25 ± 1 °C using a circulating water bath for all spectroscopic measurements.
Potentiometric Titrations
A Mettler Toledo T70 Automated Titrator equipped with a DG-111-SG glass electrode, calibrated against standard buffers, was used for all potentiometric titrations. Solutions were prepared from Millipore water that had been degassed by boiling under low pressure for at least three hours.46 Samples were maintained at 25 ± 1 °C by circulating temperature-regulated water through the jacketed titration vessel during all experiments. Initial solutions of ligands 7–10 contained 1 mM of the neutral molecule and three equivalents of HCl. Compounds 1–3 (0.6–1 mM) were predissolved in 1 mL of 1.0 M HCl and diluted with water. Samples were titrated with ca. 0.1 M NaOH, which was standardized against potassium hydrogen phthalate before each series of titrations. Analysis of the data was performed by using the HYPERQUAD2006 v3.1.48 computer program.47 For each compound, the proton dissociation constants (pKa values) were determined from three separate titrations. The number of protonation equilibria was allowed to vary during the construction of computer models for titrations of 1–3. In each case, the best fit was obtained for a six-proton system. Titrations of 1 and 10 in the presence of one equivalent of ZnCl2 were used to calculate dissociation constants (Kd values) for Zn2+. The previously determined pKa values were held constant during refinement of the Kd values. In all cases, the triplicate data sets for each compound were combined for determination of the dissociation constants, which in turn were used to compute theoretical titration curves for comparison with the experimental ones. Titration solutions contained 100 mM KCl as the electrolyte to maintain constant ionic strength and log(Kw) was defined as 13.78, which is appropriate for these conditions.48
X-ray Crystallographic Studies
Single crystals were coated with paratone-N oil, mounted at room temperature on the tips of glass fibers or nylon loops (Oxford magnetic mounting system), and cooled under a stream of cold N2 maintained by a KRYO-FLEX low-temperature apparatus. Intensity data were collected on a Bruker APEX CCD diffractometer with graphite-monochromated Mo Kα radiation (λ= 0.71073 Å) controlled by a Pentium-based PC running the SMART software package.49 A total of 2800 frames were acquired for each measurement. The structures were solved by direct methods and refined on F2 by using the SHELXTL software.50,51 Empirical absorption corrections were applied with SADABS52 and the structures were checked for higher symmetry with PLATON.53 All non-hydrogen atoms were refined anisotropically. In general, hydrogen atoms were assigned idealized positions and given thermal parameters equivalent to either 1.5 (methyl hydrogen atoms) or 1.2 (all other hydrogen atoms) times the thermal parameter of the atom to which they were attached. The hydrogen atoms of O1 and O3 of the hydroxyl groups in all three structures were located from the electron density map, respectively, as were the hydrogen atoms of the water molecule in the structure of 1.
Compound 6 crystallizes without solvent, whereas compound 1 crystallizes with one molecule each of MeCN and water. There are two independent molecules in the asymmetric unit of crystalline 2. A pyridine ring in one of these molecules was modeled as disordered over two positions with relative occupancies of 69:31.
(2-Pyridylmethyl)(4-pyridylmethyl)amine (2,4-DPA, 8)
A solution of 4-(aminomethyl)pyridine (0.95 mL, 9.4 mmol) and 2-pyridylcarboxaldehyde (0.95 mL, 9.9 mmol) in 10 mL of MeOH was stirred for 5 min before adding NaBH4 (403 mg, 10.6 mmol) slowly over 5 min. The resulting red solution was stirred overnight, followed by addition of 10 drops of concentrated HCl. The solution was concentrated to afford a red oil then diluted with 50 mL of H2O. Extraction into CHCl3, washes with sat. aq. NaHCO3, drying over MgSO4, and evaporation of solvent yielded an amber oil. Flash chromatography on a silica column (CH2Cl2:MeOH gradient from 40:1 to 20:1) gave 872 mg (48 %) of a yellow oil. 1H NMR (CD2Cl2, 400 MHz) δ 3.82 (2H, s), 3.86 (2H, s), 7.14–7.18 (1H, m), 7.27–7.31 (3H, m), 7.61–7.67 (1H, dt, J = 2.0 Hz, 8.0 Hz), 8.47–8.54 (3H, m). LRMS (ESI) calcd for [M+H]+, 200.1; found, 199.9.
9-(o-Carboxyphenyl)-2,7-dichloro-4,5-bis[2-(pyridylmethyl)-4-(pyridylmethyl)-aminomethyl]-6-hydroxy-3-xanthenone (2,4-DPA-DCF, 2)
A mixture of 2,4-DPA (239 mg, 1.20 mmol) and paraformaldehyde (31.0 mg, 1.03 mmol) in 11 mL of MeCN was heated at 70 °C for 20 min before adding a suspension of DCF (150 mg, 0.374 mmol) in 12 mL of MeCN. The solution was stirred at 65 °C for 2 d and then cooled to room temperature. Crystals slowly formed upon standing. The material was filtered and washed with MeCN, Et2O, and pentane, yielding 218 mg (71 %) of pink crystalline blocks. mp = 188 °C (dec); 1H NMR (DMSO-d6, 400 MHz) δ 3.79 (4H, s), 3.94 (4H, s), 4.10 (4H, s), 6.50 (2H, s), 7.24 (4H, d, J = 4.8 Hz), 7.30 (1H, d, J = 7.6 Hz), 7.33–7.40 (4H, m), 7.70 (1H, app t, J = 7.6 Hz), 7.78 (1H, app t, J = 7.6 Hz), 7.84 (2H, app t, J = 7.6 Hz), 7.96 (1H, d, J = 8.0 Hz), 8.41 (4H, d, J = 4.8 Hz), 8.61 (2H, d, J = 4.0 Hz). 13C NMR (DMSO-d6, 125 MHz) δ 49.44, 57.08, 58.25, 82.83, 110.55, 112.72, 116.92, 123.56, 124.15, 124.80, 125.70, 126.73, 127.32, 131.20, 136.47, 138.35, 147.62, 148.84, 149.03, 150.24, 151.82, 155.97, 157.34, 168.86. HRMS (ESI) calcd for [M+H]+, 823.2197; found, 823.2204.
Di(4-pyridylmethyl)amine (4,4-DPA, 9)
To a solution of 4-pyridylcarboxaldehyde (0.95 mL, 10 mmol) and 4-aminomethylpyridine (0.91 mL, 9.0 mmol) in 10 mL of MeOH was added NaBH4 (360 mg, 9.5 mmol) slowly over 2 min. The resulting red solution was stirred overnight before quenching with 10 drops of concentrated HCl. The solution was concentrated to give an oil, then diluted with 20 mL of H2O and made basic with additions of solid Na2CO3. The material was extracted into CHCl3, washed with sat. aq. NaHCO3, dried over MgSO4, and concentrated to an oil. Flash chromatography on a silica column (CH2Cl2:MeOH gradient from 20:1 to 9:1) yielded 450 mg (25 %) of a yellow oil. 1H NMR (CD2Cl2, 400 MHz) δ 1.72 (1H, br s), 3.84 (4H, s), 7.32 (4H, d, J = 6.4 Hz), 8.53 (4H, d, J = 6.4 Hz). LRMS (ESI) calcd for [M+H]+, 200.1, found 200.0.
9-(o-Carboxyphenyl)-2,7-dichloro-4,5-bis[di(4-pyridylmethyl)aminomethyl]-6-hydroxy-3-xanthenone (4-DPA-DCF, 3)
A suspension of di(4-pyridylmethyl)amine (159 mg, 0.797 mmol) and paraformaldehyde (24.4 mg, 0.813 mmol) in 6 mL of MeCN was stirred at 80 °C for 20 min before adding a suspension of DCF (102 mg, 0.254 mmol) in 12 mL of MeCN. After stirring overnight at 80 °C, the mixture was allowed to cool to room temperature and filtered. The resulting solid was washed with MeCN, Et2O, and pentane, yielding 162 mg (77 %) of pink powder. mp = 196 °C (dec); 1H NMR (CD2Cl2/MeOD, 400 MHz) δ 3.72–3.90 (8H, m), 4.01–4.15 (4H, m), 6.66 (2H, s), 7.18 (1H, d, J = 7.6 Hz), 7.37 (8H, d, J = 6.0 Hz), 7.68–7.82 (2H, m), 8.04 (1H, d, J = 7.6 Hz), 8.60 (8H, d, J = 6.0 Hz). 13C NMR (DMSO-d6, 125 MHz) δ 49.83, 57.34, 82.35, 111.25, 112.50, 116.77, 124.66, 125.77, 126.61, 127.32, 131.23, 136.49, 146.38, 148.58, 150.30, 151.74, 155.22, 168.81. HRMS (ESI) calcd for [M+H]+, 823.2197, found 823.2192.
9-(o-Carboxyphenol)-2,7-dichloro-4,5-bis(dibenzylaminomethyl)-6-hydroxy-3-xanthenone (DBA-DCF, 4)
A suspension of dibenzylamine (250 μL, 1.30 mmol) and paraformaldehyde (39.7 mg, 1.32 mmol) in 7 mL of MeCN was stirred at 80 °C for 30 min before adding a suspension of DCF (168 mg, 0.419 mmol) in 12 mL of 1:1 MeCN:H2O. The reaction mixture was stirred at 80 °C for 48 h, cooled to room temperature, and the resulting precipitate was filtered and washed with 1:1 MeCN:H2O. The solid was mixed with boiling EtOH, cooled, filtered, and washed with Et2O and hexanes, yielding 282 mg (82 %) of a pink powder. mp = 242 °C (dec); 1H NMR (CD2Cl2, 400 MHz) δ 3.70–3.83 (8H, m), 3.95–4.05 (4H, m), 6.63 (2H, s), 7.15 (1H, d, J = 7.6 Hz), 7.31–7.45 (20H, m), 7.68–7.74 (2H, m), 8.06 (1H, d, J = 7.6 Hz). HRMS (ESI) calcd for [M+H]+, 819.2387; found, 819.2369.
9-(o-Carboxyphenol)-2,7-dichloro-4,5-Bis{Di[2-ethyl(2-Methyl-isoindole-1,3-dione)]aminomethyl}-6-hydroxy-3-xanthenone (12)
A suspension of 11 (280 mg, 0.771 mmol) and paraformaldehyde (25 mg, 0.83 mmol) in 12 mL of 1:1 DMF:MeCN was stirred at 70 °C for 20 min, forming a homogeneous solution. A suspension of DCF (100 mg, 0.249 mmol) in 8 mL of MeCN was added and the mixture was stirred at 70 °C for 48 h. After cooling to room temperature, the resulting solid was filtered and washed thoroughly with MeCN, Et2O, and pentane, yielding 154 mg of pink powder (54 %). 1H NMR (DMSO-d6, 400 MHz) δ 2.94–3.06 (8H, m), 3.73–3.83 (8H, m), 4.22 (4H, s), 6.40 (2H, s), 7.32 (1H, d, J = 8.0 Hz), 7.53–7.60 (1H, m), 7.62–7.74 (16H, m), 7.88 (1H, t, J = 8.0 Hz), 7.96 (1H, d, J = 7.6 Hz).
9-(o-Carboxyphenol)-2,7-dichloro-4,5-Bis[di(2-aminoethyl)aminomethyl]-6-hydroxy-3-xanthenone (DETA-DCF, 5)
Hydrazine monohydrate (0.50 mL, 10 mmol) was added to a suspension of 12 (60 mg, 52 μmol) in 10 mL of EtOH, changing the color to bright pink. The mixture was heated at 80 °C for 4 h, cooled to room temperature, filtered, and washed with MeCN, Et2O, and pentane. The solid was mixed with MeOH for 1 h before filtering and dissolution in MeOH with a minimal amount of concentrated HCl. The solvent was removed and the solid was thoroughly washed with MeOH, yielding 32 mg (96 %) of a glassy orange solid. 1H NMR (D2O, 400 MHz) δ 2.92 (8H, t, J = 6.2 Hz), 3.10 (8H, t, J = 6.2 Hz), 3.98 (4H, s), 7.17–7.22 (3H, m), 7.61–7.72 (2H, m), 8.12 (1H, d, J = 8.0 Hz). HRMS (ESI) calcd for [M+H]+, 631.2197; found, 631.2185.
9-(o-Carboxyphenyl)-2,7-dichloro-4,5-bis(diethylaminomethyl)-6-hydroxy-3-xanthenone (DEA-DCF, 6)
A solution of diethylamine (125 mg, 1.71 mmol) and paraformaldehyde (47.3 mg, 1.58 mmol) in 8 mL of MeCN was stirred at 60 °C for 30 min before adding a suspension of DCF (160 mg, 0.398 mmol) in 15 mL of MeCN. After stirring overnight at 60 °C, the mixture was allowed to cool to room temperature and filtered. The resulting pink powder was washed with MeCN, Et2O, and pentane, yielding 118 mg (52 %) of pure product. X-ray diffraction-quality crystals were obtained by diffusion of Et2O into a CH2Cl2 solution. mp = 230 °C (dec); 1H NMR (CD2Cl2, 400 MHz) δ 1.22 (12H, t, J = 7.2 Hz), 2.74–2.86 (8H, m), 4.06–4.20 (4H, m), 6.62 (2H, s), 7.32 (1H, d, J = 7.6 Hz), 7.67–7.81 (2H, m), 8.01 (1H, d, J = 7.6 Hz). 13C NMR (DMSO-d6, 125 MHz) δ 10.91, 46.99, 50.50, 83.21, 109.39, 109.69, 116.97, 124.22, 125.29, 127.19, 127.35, 130.28, 135.36, 148.23, 151.72, 157.65, 168.84. HRMS (ESI) calcd for [M+H]+, 571.1761; found, 571.1762.
2-[(Di{2-pyridylmethyl}amino)methyl]-6-chloro-4-nitro-phenol, 10
A suspension of 7 (235 mg, 1.18 mmol) and paraformaldehyde (36 mg, 1.2 mmol) in 10 mL of MeCN was stirred at 75 °C for 20 min before adding a solution of 2-chloro-4-nitrophenol (179 mg, 1.03 mmol) in 8 mL of MeCN. Heating was continued overnight, followed by removal of the solvent. Purification by flash chromatography on silica (30:1 CH2Cl2:MeOH) yielded 165 mg (43 %) of a bright yellow glassy solid. 1H NMR (D2O, 400 MHz) δ 3.87 (2H, s), 3.91 (4H, s), 7.17–7.23 (2H, m), 7.27 (2H, d, J = 8.0 Hz), 7.63–7.68 (2H, m), 7.95 (1H, d, J = 2.8 Hz), 8.19 (1H, d, J = 2.8 Hz), 8.55 (2H, d, J = 4.8 Hz). 13C NMR (MeOD, 125 MHz) δ 56.06, 58.55, 122.89, 123.44, 124.84, 124.86, 125.10, 137.79, 148.10, 157.33. HRMS (ESI) calcd for [M+H]+, 385.1062; found 385.1052.
Results and Discussion
Syntheses
In order to investigate the role of various heteroatoms in zinc-binding receptors used to image mobile Zn2+ by fluorescence, we prepared analogs of ZP1 (1, Chart 1) as the most attractive targets for study. The synthesis from commercially available DCF is more straightforward than that required for non-chlorinated analogs such as ZP2.34 The route to fluorophores 2–6 (Chart 1) employs standard Mannich-like reaction conditions and affords symmetric probes. Extra steps to protect then deprotect the primary amine groups of DETA were required to prepare 6 (Scheme 1). Previous protocols employed H2O and MeCN solvent mixtures, but in most cases MeCN alone provides better results and in some cases diffraction quality crystals grow by slow evaporation of the solvent from the reaction solution.
Scheme 1.
Synthesis of fluorophore 6
The secondary amine precursors to 2 and 3 were prepared by following a procedure for a similar compound,54 although the yields were unexpectedly low, there being at least one other major, unidentified product in each case. Diethylamine is commercially available and the target DEA-DCF was synthesized in adequate yield (52 %) and excellent purity. Dibenzylamine is also commercially available but it and the corresponding fluorophore 4 have rather poor solubility at and below pH 7, making potentiometric titrations impractical and preventing complete characterization. Intermediate 12 also suffered from poor solubility, as did final compound 6.
Spectroscopic Properties
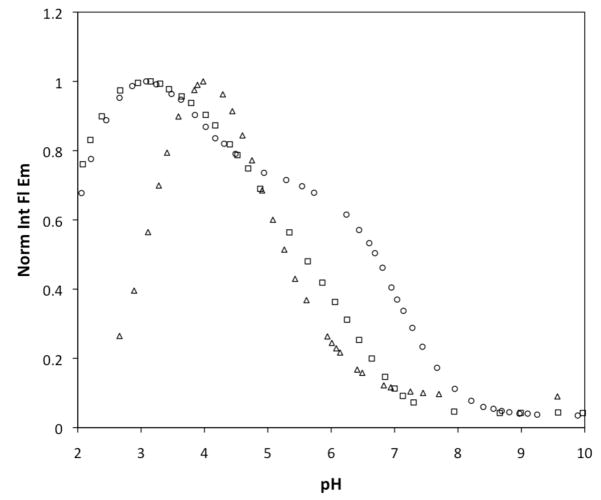
Pertinent spectroscopic properties of compounds 1–6 are summarized in Table 1. Unless otherwise noted, all measurements were performed at pH 7. Each of these compounds absorbs strongly in the visible range, with λmax between 504 and 519 nm and a spectrum characteristic of fluorescein derivatives. All of the compounds display fluorescent turn-on in response to protons and a fluorescence-based pKa value was determined for each (Figures 2 and S1, Supporting Information), with 1 displaying a two-step turn-on. The latter observation is inconsistent with our previously reported titration curve for 1,34 but is believed to be correct for several reasons. The new curve was constructed from a set of titrations with many more data points than previous ones, yielding more detail. Additionally, this curve matches quite well those for ZP1(5-CO2H) and ZP1(6-CO2H),42 as expected since addition of a carboxyl group to the “bottom ring” should not have a significant effect on the basicity of the binding pockets. Finally, the new titration curve agrees with expectations from the speciation model derived from potentiometric titrations (vide infra).
Table 1.
Spectroscopic Properties of Fluorophores 1–6
| Absorbance maximum (nm) | Extinction Coefficient, ε (M−1cm−1) | Emission maximum (nm) | Fluorescence pKa | Quantum Yield, Φa (pH 7.0) | Quantum Yield, Φa (0.1 M NaOH) | |
|---|---|---|---|---|---|---|
| 6 | 504 | 100,400 | 521 | 10.2 | 0.86 | 0.009 |
| 5 | 509 | 61,900 | 526 | 9.6 | 0.095 | --b |
| 4 | 510 | --b | 527 | 8.6 | 0.65 | 0.006 |
| 1c | 515 | 79,500d | 528 | 7.0, 4.0 | 0.17 | 0.009 |
| 2 | 516 | 68,000 | 531 | 5.6 | 0.034 | 0.012 |
| 3 | 519 | 90,100 | 543 | 5.0 | 0.024 | 0.019 |
Figure 2.
Normalized and integrated fluorescence emission of compounds 1 (circles), 2 (squares), and 3 (triangles) over the pH range 2–10. Each solution contains 1.0 μM of the fluorophore and 100 mM KCl as the electrolyte. The fluorescence “turns on” as the pH is lowered due to protonation of the quenching units. The decrease in fluorescence at the lower end of the pH scale is caused by formation of the non-fluorescent lactone isomer.
Under basic conditions (0.1 M NaOH), 1 and 6 have the same low quantum yield (Φ) of 0.009. Since the electron-donating ethyl groups of DEA make its nitrogen atom a strong electron donor, significant quenching is expected according to the Rehm-Weller model of PET.28 Electron donation from the DPA tertiary nitrogen atom is expected to be weaker due to the proximity of the electron-withdrawing pyridyl groups. Since these two compounds exhibit the same Φ value, it would appear that all four pyridyl groups of 1 contribute to its quenching, a conclusion supported by the potentiometry results below. The low F value for DBA-DCF in basic solution also suggests that its phenyl units play a role in the quenching process. It seems more likely, however, that the greater hydrophobicity of the aromatic rings in this latter compound promotes π-stacking interactions that disrupt the fluorescence.56
Although there are only three compounds to compare, there is a noticeable trend in Φ values for the pyridyl-based sensors in basic solution. The quantum yield is lowest for 1, which has four 2-pyridyl groups, and highest for 3, which has four 4-pyridyl groups. The value for 2, with an equal mixture of substitution positions, is intermediate. This trend suggests that the pendant pyridyl arms participate in fluorescence quenching. Further evidence of such pyridyl-based quenching is presented below in the section discussing potentiometric results.
Potentiometric Titrations
Model Compounds
Since 1–6 are relatively complex molecules, each having two identical Zn2+ binding sites and many potential protonation sites, we began this part of our study by analyzing the properties of a simpler set of compounds. Potentiometric titrations were performed on the three parent DPA ligands, 7–9 (Chart 1 and Figure 3), and the derived pKa values are reported in Table 2. We were unable to assign a value to pKa1 for 7 under our experimental conditions, so values from a previous study57 are listed.
Figure 3.
Potentiometric titration curves of DPA ligands 7 (circles), 8 (squares), and 9 (triangles) in aqueous solution containing 100 mM KCl at 25 °C. At the beginning of the titration, each solution contained 1.0 mM of the neutral molecule with three equivalents of added HCl. The abscissa reports equivalents of base added per mole of ligand. The solid lines overlying the data points represent model curves from calculated pKa values.
Table 2.
Proton and Zinc Dissociation Constants for Compounds 7–10
| Compound | pKa3 | pKa2 | pKa1 | Kd |
|---|---|---|---|---|
| 7a | 7.27 | 2.41 | 1.75 | 160 nM |
| 8 | 6.79 (7) | 4.099 (4) | 2.20 (1) | -- |
| 9 | 6.47 (1) | 4.530 (9) | 3.415 (4) | -- |
| 10 | 7.99 (3) | 4.61 (5) | 2.87 (15) | 0.29 (9) pM |
Values from ref. 57. Numbers in parentheses represent standard deviations in the last significant digit.
For the DPA ligands, pKa3 shifts to lower values as the pyridyl nitrogen atoms are directed away from the central amine nitrogen atom. This trend indicates that, although the first proton is expected to bind to the electron-rich central nitrogen atom, the 2-pyridyl groups participate as hydrogen bonding acceptors for that proton. Since 4-pyridyl groups cannot contribute in this manner, the associated pKa values are shifted higher, toward the value for free pyridine (pKa = 5.17),58 but do not reach that value because of the nearby positive charge from the protonated central nitrogen atom.
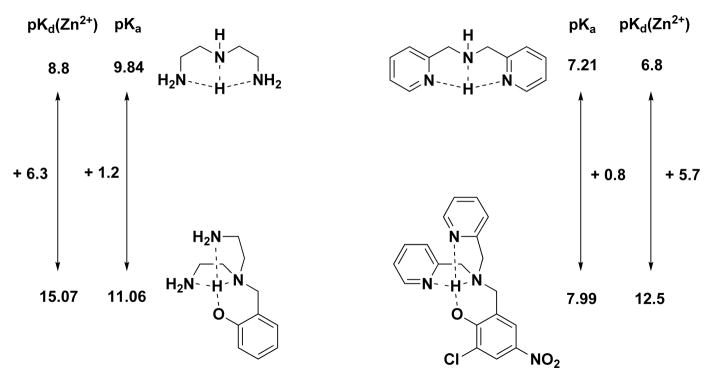
Before attempting an analysis of 1 by potentiometry, we also synthesized and studied model compound 10 (Chart 1 and Table 2). Its para-nitro substituent enhances the acidity of the phenol group and the pKa3 value is 7.99, making this compound a reasonable mimic for one of the binding pockets in 1. The 0.29 pM Kd value for Zn2+ calculated from potentiometric titrations of a 1:1 metal:ligand mixture seems unusually high until one considers related compounds from the literature (Figure 4). Diethylene-triamine has a Kd value for Zn2+ of 1.6 nM,59 and addition of a pendant phenolic group to the central nitrogen atom increases that affinity by several orders of magnitude (Kd = 0.85 fM), despite only a modest increase in basicity.60 Since the dissociation constant of Zn2+ for DPA is 160 nM,57 the affinity for phenol-appended model 10 should be much higher, as observed.
Figure 4.
Comparison of dissociation constants for dien and 7 and the effects of adding a methylene-tethered phenolate appendage. A small increase in proton affinity portends a large increase in zinc affinity. Values from refs. 57, 59, 60 and this work.
Sensors
Representative titration data and the corresponding model curves for 1–3 are shown in Figure 5, and the calculated pKa values are reported in Table 3. Limited solubility affected our ability to model the lowest two dissociation constants for 1–3 since the calculated Ka values are on the same order as the concentrations used in the titrations.46 In such cases, the relevant dissociation constants have questionable physical validity, but the quality of the fit to the titration data is improved, especially in the low pH range, by their inclusion. Like the structurally similar compound TPEN, which can support a +4 charge from protonation at pH ~ 3 (pKa1 = 2.85),61 larger, dianionic 1 can accommodate six protons to achieve the same charge at a similar pH. Separate models containing from four to seven protonation events were evaluated and the best fit was obtained for the six-proton model. Although a mixed solvent system utilizing MeOH or DMSO together with water would probably have increased the solubility of these compounds, we chose to maintain purely aqueous conditions so that the results from these titrations could be directly related to those from spectroscopic measurements of these and related compounds. Fortunately, the most important fluorescence behavior occurs at higher pH values and the overall analysis is not affected by uncertainty in the lowest two pKa values. The solubilities of 4 and 5 were insufficient over the desired pH range to perform a meaningful analysis. The dissociation constants of 6 are expected to be higher than that of diethylamine (pKa = 10.93)58 and were outside of the range of measurement under our conditions.
Figure 5.
Potentiometric titration curves of fluorophores 1 (circles), 2 (squares), and 3 (triangles) in aqueous solution containing 100 mM KCl at 25 °C. Each trial started with 0.6–1.0 mM of the neutral molecule, dissolved in excess HCl. The abscissa is measured in equivalents of base added per mole of ligand. The solid lines overlying the data points represent model curves from calculated pKa values.
Table 3.
Proton and Zinc Dissociation Constants for Fluorophores 1–3
| −logKa |
|||||
|---|---|---|---|---|---|
| Equation | 1 | 2 | 3 | ||
|
|
pKa6 | 8.12 (2) | 7.473 (5) | 7.04 (1) | |
|
|
pKa5 | 6.96 (1) | 6.35 (1) | 6.06 (1) | |
|
|
p Ka4 | 4.59 (3) | 5.205 (8) | 5.261 (9) | |
|
|
pKa3 | 3.810 (9) | 4.51 (2) | 4.57 (3) | |
|
|
pKa2 | 2.8 (3) | 3.10 (3) | 3.47 (2) | |
|
|
pKa1 | 2.3 (2) | 2.67 (5) | 2.99 (2) | |
|
|
13.4 (3) | ||||
|
|
6.57 (7) | ||||
|
|
4.02 (4) | ||||
|
|
3.19 (9) | ||||
|
|
8.9 (3) | ||||
K represents the dissociative equilibrium constant for the equations displayed on the left, corresponding to the loss of either a proton or zinc ion from the ligand (L) or ligand complex. No zinc-binding data are available for 2 or 3 due to precipitation of free Zn2+ during these experiments. Numbers in parentheses represent standard deviations in the last significant digit.
Two opposing trends emerge from the results in Table 3. The two highest pKa values decrease as 4-pyridyl groups substitute for 2-pyridyl groups. The trend reverses for pKa4 through pKa1, with the values increasing as more pyridyl groups are substituted in the 4-position. The reason for these trends becomes clear with the assignment of the dissociation constants to specific protonation sites (vide infra).
Crystallographic Insights
As with the parent ligand arms, 7–9, the pyridyl groups of 1–3 are also expected to help stabilize protons in the two binding pockets, with an additional contribution from the phenolic oxygen atoms. The crystal structures of 1, 2, and 6 (Figure 6) clearly reveal protons, located from difference electron density maps, bound to the phenolic oxygen atoms of both pockets. For 1 and 6, these protons are within reasonable hydrogen bonding distance (Table 4) of the tertiary nitrogen atoms. Additionally, each binding pocket of 1 has one pyridyl nitrogen atom in reasonably close contact with the bound proton, lending support to the idea that all of the atoms in the N3O binding group help to stabilize protons in the pockets. The other two pyridyl arms of 1 interact with one another through a bridging water molecule in the crystal structure. In solution, the equivalent pyridyl arms would contribute equally, although modestly, to proton stabilization. Two different conformations were found in the asymmetric unit of the crystal lattice of 2, with an intermolecular interaction reducing the number of hydrogen bonds within the binding pockets (Figure S2). Any such intermolecular bonding feature is expected to be minimal in solution, however, where in-pocket bonding should dominate. A summary of crystallographic parameters for 1, 2, and 6 is given in Table S1.
Figure 6.
ORTEP diagrams showing 50% probability thermal ellipsoids on all non-hydrogen atoms. Short hydrogen bond contacts are shown as dotted lines.
Table 4.
Summary of Distances (Å) between Hydrogen Bond Donor and Acceptor Atoms in the X-ray Crystal Structures of 1, 2, and 6.
| Bond Lengthsa | Å | |
|---|---|---|
| Compound 1 | O1–H1…N1 | 3.0036(19) |
| O1–H1…N2 | 2.935(2) | |
| O3–H3…N4 | 2.712(2) | |
| O3–H3…N5 | 3.385(2) | |
| O6–H6…N3 | 2.938(3) | |
| O6–H7…N6 | 2.931(3) | |
| Compound 2 | O1–H1…N1 | 3.118(3) |
| O1–H1…N2 | 2.648(3) | |
| O3–H3…N4 | 2.624(3) | |
| O3–H3…N5 | 3.414(3) | |
| Compound 6 | O1–H1…N1 | 2.580(3) |
| O3–H3…N2 | 2.644(2) |
Atoms are labeled as indicated in Figure 6.
Determination of Protonation Sites
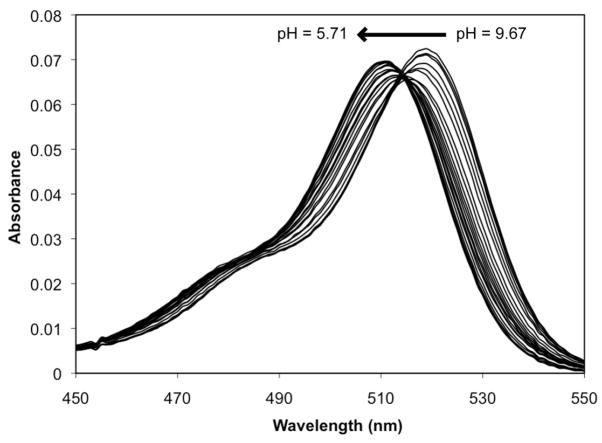
Protons occupying the binding pockets draw electron density from the phenolic oxygen atoms, reducing conjugation through the xanthenone π-system. This electronic effect is exhibited as a small (ca. 10 nm) shift in the optical spectrum as the pH is lowered. For 1, this hypsochromic shift occurs over the pH range bracketing the two highest pKa values (Figure 7), reinforcing the conclusions that the two phenolic oxygen atoms are involved in proton binding and that the tertiary nitrogen atoms are not the sole sites of protonation. The same spectral shift occurs for 2 (Figure S3) but not for 3 (Figure S4), the least basic of the set. Since the unprotonated molecule is completely symmetrical, the highest pKa value represents a statistical combination of two equally basic sites. A single binding pocket would be expected to have a pKa value approximately 0.3 units lower.62 Once the first proton is bound, however, electronic communication through the xanthenone system lowers the basicity of the other pocket, contributing to the separation between these two acid dissociation constants.
Figure 7.
Absorbance spectra of a 1.0 μM solution of 1 containing 100 mM KCl over the pH range 9.67-5.71. An overall hypsochromic shift (519 nm to 511 nm) occurs as the pH is lowered due to protonation of the binding pockets, resulting in reduced conjugation through the π-system of the xanthenone group.
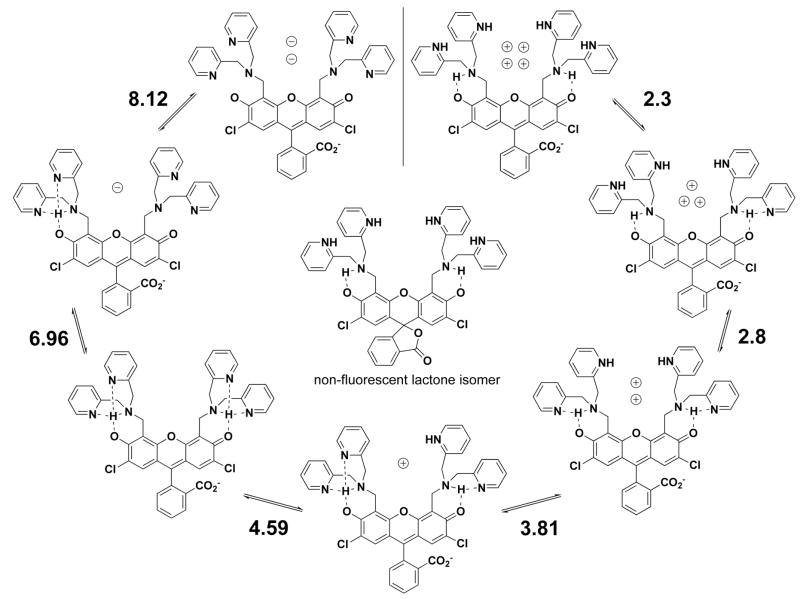
The third proton binds to any one of the four equivalent pyridyl groups. The pKa value associated with this event, despite being increased by a statistical factor, is lower than that for free pyridine owing to the weak interaction with the proton already present in the binding pocket. The next three protonation sites are assigned to the remaining pyridyl groups, with gradually decreasing pKa values due to the build up of positive charge in the vicinity of the binding pockets.
Another potential protonation site that was considered is the carboxylate group on the “bottom ring” of 1, which has been discussed for both anionic and neutral forms of fluorescein.63 In the pH range covering the lowest two pKa values, however, there is a simultaneous decrease in the absorbance and emission intensities (Figure S5). This observation suggests that the unprotonated carboxylate group has closed to form the lactone isomer, which neither absorbs in the same spectral range as the ring-open form nor fluoresces. Ab initio calculations have revealed such a preference for the lactone isomer over the quinoid, carboxylate-protonated form.64 Although some amount of solvation energy is lost with lactone formation, the negative charge on the free carboxylate group gets redistributed to the phenolic oxygen atoms, where positive charge has accumulated due to nitrogen atom protonation. At any rate, the absorption and emission bands are only diminished, not extinguished, such that an equilibrium exists between the ring-open and -closed forms.
Combining the various results and observations from crystallography, spectroscopy and potentiometry, we have been able to construct a fairly detailed picture of the protonation states of 1 over a wide pH range (Scheme 2). The number of potential protonation sites, along with the narrow spread of dissociation constants, makes a definitive assignment of all the microstates in this system difficult but we find this model to represent the data reasonably well.
Scheme 2.
Protonation equilibria of ZP1 (1). The number adjacent to each set of equilibria arrows represents the corresponding pKa value. Charges within the binding pockets have been omitted for clarity.
Correlation of Fluorescence Behavior with Proton Equilibria
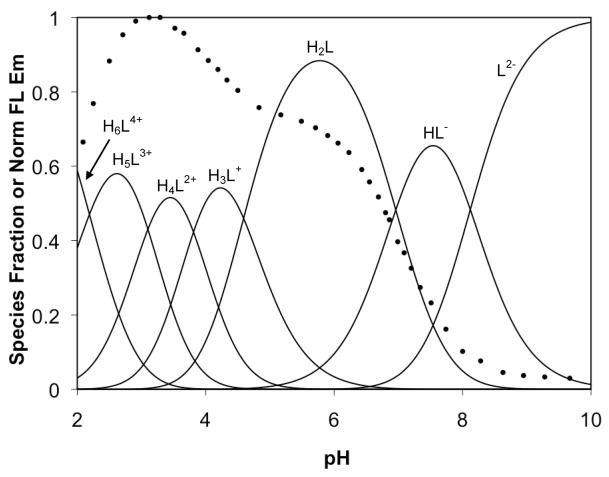
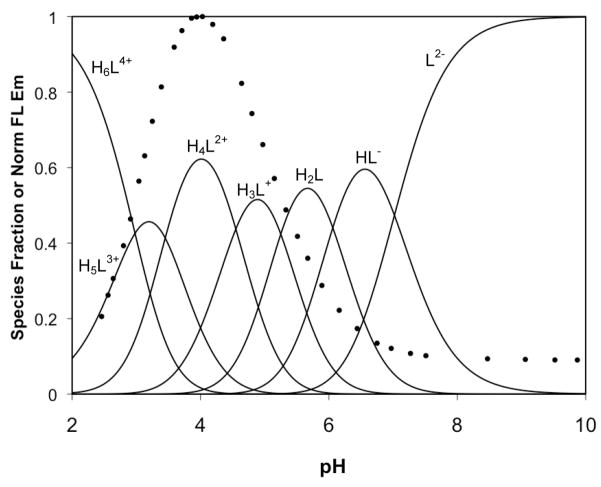
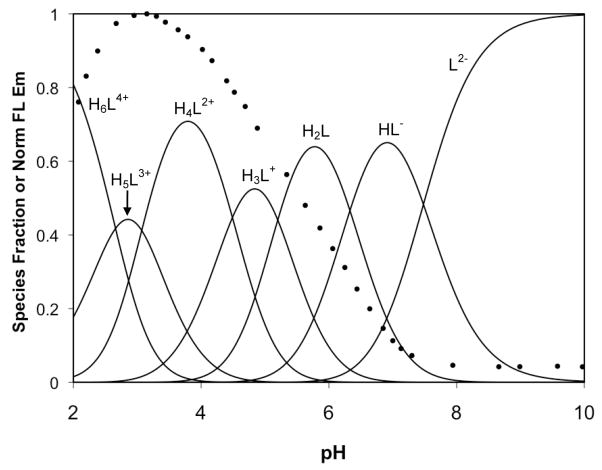
Using the calculated pKa values for 1–3, speciation plots were constructed and overlaid with the fluorescence pH titration curves for each compound (Figures 8–10). For 1, the initial fluorescence increase occurs upon binding of the second proton, corresponding to occupancy of both binding pockets. A second, smaller increase occurs during the binding of two additional protons. Since the binding sites for these two protons are assigned as pyridyl groups, we conclude that the pyridyl arms of DPA are not innocent bystanders in the quenching mechanism of these compounds. In fact, the main “turn-on” for 3 does not occur concurrently with formation of the diprotonated species, which is expected to have both tertiary nitrogen atoms bound to protons. Instead, the fluorescence of 3 begins to increase significantly only when the third and fourth protons bind to pyridyl groups. At lower pH values, the absorbance spectra of 3 diminish along with the emission spectra (not shown), suggesting formation of the lactone isomer. If not for this isomerization, protonation of the remaining pyridyl groups might allow for an even greater increase in fluorescence emission. The same pattern is evident for 2, but with approximately equivalent turn-on contributions from protonation of the binding pockets and the subsequent pyridyl protonation.
Figure 8.
Fluorescence pH titration data (circles) for 1 overlaid on a speciation plot created from calculated acid dissociation constants.
Figure 10.
Fluorescence pH titration data (circles) for 3 overlaid on a speciation plot created from calculated acid dissociation constants.
Our results indicate a clear trend between the protonation state of the pyridyl arms of these fluorophores and their fluorescence response, but the mechanism for this behavior remains to be determined. Although a pyridinium group can act as an electron acceptor, quenching the emission of an attached fluorophore,9,29,35 we know of no previous examples of a free pyridyl group acting as a quenching unit in a PET-based sensor and it is unlikely that PET is the underlying cause for this secondary turn-on behavior. There are examples of fluorophores that are quenched through a process involving hydrogen bond formation with pyridine,65,66 and such bonds exist in the diprotonated forms of 1 and 2. No intramolecular pyridyl-to-fluorophore hydrogen bonds are possible in 3, however, so this mechanism for quenching from the pyridyl units can be dismissed. An analysis based on the Rehm-Weller formalism28 and the utilization of electrochemistry, transient absorption spectroscopy, and computational methods may help explain this pyridyl-based quenching behavior, topics for future investigations.
Zinc Coordination
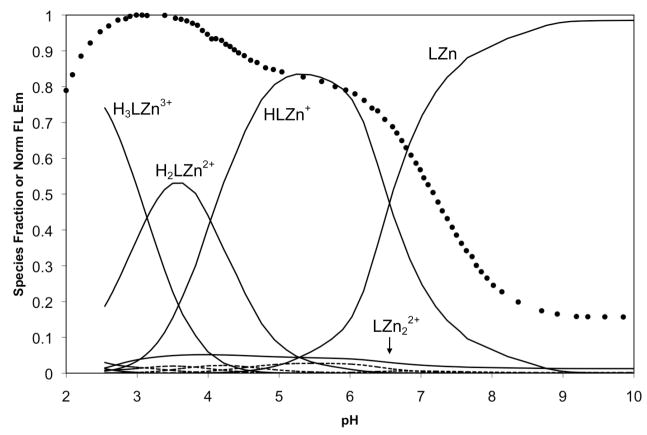
With the pKa values for 1 in hand, further titrations were performed in the presence of ZnCl2 in order to determine the relevant dissociation constants. The solubility of these mixtures was insufficient to complete all of the desired titrations, and solutions containing greater than a 1:1 metal-to-ligand ratio became cloudy over the course of the experiment, rendering the experimental results unsuitable for analysis. Therefore, we were limited to experiments containing 1 equivalent of ZnCl2 and data from these trials were used to determine Kd1 and to approximate Kd2 (Figure S6). In addition to protonated and zinc-bound species, the mixed species (HLZn)+, (H2LZn)2+, and (H3LZn)3+ were included in our computer model. A complete set of −logK values from our calculations for 1 are reported in Table 3. Very tight binding values are difficult to model accurately by potentiometry, but the consistency between multiple data sets, as reflected in the small standard deviation values, give us confidence in the reported binding constants. From these values, a speciation plot was constructed for 1 in the presence of 1 equivalent of Zn2+ over the pH range 2–10 (Figure 11). A titration using the same 1:1 metal-to-ligand ratio was also monitored by fluorescence, and the normalized, integrated emission curve was overlaid on the speciation plot. The result is similar to the proton-only system; that is, significant fluorescence turn-on does not occur until species are formed having both binding pockets occupied. The species LZn has one unoccupied pocket, which causes significant fluorescence quenching and the primary turn-on only occurs with formation of the mixed species (HLZn)+ as the pH is lowered. The small amount of dizinc complex that forms under this model leads us to report the second dissociation constant as only an estimated value. A secondary turn-on at low pH occurs with the formation of the pyridyl-protonated species (H2LZn)2+ and (H3LZn)3+.
Figure 11.
Fluorescence pH titration data (circles) for a 1:1 mixture of 1 and ZnCl2 overlaid on a speciation plot created from the calculated proton and Zn2+ dissociation constants. The species containing zinc are represented with solid lines and those without zinc are represented with dashed lines. Labels for the minor species are omitted for clarity.
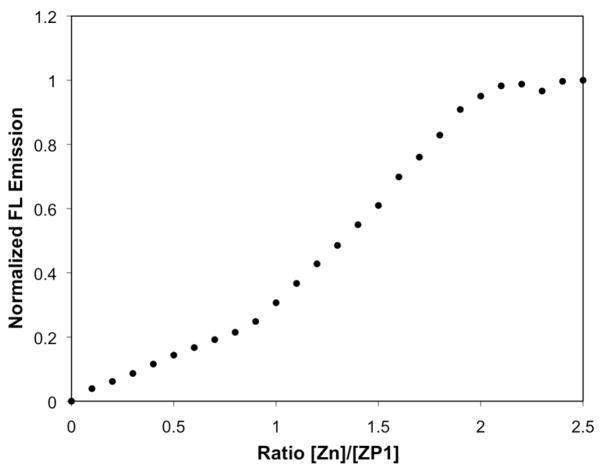
The previously determined Zn2+ affinity of 1,34 measured by fluorescence titration (Kd = 0.7 nM), more closely matches the binding affinity for a second Zn2+ ion determined in this study. The fluorescence-based affinity value was obtained by titrating 1 with zinc in a dual-buffer system to control levels of the “free” ion. Although appropriate for ligands with very high affinities, this approach did not allow for determination of the binding stoichiometry. In order to distinguish the degree of fluorescence turn-on induced by the binding of one versus two zinc ions, a solution of the sensor was titrated with small aliquots of ZnCl2 (Figure 12). There is an initial, small turn-on in the range of 0–1 equivalents of Zn2+, caused by partial alleviation of quenching as one binding pocket is occupied, leaving the other receptor pocket to continue to act as an electron donor. The increase in fluorescence becomes significantly greater upon addition of 1–2 equivalents of Zn2+ since the zinc affinities for both pockets are very strong and all of the donor groups are occupied, such that quenching influences have been removed.
Figure 12.
Integrated emission response of 0.3 μM 1 at pH 7.0 to increasing amounts of ZnCl2. Binding of the first equivalent of zinc to the sensor does not cause as significant a turn-on as binding the second equivalent.
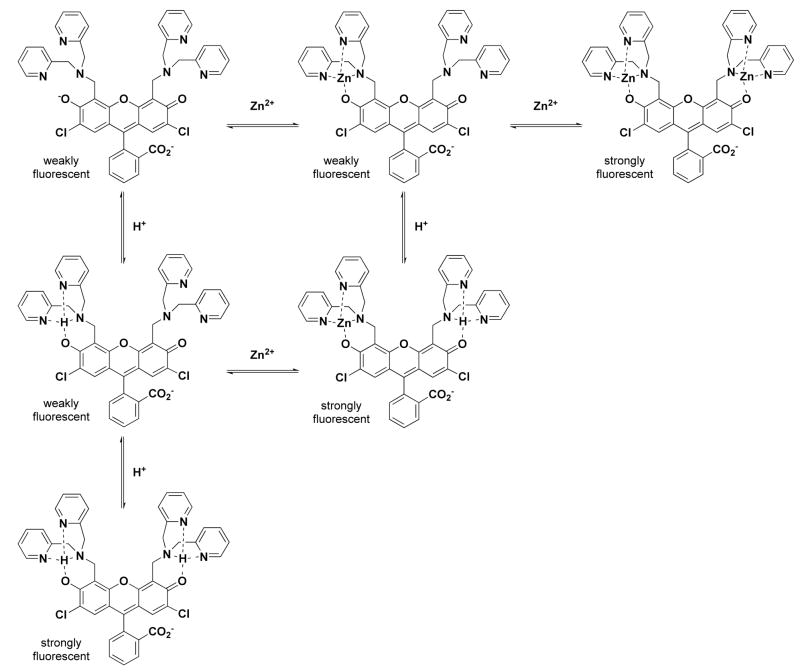
These observations, taken together, lead to the conclusion that, in order for full fluorescence turn-on to occur, protons and/or Zn2+ ions must occupy both binding pockets of 1 (Figure 13). This result is consistent with other reports involving PET-based sensors having two separate quenching/binding arms.7,32,67 Potentiometric titrations of 2 and 3 in the presence of ZnCl2 resulted in the precipitation of unbound zinc at high pH values, suggesting that the metal affinities of these compounds are much lower than those of 1.
Figure 13.
Chemical equilibria illustrating the stepwise formation of protonated and zinc-bound complexes of 1. Significant fluorescence turn-on does not occur until both binding pockets are occupied. Charges are omitted for simplicity.
Summary and Conclusions
We have synthesized a series of Zinpyr-1 (1) analogs, 2–6, based on the parent fluorophore 2′,7′-dichlorofluorescein. From a combination of spectrophotometric and potentiometric titrations, as well as X-ray crystallography, a detailed molecular picture of the binding states and fluorescence properties of 1 has emerged. Previous conclusions based purely on fluorometric measurements were revised. We report the direct correlation between the fluorescence emission of these compounds and their proton and zinc equilibria over a wide pH range. The first zinc affinity is much higher than previously thought (Kd = 0.04 pM) because fluorescence-binding titrations actually reveal the affinity for a second zinc ion. The second binding constant determined in this report (Kd = 1.2 nM) is only an estimate due to limitations in solubility but it matches well the value determined by fluorescence (Kd = 0.7 nM).
Additionally, we present evidence of separate quenching contributions from the tertiary nitrogen atoms and the pyridyl groups of the DPA receptors in 1 and its isomers 2 and 3. The contribution from the pyridyl groups is of a type not previously reported in PET-based sensors, despite the number of compounds that contain 2,2-DPA as the receptor unit. PET-based quenching by pyridyl groups is unlikely on energetic grounds, and detailed theoretical analyses are required to identify the fluorescence quenching mechanism. Our results again demonstrate the power of potentiometric titrations when used in conjunction with fluorescence spectroscopy to reveal details of the quenching/unquenching mechanisms of complex fluorescent sensors used widely in biological chemistry.68
Supplementary Material
Figure 9.
Fluorescence pH titration data (circles) for 2 overlaid on a speciation plot created from calculated acid dissociation constants.
Acknowledgments
This work was supported by a grant from the National Institute of General Medical Sciences, GM66619 (to SJL). Spectroscopic instrumentation at the MIT DCIF is maintained with funding from NIH grant number 1S10RR13886-01.
Footnotes
Supporting Information Available. Figures S1–S6 depict fluorescence pH titrations for 4–6, the ORTEP diagram of both independent molecules in the asymmetric unit of 2, absorption pH titration spectra of 2 and 3, the absorption and fluorescence spectra of 1 at low pH values, and the potentiometric titration curves for 1 in the presence and absence of ZnCl2. Table S1 lists the crystallographic parameters for 1, 2, and 6 and CIF files are available. This material is available free of charge via the Internet at http://pubs.acs.org.
References
- 1.Prodi L, Bolletta F, Montalti M, Zaccheroni N. Coord Chem Rev. 2000;205:59–83. [Google Scholar]
- 2.Kikuchi K, Komatsu K, Nagano T. Curr Opin Chem Biol. 2004;8:182–191. doi: 10.1016/j.cbpa.2004.02.007. [DOI] [PubMed] [Google Scholar]
- 3.Callan JF, de Silva AP, Magri DC. Tetrahedron. 2005;61:8551–8588. [Google Scholar]
- 4.Que EL, Domaille DW, Chang CJ. Chem Rev. 2008;108:1517–1549. doi: 10.1021/cr078203u. [DOI] [PubMed] [Google Scholar]
- 5.Nolan EM, Lippard SJ. Chem Rev. 2008;108:3443–3480. doi: 10.1021/cr068000q. [DOI] [PubMed] [Google Scholar]
- 6.Valeur B, Leray I. Coord Chem Rev. 2000;205:3–40. [Google Scholar]
- 7.Geue JP, Head NJ, Ward AD, Lincoln SF. Dalton Trans. 2003:521–526. [Google Scholar]
- 8.de Silva AP, Rupasinghe RADD. J Chem Soc Chem Comm. 1985:1669–1970. [Google Scholar]
- 9.de Silva SA, Zavaleta A, Baron DE, Allam O, Isidor EV, Kashimura N, Percarpio JM. Tetrahedron Lett. 1997;38:2237–2240. [Google Scholar]
- 10.Fahrni CJ, Yang L, VanDerveer DG. J Am Chem Soc. 2003;125:3799–3812. doi: 10.1021/ja028266o. [DOI] [PubMed] [Google Scholar]
- 11.Martínez-Máñez R, Sancenón F. Chem Rev. 2003;103:4419–4476. doi: 10.1021/cr010421e. [DOI] [PubMed] [Google Scholar]
- 12.Bai Y, Zhang BG, Xu J, Duan CY, Dang DB, Liu DJ, Meng QJ. New J Chem. 2005;29:777–779. [Google Scholar]
- 13.Lee HN, Swamy KMK, Kim SK, Kwon JY, Kim Y, Kim SJ, Yoon YJ, Yoon J. Org Lett. 2007;9:243–246. doi: 10.1021/ol062685z. [DOI] [PubMed] [Google Scholar]
- 14.Lim NC, Freake HC, Brückner C. Chem Eur J. 2005;11:38–49. doi: 10.1002/chem.200400599. [DOI] [PubMed] [Google Scholar]
- 15.Domaille DW, Que EL, Chang CJ. Nature Chem Biol. 2008;4:168–175. doi: 10.1038/nchembio.69. [DOI] [PubMed] [Google Scholar]
- 16.Palmer AE, Tsien RY. Nat Prot. 2006;1:1057–1065. doi: 10.1038/nprot.2006.172. [DOI] [PubMed] [Google Scholar]
- 17.McIsaac RJ. Endocrinology. 1955;57:571–579. doi: 10.1210/endo-57-5-571. [DOI] [PubMed] [Google Scholar]
- 18.Dunn MF. BioMetals. 2005;18:295–303. doi: 10.1007/s10534-005-3685-y. [DOI] [PubMed] [Google Scholar]
- 19.Giblin LJ, Chang CJ, Bentley AF, Frederickson C, Lippard SJ, Frederickson CJ. J Histochem Cytochem. 2006;54:311–316. doi: 10.1369/jhc.5A6724.2005. [DOI] [PubMed] [Google Scholar]
- 20.Faa G, Nurchi VM, Ravarino A, Fanni D, Nemolato S, Gerosa C, Van Eyken P, Geboes K. Coord Chem Rev. 2008;252:1257–1269. [Google Scholar]
- 21.Wu SM, Qiao X, Noebels JL, Yang XL. Vision Res. 1993;33:2611–2616. doi: 10.1016/0042-6989(93)90219-m. [DOI] [PubMed] [Google Scholar]
- 22.Redenti S, Ripps H, Chappell RL. Exp Eye Res. 2007;85:580–584. doi: 10.1016/j.exer.2007.07.017. [DOI] [PubMed] [Google Scholar]
- 23.Assaf SY, Chung SH. Nature. 1984;308:734–736. doi: 10.1038/308734a0. [DOI] [PubMed] [Google Scholar]
- 24.Vogt K, Mellor J, Tong G, Nicoll R. Neuron. 2000;26:187–196. doi: 10.1016/s0896-6273(00)81149-6. [DOI] [PubMed] [Google Scholar]
- 25.Galasso SL, Dyck RH. Mol Med. 2007;13:380–387. doi: 10.2119/2007-00044.Galasso. [DOI] [PMC free article] [PubMed] [Google Scholar]
- 26.Frederickson CJ, Koh JY, Bush AI. Nat Rev Neurosci. 2005;6:449–462. doi: 10.1038/nrn1671. [DOI] [PubMed] [Google Scholar]
- 27.Chanon M, Hawley MD, Fox MA. Photoinduced Electron Transfer. A Elsevier; Amsterdam: 1988. [Google Scholar]
- 28.Rehm D, Weller A. Israel Journal of Chemistry. 1970;8:259–271. [Google Scholar]
- 29.de Silva AP, Gunaratne HQN, Lynch PLM. J Chem Soc Perkin Trans 2. 1995:685–690. [Google Scholar]
- 30.Urano Y, Kamiya M, Kanda K, Ueno T, Hirose K, Nagano T. J Am Chem Soc. 2005;127:4888–4894. doi: 10.1021/ja043919h. [DOI] [PubMed] [Google Scholar]
- 31.Lim MH, Wong BA, Pitcock WH, Mokshagundam D, Baik MH, Lippard SJ. J Am Chem Soc. 2006;128:14364–14373. doi: 10.1021/ja064955e. [DOI] [PubMed] [Google Scholar]
- 32.Bissell RA, Calle E, de Silva AP, de Silva SA, Gunaratne HQN, Habib-Jiwan JL, Peiris SLA, Rupasinghe RADD, Samarasinghe TKSD, Sandanayake KRAS, Soumillion JP. J Chem Soc Perkin Trans 2. 1992:1559–1564. [Google Scholar]
- 33.Sparano BA, Shahi SP, Koide K. Org Lett. 2004;6:1947–1949. doi: 10.1021/ol049537y. [DOI] [PubMed] [Google Scholar]
- 34.Burdette SC, Walkup GK, Spingler B, Tsien RY, Lippard SJ. J Am Chem Soc. 2001;123:7831–7841. doi: 10.1021/ja010059l. [DOI] [PubMed] [Google Scholar]
- 35.de Silva AP, Gunaratne HQN, McCoy CP. Chem Commun. 1996:2399–2400. [Google Scholar]
- 36.Hirano T, Kikuchi K, Urano Y, Higuchi T, Nagano T. J Am Chem Soc. 2000;122:12399–12400. [Google Scholar]
- 37.Hirano T, Kikuchi K, Urano Y, Nagano T. J Am Chem Soc. 2002;124:6555–6562. doi: 10.1021/ja025567p. [DOI] [PubMed] [Google Scholar]
- 38.Walkup GK, Burdette SC, Lippard SJ, Tsien RY. J Am Chem Soc. 2000;122:5644–5645. doi: 10.1021/ja010059l. [DOI] [PubMed] [Google Scholar]
- 39.Nolan EM, Lippard SJ. Inorg Chem. 2004;43:8310–8317. doi: 10.1021/ic048778z. [DOI] [PubMed] [Google Scholar]
- 40.Nolan EM, Jaworski J, Okamoto KI, Hayashi Y, Sheng M, Lippard SJ. J Am Chem Soc. 2005;127:16812–16823. doi: 10.1021/ja052184t. [DOI] [PMC free article] [PubMed] [Google Scholar]
- 41.Nolan EM, Jaworski J, Racine ME, Sheng M, Lippard SJ. Inorg Chem. 2006;45:9748–9757. doi: 10.1021/ic061137e. [DOI] [PMC free article] [PubMed] [Google Scholar]
- 42.Woodroofe CC, Masalha R, Barnes KR, Frederickson CJ, Lippard SJ. Chem Biol. 2004;11:1659–1666. doi: 10.1016/j.chembiol.2004.09.013. [DOI] [PubMed] [Google Scholar]
- 43.Nolan EM, Ryu JW, Jaworski J, Feazell RP, Sheng M, Lippard SJ. J Am Chem Soc. 2006;128:15517–15528. doi: 10.1021/ja065759a. [DOI] [PMC free article] [PubMed] [Google Scholar]
- 44.Nolan EM, Lippard SJ. Acc Chem Res. 2009;42:193–203. doi: 10.1021/ar8001409. [DOI] [PMC free article] [PubMed] [Google Scholar]
- 45.Teramae S, Osako T, Nagatomo S, Kitagawa T, Fukuzumi S, Itoh S. J Inorg Biochem. 2004;98:746–757. doi: 10.1016/j.jinorgbio.2003.11.009. [DOI] [PubMed] [Google Scholar]
- 46.Albert A, Serjeant EP. Ionization Constants of Acids and Bases. John Wiley & Sons Inc; New York: 1962. [Google Scholar]
- 47.Sabatini A, Vacca A, Gans P. Coord Chem Rev. 1992;120:389–405. [Google Scholar]
- 48.Sweeton FH, Mesmer RE, Baes CF., Jr J Soln Chem. 1974;3:191–214. [Google Scholar]
- 49.SMART v5.626: Software for the CCD Detector System. Bruker AXS; Madison, WI: 2000. [Google Scholar]
- 50.Sheldrick GM. SHELXTL-97. University of Göttingen: Göttingen; Germany: 2000. [Google Scholar]
- 51.Sheldrick G. Acta Crystallographica Section A. 2008;64:112–122. doi: 10.1107/S0108767307043930. [DOI] [PubMed] [Google Scholar]
- 52.Sheldrick GM. SADABS: Area-Detector Absorption Correction. University of Göttingen: Göttingen; Germany: 2001. [Google Scholar]
- 53.Spek AL. PLATON: A Multipurpose Crystallographic Tool. Utrecht University; Utrecht, The Netherlands: 2000. [Google Scholar]
- 54.Reddig N, Pursche D, Kloskowski M, Slinn C, Baldeau SM, Rompel A. Eur J Inorg Chem. 2004:879–887. [Google Scholar]
- 55.Brannon JH, Magde D. J Phys Chem. 1978;82:705–709. [Google Scholar]
- 56.Wenska G, Paszyc S. Can J Chem. 1988;66:513–516. [Google Scholar]
- 57.Gruenwedel DW. Inorg Chem. 1968;7:495–501. [Google Scholar]
- 58.Christensen JJ, Izatt RM, Wrathall DP, Hansen LD. J Chem Soc A. 1969:1212–1223. [Google Scholar]
- 59.Smith RM, Martell AE. Critical Stability Constants. Vol. 2 Plenum Press; New York: 1975. [Google Scholar]
- 60.Berti E, Caneschi A, Daiguebonne C, Dapporto P, Formica M, Fusi V, Giorgi L, Guerri A, Micheloni M, Paoli P, Pontellini R, Rossi P. Inorg Chem. 2003;42:348–357. doi: 10.1021/ic0204070. [DOI] [PubMed] [Google Scholar]
- 61.Anderegg G, Wenk F. Helv Chim Acta. 1967;50:2330–2332. [Google Scholar]
- 62.Perrin DD, Dempsey B, Serjeant EP. pKa Prediction for Organic Acids and Bases. Chapman and Hall; London: 1981. [Google Scholar]
- 63.Sjöback R, Nygren J, Kubista M. Spectrochim Acta A. 1995;51:L7–L21. [Google Scholar]
- 64.Jang YH, Hwang S, Chung DS. Chem Lett. 2001;30:1316–1317. [Google Scholar]
- 65.Martin MM, Ware WR. J Phys Chem. 1978;82:2770–2776. [Google Scholar]
- 66.Ikeda N, Okada T, Mataga N. Bull Chem Soc Jpn. 1981;54:1025–1030. [Google Scholar]
- 67.Zhang X, Hayes D, Smith SJ, Friedle S, Lippard SJ. J Am Chem Soc. 2008;130:15788–15789. doi: 10.1021/ja807156b. [DOI] [PMC free article] [PubMed] [Google Scholar]
- 68.Fahrni CJ, O’Halloran TV. J Am Chem Soc. 1999;121:11448–11458. [Google Scholar]
Associated Data
This section collects any data citations, data availability statements, or supplementary materials included in this article.


