Abstract
Purpose
To compare intraocular pressure (IOP) values measured by both Goldmann applanation tonometry (GAT) and dynamic contour tonometry (DCT) in both normal and glaucomatous eyes, and to determine the relationship between these parameters and central corneal thickness (CCT).
Patients and Methods
Forty-seven subjects with primary open-angle glaucoma and 38 normal subjects attended a 12-hour session during which IOP was assessed at 7 time points, every 2 hours, by both GAT and DCT. CCT was also assessed at the same visit. Mean IOP was calculated for each eye of each subject by each method from the 7 diurnal IOP measurements obtained.
Results
Mean IOP was higher when measured by DCT than by GAT in both normal (by 1.1 mm Hg, P<0.0001) and glaucomatous (by 1.6 mm Hg, P<0.0001) eyes. IOP measurements by GAT and DCT were moderately correlated in both normal (r2=0.354, P<0.0001) and glaucomatous (r2=0.552, P<0.0001) eyes. In normal eyes, there was a weak positive correlation between GAT IOP and CCT (r2=0.088, slope=0.022 mm Hg/µm, P=0.009) and no correlation between DCT IOP and CCT (r2=0.007, slope=0.005 mm Hg/µm, P=0.468). In glaucomatous eyes, there was no correlation between GAT IOP and CCT (r2=0.006, slope=0.007 mm Hg/µm, P=0.473) and a weak inverse correlation between DCT IOP and CCT (r2=0.075, slope= −0.021 mm Hg/µm, P=0.008).
Conclusions
Both GAT and DCT are affected by CCT, albeit in different ways. Normal and glaucomatous eyes exhibit different relationships between CCT and IOP measured by either GAT or DCT. The relationships between CCT and transcorneal IOP measurements are complex and incompletely characterized, which limits the clinical interpretation of GAT and DCT measurements of IOP in both normal and glaucomatous eyes.
Keywords: intraocular pressure, diurnal, tonometry, glaucoma
Elevated intraocular pressure (IOP) is an important risk factor in the development and progression of glaucoma. 1,2 Reduction of IOP is the only modifiable glaucoma risk factor and is the established treatment for glaucoma. Goldmann applanation tonometry (GAT) is the accepted standard method of IOP measurement, and is known to be influenced by a number of factors including central corneal thickness (CCT).3,4 GAT tends to underestimate IOP in eyes with thin CCT and overestimate IOP in eyes with thick CCT. Another form of tonometry, dynamic contour tonometry (DCT), has been proposed as an alternate method of measuring IOP. Unlike the flat-tipped Goldmann tonometer, which applanates the cornea to establish IOP measurements, DCT uses a concave, contour-matched tip that cradles the cornea without applanating it to measure IOP.5 With minimal distortion of the cornea, a piezoresistive pressure sensor in the center of the tip measures IOP 100 times per second over several cardiac cycles. The mean of these many IOP measurements is digitally displayed.
Numerous reports have evaluated the correlation between CCT and IOP measurements taken by GAT and DCT, with inconsistent results. DCT values are consistently higher than GAT values.6–15 Many of these reports found a significant positive correlation between GAT and CCT,7–10,15–18 but some have reported no effect of CCT on GAT measurements.12,13,19 Similarly, many reports found no correlation between DCT and CCT,8–10,12,13,15–19 whereas some have reported a significant positive correlation between DCT and CCT.7,14
To the best of our knowledge, none of these prior studies have investigated the relationship between GAT and DCT estimates of mean diurnal IOP. Therefore, the current study was designed to compare mean diurnal IOP in normal and glaucomatous eyes undergoing 12-hour diurnal IOP measurements by both GAT and DCT, and also was designed to determine the relationship between these parameters and CCT.
METHODS
This was a post-hoc analysis of data collected during the ongoing Diurnal IOP Variability Assessment (DIVA) study. Subjects in this report were participants in the DIVA study. This study was approved by the institutional review board at West Virginia University, and all subjects provided written informed consent to participate. Participating subjects were either normal subjects or had primary open-angle glaucoma (POAG). For the purposes of enrollment, patients with POAG had glaucomatous optic discs and repeatable visual field loss. A glaucomatous optic disc was defined as having evidence of excavation, diffuse or focal thinning or notching of the neuroretinal rim, visible nerve fiber layer defects, or asymmetry of the vertical cup-disc ratio of >0.2 between eyes. An abnormal visual field was defined as having a pattern standard deviation outside the 95% normal limits for Swedish Interactive Threshold Algorithm fields, or a corrected pattern standard deviation outside the 95% normal limits for Humphrey Full Threshold algorithm tests, or an abnormal glaucoma hemifield test using either test strategy. Visual field loss was reproducible over at least 2 consecutive visual field tests. Subjects with POAG were eligible if they were using identical therapy in both eyes (topical eye drop medications and/or bilateral laser trabeculoplasty); POAG subjects on topical therapy remained on unchanged therapy during their participation in this study. Normal subjects had IOP of 21 mm Hg or less (and no history of IOP above 21 mm Hg), open angles, normal appearing optic discs, normal visual fields, and no family history of glaucoma. In addition to being free of glaucoma, normal subjects had no other ocular condition that might affect IOP, and all were free of corneal pathology that might limit the value of tonometry readings.
All subjects underwent bilateral measurement of IOP by GAT and DCT every 2 hours from 8am to 8pm in the sitting position. Before each set of measurements, both eyes were anesthetized with a solution of fluorescein sodium 0.25% and benoxinate HCl 0.4% (Fluress, Akorn Inc, Buffalo Grove, IL). GAT was measured first, using the slit-lamp mounted Goldmann applanation tonometer (Haag-Streit AG, Koeniz, Switzerland). GAT values (rounded to the nearest whole number) at each time point were the mean of 2 measurements within 3 mm Hg, or the mean of 3 measurements if the first 2 differed by 4 mm Hg or more. GAT measurements were always performed before DCT measurements in accordance with the DIVA protocol, as the primary goals of the DIVA study pertained to GAT measurements of IOP. Immediately after GAT measurement, DCT measurement was performed, using the slit-lamp mounted PASCAL DCT device (Swiss Microtechnology AG, Zeimer Ophthalmic Systems Group Co, Port Switzerland). The IOP measurement is displayed digitally on the DCT device to the nearest 0.1 mm Hg, along with a quality score Q between 1 and 5 (lower scores indicate better quality). DCT values at each time point were the mean of 2 measurements with a quality score Q of 3 or less. CCT was also measured in all eyes, using the DGH Pachette 2 ultrasound pachymeter, immediately after the 8am GAT and DCT measurements. CCT values were the mean of 5 measurements.
After completion of the 12-hour diurnal IOP curve, mean GAT IOP was calculated for each eye of each subject as the mean of the 7 GAT values corresponding to the 7 time points during the 12-hour diurnal curve period (8am, 10am, noon, 2pm, 4pm, 6pm, and 8pm) for that eye. Similarly, mean DCT IOP was the mean of the 7 DCT values obtained throughout the 12-hour period.
Correlations between measured parameters were calculated using linear regression analysis and the coefficient of determination was derived for each of these analyses. Comparisons of regression line slopes were achieved using the analysis of covariance; the interaction between the method (GAT and DCT) and the continuous variable CCT was the term that tested the equal slopes hypothesis. Comparisons of mean values between groups were made using the paired t test, comparisons of proportions between groups were performed using the χ2 (or Fisher exact) test, with P<0.05 taken as the level of statistical significance. Descriptive statistics were also generated and are reported as mean ± standard deviation (SD). As this was a post-hoc analysis of an ongoing study, sample size represented all participating subjects who had undergone the tests required for inclusion in this analysis.
RESULTS
Subject Accounting and Demographics
Overall, 85 subjects were included in this analysis, including 47 subjects with POAG and 38 normal subjects. Demographic information and measured ocular parameters for all subjects are given in Table 1. GAT IOP was similar in normal and glaucomatous eyes, but normal eyes had significantly lower DCT IOP (by 0.9 mm Hg, P=0.010) and higher mean CCT values (by 11 µm, P=0.027) than glaucomatous eyes.
TABLE 1.
Subject Demographic Information and Measured Ocular Parameters by Group
| Normal | Glaucoma | P | |
|---|---|---|---|
| No. | 38 | 47 | — |
| Demographics | |||
| Mean age (y) | 70.0 ± 12.8 | 66.3 ± 12.4 | 0.187 |
| Race (% white) | 100% | 91.5% | 0.125 |
| Sex (% female) | 66.7% | 63.8% | 0.823 |
| Ocular parameters | |||
| Mean GAT IOP (mm Hg) | 15.0 ± 2.3 | 15.4 ± 2.9 | 0.309 |
| Mean DCT IOP (mm Hg) | 16.1 ± 2.0 | 17.0 ± 2.5 | 0.010 |
| Mean CCT (µm) | 562 ± 31 | 551 ± 32 | 0.027 |
CCT indicates central corneal thickness; DCT, dynamic contour tonometry; GAT, Goldmann applanation tonometry; IOP, intraocular pressure.
Correlation of GAT and DCT Measurements
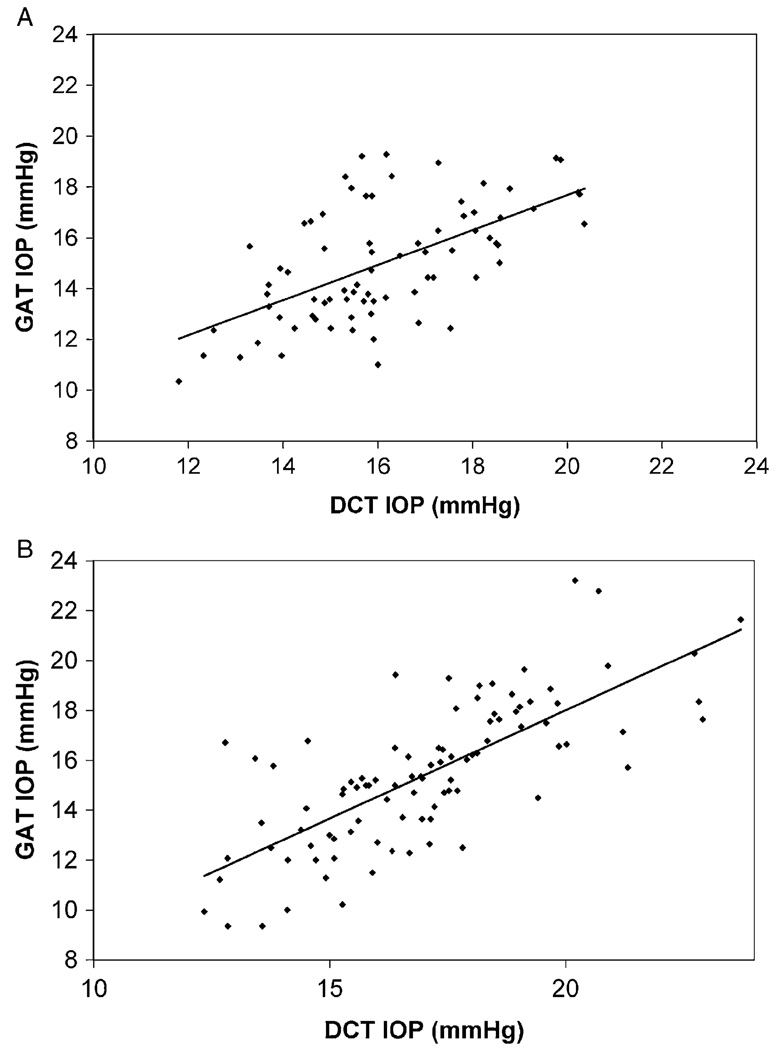
GAT and DCT measurements of mean diurnal IOP were moderately correlated in both normal (r2=0.354, P<0.0001) and glaucomatous (r2=0.552, P<0.0001) eyes (Fig. 1). Mean diurnal IOP was higher when measured by DCT than by GAT in both normal and glaucomatous eyes (Table 1). DCT overestimated GAT values by 1.1 ± 1.9 mm Hg in normal eyes (P<0.0001) and by 1.6 ± 2.0 mm Hg in glaucomatous eyes (P<0.0001). The GAT-DCT difference was equivalent in glaucomatous and normal eyes (P=0.107).
FIGURE 1.
Correlation of GAT and DCT. A, normal eyes; B, glaucomatous eyes. DCT indicates dynamic contour tonometry; GAT, Goldmann applanation tonometry.
Influence of CCT on GAT and DCT Measurements
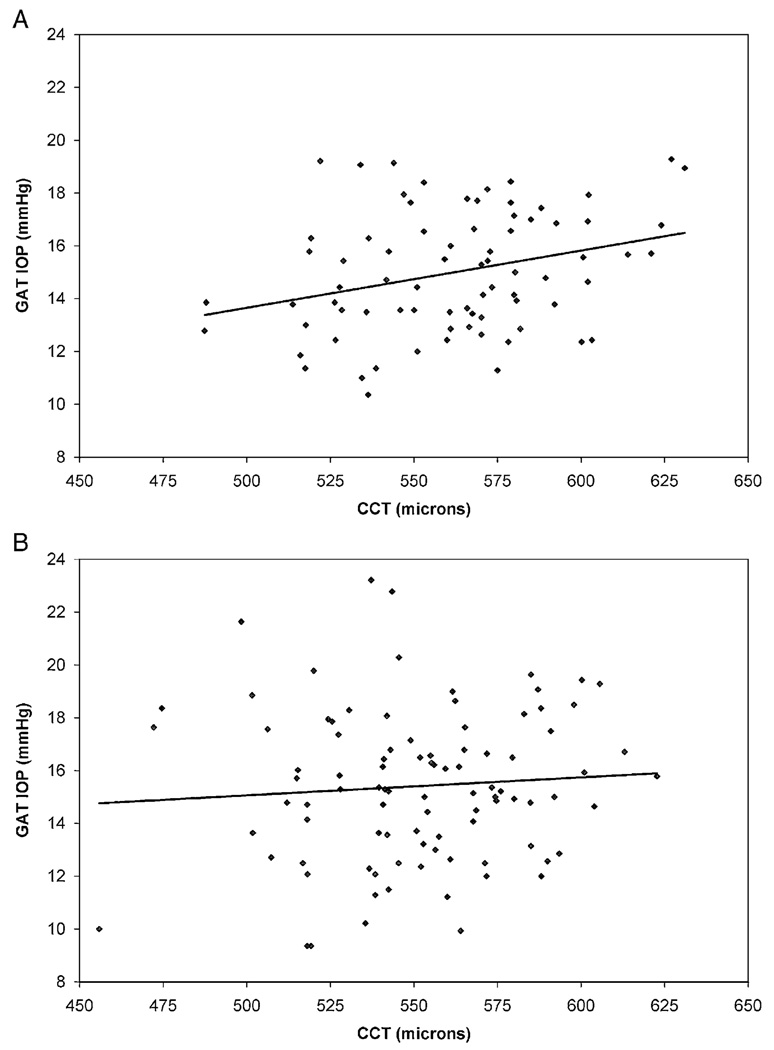
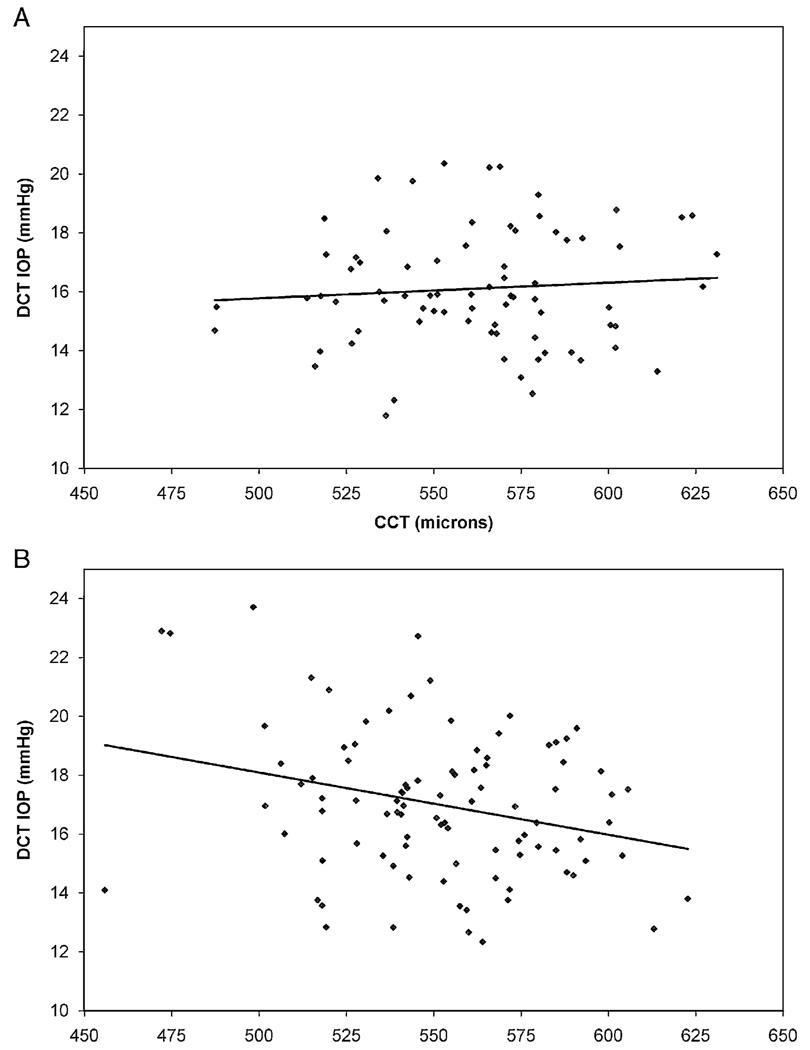
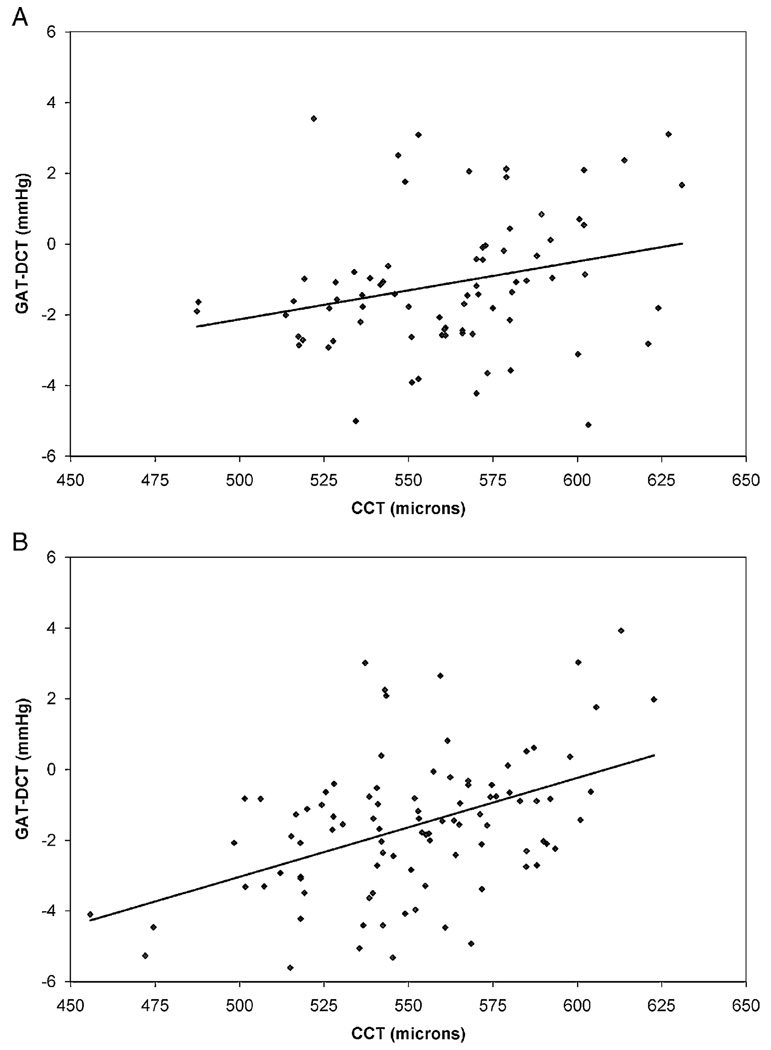
The effects of CCT on GAT and DCT IOP measurements in normal and glaucomatous eyes are illustrated in Figure 2 and Figure 3. In normal eyes, there was a weak positive correlation between GAT IOP and CCT (r2=0.088, slope=0.022 mm Hg/µm, P=0.009) and no correlation between DCT IOP and CCT (r2=0.007, slope=0.005 mm Hg/µm, P=0.468). The slopes of these regression lines were statistically equivalent (P=0.135) In glaucomatous eyes, there was no correlation between GAT IOP and CCT (r2=0.006, slope=0.007 mm Hg/µm, P=0.473) and a weak inverse correlation between DCT IOP and CCT (r2=0.075, slope= −0.021 mm Hg/µm, P=0.008). The slopes of these regression lines were significantly different (P=0.022). The GAT-DCT difference increased slightly as CCT increased in normal eyes (r2=0.070, slope=0.016 mm Hg/µm, P=0.021) and in glaucomatous eyes (r2=0.208, slope=0.028 mm Hg/µm, P<0.0001) (Fig. 4).
FIGURE 2.
Correlation of GAT and CCT. A, normal eyes; B, glaucomatous eyes. CCT indicates central corneal thickness; GAT, Goldmann applanation tonometry.
FIGURE 3.
Correlation of DCT and CCT. A, normal eyes; B, glaucomatous eyes. CCT indicates central corneal thickness; DCT, dynamic contour tonometry.
FIGURE 4.
Correlation of the GAT-DCT difference and CCT. A, normal eyes; B, glaucomatous eyes. CCT indicates central corneal thickness; DCT, dynamic contour tonometry; GAT, Goldmann applanation tonometry.
DISCUSSION
The measurement of IOP is essential for both the diagnosis and management of glaucoma. GAT remains the gold standard method of IOP assessment, but is well known to be inaccurate in eyes with corneas that are significantly thinner or thicker than average. Although the direction of inaccuracy can often be predicted based on CCT—GAT generally underestimates IOP in eyes with thin corneas and overestimates IOP in eyes with thick corneas—the magnitude of this effect cannot be reliably estimated based on GAT and CCT values alone. This is likely because corneal biomechanical properties are the primary contributors to the Goldmann artifact, and CCT is not a perfect surrogate for these more relevant properties.
The dynamic contour tonometer was developed to provide an estimate of IOP that is less affected by corneal properties. In essentially all comparisons of GAT and DCT—including the present study—DCT values tend to be higher than Goldmann values.6–15 The reported effects of CCT on IOP measurements by GAT and DCT have been inconsistent among studies. Earlier studies largely have reported a significant positive correlation between GAT and CCT,7–10,15–18 whereas a few have found no correlation. 12,13,19 Our data demonstrate a weak positive correlation between CCT and GAT in normal eyes but no correlation in glaucomatous eyes. This is consistent with Barleon and coworkers19 who reported that GAT and CCT correlated in normal but not glaucomatous eyes. Using DCT, most investigators have observed no correlation with CCT,8–10,12,13,15–19 whereas a few have reported a significant positive correlation between DCT and CCT.7,14 Our data are again mixed, with no correlation between DCT and CCT in normal eyes and a never-before-reported inverse correlation between DCT and CCT in glaucomatous eyes, in which DCT measurements tend to decrease with increasing CCT.
The relationship between the GAT-DCT difference and CCT in the current study (Fig. 4) seemed quite similar in normal and glaucomatous eyes. This resemblance, however, arose because in normal eyes, GAT increased with increasing CCT whereas DCT remained unchanged. In glaucomatous eyes, in contrast, DCT decreased with increasing CCT whereas GAT remained unchanged.
In the aggregate, our data support that the relationships between GAT and CCT and between DCT and CCT differ from one another. GAT and CCT exhibited positive correlation in normal eyes and no correlation in glaucomatous eyes, while DCT and CCT had no correlation in normal eyes and an inverse correlation in glaucomatous eyes. More perplexing is why there is a difference in the GAT-CCT and DCT-CCT relationships in normal versus glaucomatous eyes. The slopes of the GAT-CCT regression and the DCT-CCT regression were statistically equivalent in normal eyes but significantly different from one another in glaucomatous eyes.
Why would these devices work similarly in normal eyes but differently in glaucomatous eyes? There was a small but significant difference between our normal and glaucoma subjects at baseline: our normal eyes had thicker CCT than our glaucomatous eyes (562 vs. 551 µm, P=0.027). But because our analyses involve CCT values on an individual basis and not mean CCT values of the 2 groups, this small difference should be inconsequential in our analyses. Another consideration is that GAT was always measured before DCT, which might introduce a systemic error if GAT measurements affected DCT measurements. Ideally, the order of GAT and DCT measurements would be randomized to minimize a potential order effect. The present report represents a post-hoc analysis of data collected in the ongoing DIVA study, in which the protocol required that GAT measurements precede DCT measurements. It is possible that an order effect contributed in some way to our findings of differences between GAT and DCT measurements. But we would expect to see similar order effects in both normal and glaucomatous eyes, rather than just in glaucomatous eyes, so it is unlikely that an order effect contributed to our findings of differences between GAT and DCT measurements in normal versus glaucomatous eyes. More intriguing is the possibility that corneal biomechanics differ in some way between normal and glaucomatous eyes. Hernandez and colleagues20 have demonstrated that collagen synthesis is up-regulated in the human glaucomatous optic nerve. Perhaps the collagen of the cornea is also altered in some way by glaucoma (or its treatment), in turn altering the biomechanical properties of the cornea that likely underlie the differences in IOP measurements by GAT and DCT.
Our study and the others discussed above demonstrate that CCT affects IOP measurements by GAT and DCT differently in normal versus glaucomatous eyes. The nature and magnitude of the GAT-CCT and DCT-CCT relationships vary among studies, suggesting that the nature of the relationship between CCT and transcorneal measurement of IOP is complex and incompletely characterized.
One difference between our report and those discussed above is that whereas previous groups have analyzed correlations of single IOP values, we have analyzed correlations of mean diurnal IOP. IOP is dynamic and a single measurement of IOP does not adequately characterize IOP behavior over time. Although not specifically stated in every prior report, it is assumed that GAT and DCT measurements in these prior studies were performed closely together in time; the more time separating the 2 assessments from each other, the greater the likelihood for spontaneous IOP variation to disrupt potential correlation analyses. Our use of mean diurnal IOP should minimize any effect of spontaneous IOP variation by more fully characterizing IOP values determined by each tonometer. Interestingly, the correlation between GAT and DCT observed in our study (r2=0.352 in normal eyes and r2=0.552 in glaucomatous eyes) was generally consistent with—but not superior to—values described in prior reports.
In summary, our data evaluating mean diurnal IOP demonstrate that both GAT and DCT are affected by CCT, albeit in different ways. We have also found that normal and glaucomatous eyes exhibit different relationships between CCT and IOP measured by either GAT or DCT. The relationships between CCT and transcorneal IOP measurements are complex and incompletely characterized, which limits the clinical interpretation of GAT and DCT measurements of IOP in both normal and glaucomatous eyes.
Acknowledgments
Supported by National Eye Institute Grant R03 EY015682 (TR).
Footnotes
Presented in part at the annual meeting of the Association for Research in Vision and Ophthalmology, Fort Lauderdale, FL, April 27–31, 2008.
REFERENCES
- 1.Kass MA, Heuer DK, Higginbotham EJ, et al. The Ocular Hypertension Treatment Study: a randomized trial determines that topical ocular hypotensive medication delays or prevents the onset of primary open-angle glaucoma. Arch Ophthalmol. 2002;120:701–713. doi: 10.1001/archopht.120.6.701. [DOI] [PubMed] [Google Scholar]
- 2.Heijl A, Leske MC, Bengtsson B, et al. Reduction of intraocular pressure and glaucoma progression: results from the Early Manifest Glaucoma Trial. Arch Ophthalmol. 2002;120:1268–1279. doi: 10.1001/archopht.120.10.1268. [DOI] [PubMed] [Google Scholar]
- 3.Brandt JD. Corneal thickness in glaucoma screening, diagnosis, and management. Curr Opin Ophthalmol. 2004;15:85–89. doi: 10.1097/00055735-200404000-00004. [DOI] [PubMed] [Google Scholar]
- 4.Garway-Heath D, Kotecha A, Lerner F, et al. Measurement of intraocular pressure. In: Weinreb R, Brandt JD, Garway-Heath D, et al., editors. Intraocular Pressure. The Hague: Kugler Publications; 2007. [Google Scholar]
- 5.Kanngiesser HE, Kniestedt C, Robert YC. Dynamic contour tonometry: presentation of a new tonometer. J Glaucoma. 2005;14:344–350. doi: 10.1097/01.ijg.0000176936.16015.4e. [DOI] [PubMed] [Google Scholar]
- 6.Doyle A, Lachkar Y. Comparison of dynamic contour tonometry with Goldmann applanation tonometry over a wide range of central corneal thickness. J Glaucoma. 2005;14:288–292. doi: 10.1097/01.ijg.0000169393.40298.05. [DOI] [PubMed] [Google Scholar]
- 7.Francis BA, Hsieh A, Lai MY, et al. Effects of corneal thickness, corneal curvature, and intraocular pressure level on Goldmann applanation tonometry and dynamic contour tonometry. Ophthalmology. 2007;114:20–26. doi: 10.1016/j.ophtha.2006.06.047. [DOI] [PubMed] [Google Scholar]
- 8.Grieshaber MC, Schoetzau A, Zawinka C, et al. Effect of central corneal thickness on dynamic contour tonometry and Goldmann applanation tonometry in primary open-angle glaucoma. Arch Ophthalmol. 2007;125:740–744. doi: 10.1001/archopht.125.6.740. [DOI] [PubMed] [Google Scholar]
- 9.Kamppeter BA, Jonas JB. Dynamic contour tonometry for intraocular pressure measurement. Am J Ophthalmol. 2005;140:318–320. doi: 10.1016/j.ajo.2005.01.039. [DOI] [PubMed] [Google Scholar]
- 10.Kaufmann C, Bachmann LM, Thiel MA. Comparison of dynamic contour tonometry with Goldmann applanation tonometry. Invest Ophthalmol Vis Sci. 2004;45:3118–3121. doi: 10.1167/iovs.04-0018. [DOI] [PubMed] [Google Scholar]
- 11.Kotecha A, White ET, Shewry JM, et al. The relative effects of corneal thickness and age on Goldmann applanation tonometry and dynamic contour tonometry. Br J Ophthalmol. 2005;89:1572–1575. doi: 10.1136/bjo.2005.075580. [DOI] [PMC free article] [PubMed] [Google Scholar]
- 12.Pache M, Wilmsmeyer S, Lautebach S, et al. Dynamic contour tonometry versus Goldmann applanation tonometry: a comparative study. Graefes Arch Clin Exp Ophthalmol. 2005;243:763–767. doi: 10.1007/s00417-005-1124-y. [DOI] [PubMed] [Google Scholar]
- 13.Punjabi OS, Ho HK, Kniestedt C, et al. Intraocular pressure and ocular pulse amplitude comparisons in different types of glaucoma using dynamic contour tonometry. Curr Eye Res. 2006;31:851–862. doi: 10.1080/02713680600899887. [DOI] [PubMed] [Google Scholar]
- 14.Salvetat ML, Zeppieri M, Tosoni C, et al. Comparisons between Pascal dynamic contour tonometry, the TonoPen, and Goldmann applanation tonometry in patients with glaucoma. Acta Ophthalmol Scand. 2007;85:272–279. doi: 10.1111/j.1600-0420.2006.00834.x. [DOI] [PubMed] [Google Scholar]
- 15.Schneider E, Grehn F. Intraocular pressure measurement-comparison of dynamic contour tonometry and Goldmann applanation tonometry. J Glaucoma. 2006;15:2–6. doi: 10.1097/01.ijg.0000196655.85460.d6. [DOI] [PubMed] [Google Scholar]
- 16.Kniestedt C, Lin S, Choe J, et al. Clinical comparison of contour and applanation tonometry and their relationship to pachymetry. Arch Ophthalmol. 2005;123:1532–1537. doi: 10.1001/archopht.123.11.1532. [DOI] [PubMed] [Google Scholar]
- 17.Ku JY, Danesh-Meyer HV, Craig JP, et al. Comparison of intraocular pressure measured by Pascal dynamic contour tonometry and Goldmann applanation tonometry. Eye. 2006;20:191–198. doi: 10.1038/sj.eye.6701849. [DOI] [PubMed] [Google Scholar]
- 18.Medeiros FA, Sample PA, Weinreb RN. Comparison of dynamic contour tonometry and Goldmann applanation tonometry in African American subjects. Ophthalmology. 2007;114:658–665. doi: 10.1016/j.ophtha.2006.06.065. [DOI] [PubMed] [Google Scholar]
- 19.Barleon L, Hoffmann EM, Berres M, et al. Comparison of dynamic contour tonometry and Goldmann applanation tonometry in glaucoma patients and healthy subjects. Am J Ophthalmol. 2006;142:583–590. doi: 10.1016/j.ajo.2006.05.030. [DOI] [PubMed] [Google Scholar]
- 20.Hernandez MR, Ye H, Roy S. Collagen type IV gene expression in human optic nerve heads with primary open angle glaucoma. Exp Eye Res. 1994;59:41–51. doi: 10.1006/exer.1994.1079. [DOI] [PubMed] [Google Scholar]


