

Abstract
The cellular immune response to primary influenza virus infection is complex, involving multiple cell types and anatomical compartments, and is difficult to measure directly. Here we develop a two-compartment model that quantifies the interplay between viral replication and adaptive immunity. The fidelity of the model is demonstrated by accurately confirming the role of CD4 help for antibody persistence and the consequences of immune depletion experiments. The model predicts that drugs to limit viral infection and/or production must be administered within 2 days of infection, with a benefit of combination therapy when administered early, and cytotoxic CD8 T cells in the lung are as effective for viral clearance as neutralizing antibodies when present at the time of challenge. The model can be used to investigate explicit biological scenarios and generate experimentally testable hypotheses. For example, when the adaptive response depends on cellular immune cell priming, regulation of antigen presentation has greater influence on the kinetics of viral clearance than the efficiency of virus neutralization or cellular cytotoxicity. These findings suggest that the modulation of antigen presentation or the number of lung resident cytotoxic cells and the combination drug intervention are strategies to combat highly virulent influenza viruses. We further compared alternative model structures, for example, B-cell activation directly by the virus versus that through professional antigen-presenting cells or dendritic cell licensing of CD8 T cells.
Understanding how the immune system combats influenza virus infection and how the virus can affect the immune system is crucial to predicting and designing prophylactic and therapeutic strategies against the infection (58). Antigenic shift and antigenic drift alter the degree to which preexisting immunity can control the virus. These factors also influence whether different arms of the adaptive immune system can cross-react against new strains of the virus. For example, shifts of the hemagglutinin (HA) and neuraminidase (NA) protein sequences limit the ability of antibodies to neutralize new variants of the virus and may make cross-reactive T-cell responses to conserved viral proteins more important. Other viral proteins, such as NS1, affect both the induction of type I interferon as well as the susceptibility of infected cells to interferon-mediated inhibition of viral gene expression (43). The efficiencies of viral replication and cell-to-cell viral spread are altered by mutations in the viral matrix and polymerase genes, while the survival of infected cells can be altered by the viral PB1-F2 protein. These attributes are influenced by mutations in the viral matrix (50, 51) and polymerase (30, 69) genes, while the survival of infected cells can be altered by the viral PB1-F2 protein (17). The multigenic aspect of influenza virus pathogenesis makes experimental prediction difficult and time-consuming. Computer simulation tools would be useful to independently dissect the potential contribution and relative importance of each factor or to investigate unexpected scenarios that are difficult to replicate experimentally.
Mathematical models and computer simulations have been widely used to study viral dynamics and immune responses to viral infections, such as human immunodeficiency virus type 1 (HIV-1) and simian immunodeficiency viruses (SIV), lymphocytic choriomeningitis virus (19, 55, 60, 61), and influenza A virus (3, 7, 8, 13, 34, 35, 52). More complex compartmental models of the immune system (4, 23) and models incorporating differential delay equations (21, 48, 68) have been used to better reflect the time that cells reside in a particular compartment or the duration of transit between compartments. In this study, we sought to develop a two-compartment mathematical model to assess the individual contributions of antigen presentation and activation of naïve T and B cells by antigen-presenting cells (APC), CD4 T-cell help, CD8 T-cell-mediated cytotoxicity, B cells, and antibody to control influenza A virus (IAV) infection and to explore the influence of anatomical location. We developed a model which represented published experimental findings on primary influenza virus infection. More importantly, the model was used to explore alternative structures for interactions between virus and immune cells, for example, comparing virus kinetics when antigen delivery and immune cell priming occurred through direct interaction of virus and immune cells or through a cellular intermediate. The model predicts that, under some circumstances, changes affecting antigen presentation more strongly impacted viral kinetics than other viral or immune factors (28, 73, 75, 78). This model highlights the importance of the assumptions used to synthesize a model and gaps in our understanding of the immune response regulating primary influenza virus infection. We discuss the implications of these findings for future influenza virus research and theories of influenza virus virulence based on influenza virus-immune system interactions.
MATERIALS AND METHODS
Experimental data.
All animal experiments were performed under institutional guidelines according to an IACUC-approved protocol. NP366-374-specific CD8 T cells in the whole lung were measured as follows: C57BL/6NCr mice at 10 to 11 weeks of age were anesthetized using 2,2,2-tribromo-ethanol (Avertin) and then infected intranasally with 1 × 10⁵ H3N2 A/Hong Kong/X31 (X31) influenza virus (62). On the day of organ harvest, mice (n = 6/day) were euthanized. Spleen and lymph node samples were collected and processed using Dounce homogenizers in complete minimal essential medium (cMEM) (5% fetal bovine serum) to disrupt the organs into single-cell suspensions. Lung samples were processed in a tea strainer using a rubber plunger. The samples were centrifuged at 400 × g for 5 min. Red blood cells were lysed using buffered ammonium chloride solution (Gey's solution). Lung cell pellets were resuspended in 5 ml of cMEM over 5 ml of Histopaque 1083 (Sigma Diagnostics) and centrifuged for 18 min at 1,800 × g. After centrifugation, cells at the interface were carefully removed and washed with 10 ml of cMEM and then resuspended in cMEM for the immune assays. For flow cytometry, cells were Fc blocked and then stained with PA-PE and NP-APC tetramers (Trudeau Institute Molecular Core Facility) for 1 h at room temperature. Cells were pelleted and surfaced stained with CD8 APC-Cy7, CD4 PE-Cy5.5, CD90.2-PerCP, CD44-Alexa 700, CD62L-PE-TR, CD11a-PE-Cy7, CD49a-fluorescein isothiocyanate in Hanks' balanced salt solution containing 1% bovine serum albumin. Sample data were collected using a BD LSRII cytometer. Data were analyzed using FlowJo software (TreeStar). According to direct measurement, NP366-374-specific CD8 T cells account for approximately 10% of the total CD8 response to influenza virus (11). Therefore, we introduced a scale factor of 10 to extrapolate total influenza virus-specific CD8+ T-cell counts from NP366-374-specific CD8 T cells.
Viral titers from lung samples were measured by hemagglutination assay, after expansion in embryonated eggs; the 50% egg infectious dose (EID50) was calculated using the Reed-Muensch equation.
G. T. Belz and W. R. Heath (Immunology Division, The Walter and Eliza Hall Institute of Medical Research, Melbourne, Victoria, Australia) kindly provided us with raw data for the kinetics of virus-loaded dendritic cells (DC) in lymph nodes (LNs) (see Fig. 1A in reference 10). Lymphatic compartment DC kinetics were from C57BL/6 mice intranasally infected with 102 PFU of HKx31 and determined by mediastinal LNs treated with collagenase-DNase to form single-cell suspensions, which were cultured with a lacZ-inducible hybridoma specific for influenza virus NP and enumerated for β-galactosidase-producing cells (10). T. D. Randall (Trudeau Institute, Saranac Lake, NY) kindly provided raw data of the kinetics of serum antibody (see Fig. 5A in reference 44). Serum antibody kinetics were from C57BL/6 mice intranasally infected with 100 egg infectious units of influenza virus A/PR8/34, and influenza virus-specific immunoglobulin G (IgG) titers were determined by enzyme-linked immunosorbent assay (44).
FIG. 1.

Schematic representation of the influenza A virus infection model. A black arrow denotes either differentiation or activation. A dashed line between cells denotes cell-cell interactions.
FIG. 5.

Schematic representation of the alternative model with activation of B cells by virus. The blue line denotes the change from the baseline model in Fig. 1.
Mathematical model.
The immune response to respiratory infection with influenza virus involves several lymphoid and nonlymphoid anatomical compartments. Because productive infection is typically restricted to the lung, we chose a simplified, two-compartment structure limited to the lung (as a whole) and single lymphoid compartment analogous to the draining lymph node and spleen. Certain aspects of the innate immune response to influenza virus, such as secretion of type I interferon, have been modeled in the past (3, 34). We chose to limit the scope of this model to the adaptive cellular and humoral immune response. Explicit functions that are comprised of multiple cell subsets that may interact in complex ways, such as antigen presentation, are summarized using simplified terms familiar to an immunologist. The ability to carry antigen and activate “naïve” T cells and B cells to become effectors is, for example, subsumed under the term “dendritic cells”. In addition to DC, we include the following cell types: infected and uninfected epithelial cells, cytotoxic (CD8) T cells, “helper” T cells (CD4), and long-lived and short-lived antibody-secreting cells (B cells). Thus, cell-mediated elimination of infected epithelial cells is mediated solely by the CD8 T-cell component, while “help” for DC and B-cell activation and class switching is mediated solely by the CD4 T-cell component. A schematic representation of our model of influenza virus infection and the cellular/humoral immune response is presented in Fig. 1.
Infection begins when influenza viruses (V) enter the host respiratory tract and infect epithelial cells (Ep) within the airways and lung parenchyma. The infection then stimulates the immature DC (D) present in the lung parenchyma to take up virus and become virus-loaded DC (D*) capable of antigen presentation to T and B cells. A term is introduced to represent migration of influenza virus-loaded DC into the spleen/lymph node. The DC that are competent to “prime” adaptive naïve cytotoxic, “helper,” and antibody-secreting cells become “mature” (DM). The mature DC (DM) activate naïve CD8 T cells (TN), which differentiate into CD8 effector cells (TE). The TE then migrate into the airway/lung compartment and kill infected epithelial cells (EP*). In addition, mature DC also activate naïve CD4 T cells (HN), which differentiate into helper T cells (HE) that can support antibody class switching and DC maturation. Activation of naïve B cells requires binding of viral antigens to the B-cell receptor and help from activated CD4 T cells (HE). We model this encounter by assuming that mature virus-loaded DC (DM) interact with naïve B cells (BN), allowing B-cell receptor-IAV interactions (64). We consider two separate populations of antibody-secreting cells, short-lived (PS) and long-lived (PL). Based on data from major histocompatibility complex (MHC) class II-deficient mice, which develop only short-lived plasma cells after infection, we assumed that differentiation of long-lived antibody-secreting cells is mediated by cell-to-cell interactions between effector helper T cells (HE) and activated B cells (BA). In contrast, we assumed that short-lived plasma cells can arise from T-cell-independent activation of B cells. The antiviral antibodies (A) produced by short- and long-lived plasma cells diffuse into the lung compartment to bind and remove free influenza virions.
We used delay differential equations (DDE) to account for the time delays between viral infection, immune cell activation, and migration of immune effector cells between tissue and lymphoid compartments. The model equations describing events in the lung are the following:
 |
(1) |
 |
(2) |
 |
(3) |
 |
(4) |
 |
(5) |
The variables and parameters for equations 1 to 5 are specified in Tables 1 and 2.
TABLE 1.
Model variable definitions and initial values
| Variable | Definition | Initial value |
|---|---|---|
| EP | Uninfected epithelial cells | 5 × 10⁵ |
| EP* | Infected epithelial cells | 0 |
| V | Virus titer (EID50/ml) | 10 |
| D | Immature dendritic cells | 103 |
| D* | Virus-loaded dendritic cells | 0 |
| DM | Mature dendritic cells | 0 |
| HN | Naïve CD4+ T cells | 103 |
| HE | Effector CD4+ T cells | 0 |
| TN | Naïve CD8+ T cells | 103 |
| TE | Effector CD8+ T cells | 0 |
| BN | Naïve B cells | 103 |
| BA | Activated B cells | 0 |
| PS | Short-lived plasma (antibody-secreting) B cells | 0 |
| PL | Long-lived plasma (antibody-secreting) B cells | 0 |
| A | Antiviral antibody titer | 110.2 |
TABLE 2.
Model parameter definitions and values
| Parameter | Definition | Value (reference) |
|---|---|---|
| E0 | Initial no. of epithelial cells | 5 × 10⁵ |
| δE | Death rate of uninfected epithelial cells (day−1) | 10−3 |
| βE | Infection rate of epithelial cells by unit IAV [day−1(EID50/ml)−1] | 7 × 10⁻⁵ (3) |
| δE* | Death rate of infected epithelial cells (day−1) | 1.2 (83) |
| kE | Killing rate of infected epithelial cells by CD8+ T cells (day−1) | 1.19 × 10⁻³ (5) |
| τT | CD8+ T-cell migration delay from lymphatic compartment to airway/lung (day) | 0.5 (62) |
| γ | CD8+ T-cell migration factor | 0.15 (62) |
| πv | Virus production rate per epithelial cells [(EID50/ml)day−1] | 1.9 |
| cv | Virus clearance rate (day−1) | 1 (13) |
| kv | Rate constant of IAV neutralization by unit anti-IAV antibody (day−1 titer−1) | 4 × 10⁻³ |
| D0 | Initial no. of dendritic cells in airway/lung | 103 |
| δD | Death rate of dendritic cells (day−1) | 10−3 |
| βD | Infection rate of dendritic cells by unit IAV [day−1(EID50/ml)−1] | 10−2 |
| δD* | Death rate of infected dendritic cells (day−1) | 2.9 |
| kD | Antigen processing rate (day−1) | 200 |
| δDM | Death rate of mature dendritic cells (day−1) | 0.5 |
| τD | Virus-loaded DC migration delay from lung to spleen (day) | 1 |
| HN0 | Initial no. of antigen specific naïve CD4+ T cells | 1,000 (11) |
| δHN | Death rate of naïve CD4+ T cells (day−1) | 2 × 10⁻³ |
| πH1 | Maximum activation rate of naïve CD4+ T cells (day−1) | 1.5 |
| πH2 | No. of DM cells for half-maximal activation of naïve CD4+ T cells | 102 |
| ρH1 | Maximum proliferation rate of effector CD4+ T cells (day−1) | 1.51 (19) |
| ρH2 | No. of DM cells for half-maximal proliferation of effector CD4+ T cells | 4 × 10³ |
| δH1 | Maximum clearance rate of effector CD4+ T cells (day−1) | 0.4 |
| δH2 | No. of DM cells for half-maximal clearance of effector CD4+ T cells | 1 |
| TN0 | Initial no. of antigen-specific CD8+ T cells | 1,000 (11) |
| δTN | Death rate of naïve CD8+ T cells (day−1) | 2 × 10⁻³ |
| πT1 | Maximum activation rate of CD8+ T cells from naïve CD8+ T cells (day−1) | 3 |
| πT2 | No. of DM cells for half maximal activation of naïve CD8+ T cells | 102 |
| ρT1 | Maximum proliferation rate of effector CD8+ T cells (day−1) | 2.6 (19) |
| ρT2 | No. of DM cells for half-maximal proliferation of effector CD8+ T cells | 4 × 10³ |
| δT1 | Maximum clearance rate of effector CD8+ T cells (day−1) | 0.75 |
| δT2 | No. of DM cells for half-maximal clearance of effector CD8+ T cells | 1 |
| BN0 | Initial no. of naïve B cells in spleen/LN | 103 |
| δB | Death rate of naïve B cells (day−1) | 2 × 10⁻³ |
| πB1 | Maximum activation rate of naïve B cells (day−1) | 3 |
| πB2 | No. of DM cells for half-maximal activation of naïve B cells | 104 |
| ρB1 | Maximum proliferation rate of activated B cells (day−1) | 2.6 |
| ρB2 | No. of DM cells for half-maximal proliferation of activated B cells | 4 × 10³ |
| h | Factor for B-cell activation by CD4+ T cells | 0 |
| δBA | Clearance rate of activated B cells (day−1) | 0.9 |
| πS | Differentiation rate of activated B cells into short-lived antibody-secreting plasma cells (day−1) | 10−3 |
| πL | Differentiation rate of activated B cells into long-lived antibody-secreting plasma cells (day−1) | 8 × 10⁻⁹ |
| δS | Death rate of short-lived antibody-secreting plasma cells (day−1) | 0.1 |
| δL | Death rate of long-lived antibody-secreting plasma cells (day−1) | 3 × 10⁻² |
| πAS | Secretion rate of antibody titer by unit short-lived plasma cell (day−1) | 0.06 |
| πAL | Secretion rate of antibody titer by unit of long-lived plasma cells (day−1) | 0.8 |
| δA | Clearance rate of antibody (day−1) | 0.04 (79, 80) |
The change in the numbers of uninfected epithelial cells (Ep) in equation 1 is described by a constant death rate (δE) and a term assuming a constant rate of regeneration of uninfected epithelial cells, δEE0, with E0 denoting the initial number of uninfected cells at time zero. Note that a constant regeneration rate does not take into account possible changes in the rate as a result of the infection. Viral infection occurs at the rate βEEpV. In equation 2, infected epithelial cells are produced by viral infection, βEEpV, and removed by cell death (viral induced or apoptotic) with rate δE or eliminated by cytotoxic (CD8) T effectors with the rate constant kE. Assuming that the number of antigen-specific CD8 T cells in the lung compartment is proportional to the number in the lymphoid compartment with proportionality constant γ and a time delay of τT, we write the number of CD8 T cells in the lung compartment as Tlung = γTE(t − τT), where TE(t) denotes the number of effector CD8 T cells in the lymphoid compartment. This assumption is made based on experimental measurements of CD8 T-cell kinetics in the lung compartment versus the lymphoid compartment (Fig. 2D and G). When we compared the kinetics of influenza virus-specific CD8 T cells in the lung compartment with that in the lymphoid compartment, we found that the CD8 T-cell count in the lung compartment was around 15% of that in the lymphoid compartment with a time delay of 0.5 day.
FIG. 2.

Model solution. (A to J) Numerical solutions of the model were compared with our new experimental data (influenza virus-specific CD8 T cells in the lung compartment) and published experimental data (viral load, CD8 T cells in the lymphatic compartment [spleen and lymph node]) (62), and other published data (10, 44). Viral load and influenza virus-specific CD8 T-cell kinetics are from C57BL/6 mice intranasally infected with 105 50% EID50 of influenza A/HKx31 as previously reported by our lab in reference 62. Viral titers in lungs were measured by hemagglutination assay, after expansion in embryonated eggs; the EID50 was calculated using the Reed-Muench equation. Influenza virus-specific CD8 T cells were detected via flow cytometry in the spleen, mediastinal LN, and lung by PE-conjugated H-2Db MHC class I/NP366-374 tetramer staining (62). We used a scale factor of 10 to extrapolate total influenza virus-specific CD8+ T-cell counts from NP366-374-specific CD8 T cells. G. T. Belz and W. R. Heath (Immunology Division, The Walter and Eliza Hall Institute of Medical Research, Melbourne, Victoria 3050, Australia) kindly provided us with raw data for the kinetics of virus-loaded DC in LN (see Fig. 1A in reference 10). Lymphatic compartment DC kinetics are from C57BL/6 mice intranasally infected with 102 PFU of HKx31 and determined in mediastinal LNs treated with collagenase/DNase to form single-cell suspensions which were then cultured with a lacZ-inducible hybridoma-specific for influenza virus NP and enumerated for β-galactosidase-producing cells (10). T. D. Randall (Trudeau Institute, Saranac Lake, NY) kindly provided raw data of the kinetics of serum antibody (see Fig. 5A in rerference 44). Serum antibody kinetics are from C57BL/6 mice intranasally infected with 100 egg infectious units of influenza A/PR8/34, and influenza virus-specific IgG titers were determined by enzyme-linked immunosorbent assay (44). (K) Viral kinetics were for different initial viral loads. As initial viral load increases, the peak viral load appears earlier. The initial slope of the ramp-up phase does not depend on the initial viral load. The analytical expression (see Materials and Methods) for the initial slope of the viral load increase (solid black line) was compared with the solutions. The model and a differential equation simulator (DEDiscover) is available for download at https://cbim.urmc.rochester.edu/software/dediscover/.
Equation 3 represents the kinetic changes in the virus population. Free influenza virions are produced from infected epithelial cells at a rate of πV per cell and are cleared nonspecifically at a rate of cV per virus. Free virions are also cleared by virus-specific immunoglobulin, A(t), with a rate constant of kv.
D in the equations refers to the function of APC that can become “professional” APC and activate “naïve” T and B cells to become effectors in the model. Out of conventional and plasmacytoid DC subsets, we consider the DC population which plays a role of presenting antigen (32, 81). Equation 4 describes the kinetics of immature DC, D, with the initial number of immature DC in the lymphatic compartment as D0. We assume that in the absence of infection, this level of DC is maintained as a constant, D0. Immature dendritic cells die either at a rate of δD or become virus-loaded DC at a rate constant of βD. Virus-loaded DC, D*, are cleared at the rate δD*. Here, the clearance of the virus-loaded DC includes the death of the cells and their migration into the lymphoid compartment.
In the lymphoid compartment, we describe the kinetics of immune cells as follows:
 |
(6) |
 |
(7) |
 |
(8) |
 |
(9) |
 |
(10) |
 |
(11) |
 |
(12) |
 |
(13) |
 |
(14) |
 |
(15) |
Dendritic cells are the major antigen-presenting cells in the lymphatic compartment (77). A recent study supported our model assumption that antigen presentation is mediated by DC subsets in the lymphatic compartment. Ingulli et al. observed that lymph node DC, not lung DC, presented OVA influenza virus antigen to naive CD8 T cells during the first 72 h after infection (41). Equation 6 describes the kinetics of DC maturation to become competent to activate naïve precursors to become cytotoxic, helper, or antibody-secreting cells. The parameter kD denotes the rate of maturation from virus-loaded APC to mature APC, which encompasses the rates of migration of virus-loaded DC to the lymphatic compartment, antigen processing, DC maturation, and antigen transfer to non-lung-derived DC. In addition, we denote τD as a time delay for the migration of antigen-loaded DC from the lung compartment, and the clearance rate of DM is denoted by δDM. It should also be noted that certain aspects of antigen presentation are not explicitly depicted in the model. For instance, it has been demonstrated that DC can transfer antigen to lymph node and spleen resident DC (10, 15, 45, 46), thereby increasing the number virus-loaded DC in the lymph nodes to a level greater than can be accounted for from the lung. Quantitatively, DC migrating from the respiratory tract to the draining lymph node represent only 1% to 3% of the total lymph node DC (45), with interaction between non-airway-derived DC and CD8 T cells reported (10). These aspects are effectively subsumed under the terms for DC maturation. DM is therefore a simplification designed to represent what is biologically a much more complicated and multicellular process.
Another assumption is that DC maturation and function are not dependent on feedback from CD4 T cells. Biologically, bidirectional CD4 T-cell-DC interactions may be important. For this reason, we explicitly modeled CD4 T-cell-mediated “licensing” of DC later. We denote τD as a time delay for the migration of antigen-loaded DC from the lung compartment. The clearance rate of DM is denoted by δDM.
Equation 7 describes the activation of naïve helper T cells, CD4 T cells, as HN, with a rate of πH(DM) and their clearance at a rate of δHN. The rate of the constant source of the naïve cells is described with δHNHN0. The mechanisms through which DC prime naïve T cells have been extensively studied (46). Since the priming of naïve CD4 T cells is initiated with contact between the naïve CD4 T cell and the antigen-presenting cell, we impose an activation profile, πH(DM) = πH1DM/(DM + πH2). The constant πH1 denotes the maximum activation rate, and the constant πH2 denotes the level of antigen-presenting cells which provides the half of the maximum activation rate. We introduce this nonlinear activation profile to reflect the limitation in the activation rate as the level of mature DC increases. The activated helper CD4 T cells, HE, proliferate at a rate of ρH(DM) = ρH1DM/(DM + ρH2), with the maximum proliferation rate, ρH1, and the level of mature DC needed for half-maximum activation, ρH2.To allow for memory effects, the clearance profile of HE is defined as δH(DM) = δH1DM/(DM + δH2); when antigen is not present, δH(DM) becomes zero, reflecting the persistence of HE. Effector CD4 T cells are cleared by death and migration out of the lymphoid compartment. The profiles of CD4 T-cell activation, proliferation, and clearance are assumed to be regulated by the number of mature antigen-presenting DC, rather than chosen as constants throughout the primary response. The kinetics of activation, proliferation, and clearance of CD8 T cells are modeled in a similar manner in equations 9 and 10. In particular, the clearance of antigen-specific CD8 cells includes a fraction of these cells that migrate from the lymphoid to the lung compartment with a time delay (see equation 2). This was done with the view that T-cell activation, expansion, and death are more dependent upon the availability of mature antigen-presenting cells than the amount of free virus present. Thus, we introduced nonlinear proliferation and clearance functions that depend on the number of mature DC. In addition, because of the difficulty in distinguishing activated and effector T cells from memory T cells by experimental measurements, a formal separation of the T cells that survive to form memory cells has been deliberately ignored. The decreased death rate of the memory T-cell population is modeled by using a DC-dependent death rate in our model. Note that when DM decreases, so does the death rate of T cells giving rise to a long-lived memory component.
Recently, activation of B cells via interaction with antigen-presenting cells has been described as a pathway for T-cell-independent B-cell activation (10, 44, 46, 64). In the model, mature DC can carry antigen to the lymph nodes for presentation to the naïve B cells. Activation of B cells hence depends on the level of mature DC and is described as similar to the case of CD4 and CD8 T-cell activation, by πB(DM) = πB1DM/(DM + πB2). We assume that the proliferation of activated B cells depends both on the numbers of mature DC and effector CD4 T cells, as in ρB(DM + hHE) = ρB1(DM + hHE)/(DM + hHE + ρB2) (42). This choice is driven by the observations that although the initiation of B-cell activation is mediated by soluble antigen with other viruses (59, 71), it is difficult to find substantial amounts of free virus in the lymph node during an infection with low-pathogenicity influenza A virus, such as the mouse-adapted X31 virus. This may change in other situations, and alternative model scenarios, such as direct activation of B cells by virus, are explicitly addressed below. We assume a constant clearance rate of activated B cells, δBA. In equation 12, the activated B-cell differentiates into short-lived plasma (antibody-secreting) cells, PS, at a rate of πS. Interactions between effector CD4 T cells and activated B cells, mediated in vivo by CD40-CD40L (42), cause the activated B cells to differentiate into long-lived plasma cells, PL, at a rate of πL. The short-lived plasma and long-lived plasma cells have clearance rates of δS and δL, respectively. We assume different antibody secretion efficiencies for short- and long-lived plasma cells, given by πAS and πAL, respectively. The clearance rate of antibody is δA.
Numerical integration method.
We solved the model equations numerically by using an ordinary differential equation solver that uses an implicit Adam's method or Gear's method, depending on whether the equation is stiff or not, and which also handles time delays by using a time increment of 0.0025 days (63).
Parameter selection.
The rate of infection of epithelial cells by unit influenza virus was chosen as 7 × 10⁻⁵ day−1 (EID50/ml)−1, which is comparable to the average infection rate estimated from the viral kinetics of experimentally infected adults (3). We assumed the death rate of infected epithelial cells, δE*, as 1.2 day−1, which is comparable to the estimated average life span of an infected epithelial cell, 1 day (83).
The initial numbers of naïve CD8 T cells, CD4 T cells, and B cells in the lymphatic compartment were each chosen as 103. The maximum proliferation rate of CD4 T cells (ρH1) was chosen as 1.51 day−1, which corresponds to a doubling time of 11 h (18), and the maximum proliferation rate of CD8 T cells was chosen as 2.6 day−1, which corresponds to a doubling time of 6.40 h. The constants πH1 and πT1 denote the maximum activation rates of naïve CD4 and CD8 T cells, respectively, and the constants πH2 and πT2 denote the levels of DC which provide the half-maximum activation rates of CD4 and CD8 T cells, respectively. We chose πH1 of 1.5 day−1, πH2 of 100 cells, πT1 of 3 day−1, and πT2 of 100 cells. The half-maximal rate was set as 100, based on the expected precursor frequencies of CD4 and CD8 T cells and that activation/expansion should begin 48 to 72 h after infection. Using these rates, a value of 100 cells for DM corresponds to initiation activation of CD4 and CD8 at around 2 days postinfection. With these choices, the peak number of the influenza virus-specific CD8 T cells is 4.1 × 10⁶ and that of CD4 T cells is 1.4 × 10⁵. This is consistent with the observation that during primary influenza virus infection, the magnitude of the virus-specific CD4+ T-cell response is approximately 10-fold lower in both frequency and number than that of the CD8+ response (16). Similar results have been reported in a Listeria spp. infection model, which suggests intrinsic differences in programming of CD4+ and CD8+ T-cell activation, proliferation, and effector function (29, 72).
We introduce the nonlinear activation profile to reflect the limitation in the activation rate as the level of mature DC increases. The clearance rate of HE is defined as δH(DM) = δH1DM/(DM + δH2), with the maximum death rate, δH1, of 0.4 day−1 and the level of mature DC needed for half-maximum death, δH2, of 1. The clearance rate of TE is defined as δT(DM) = δT1DM/(DM + δT2), with the maximum death rate, δT1, of 0.75 day−1 and the level of mature DC needed for half-maximum death, δT2, of 1. The clearance parameters for CD8 T cells used are the same ones as we used for helper T cells. The killing rate of CD8 T cells has been estimated as follows: a half-life of 1.4 h for lymphocytic choriomeningitis virus-positive target cells by CD8 T-cell-mediated elimination in vivo (5) suggests that  . During the primary infection, if we chose an overall number of effector CD8 T cells as 104 in the lung compartment, we estimated kE as 1.19 × 10⁻³ day−1. Although other estimates of the cytotoxic T-lymphocyte (CTL) killing rate of infected cells have been reported using different approaches under different viral infections (31, 66, 82), no estimate of the CTL killing rate for influenza virus infection is available. We adopted the earlier estimate in our simulation and then performed the sensitivity analysis for this parameter (along with other key parameters) (see Fig. 4, below). The clearance rate of antibodies was chosen as 0.04 day−1, which corresponds to a half-life of 17.3 days, which is around two times longer than the estimates of the serum IgG half-life in mice, 4 to 8 days (79, 80), under the assumption that decay would be slower in lung tissue.
FIG. 4.
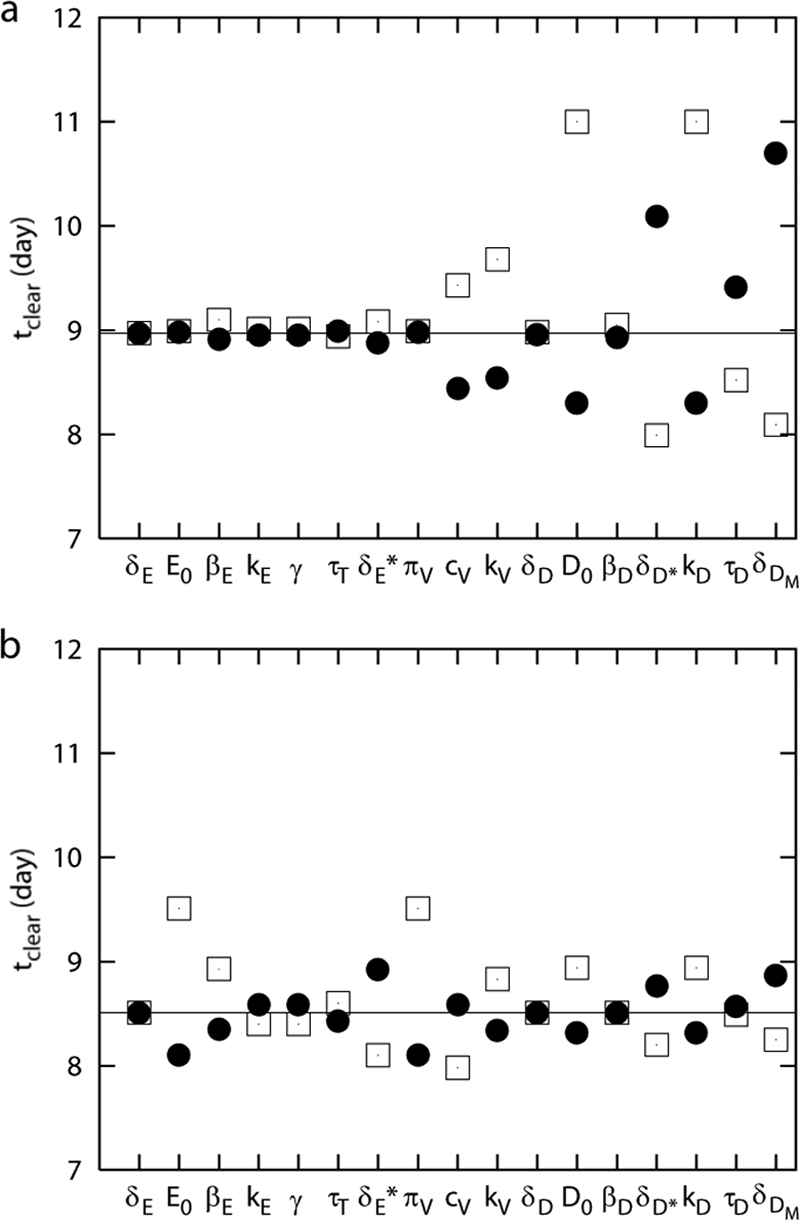
Sensitivity analysis. Data show the time to clear virus with a 50% increase (dots) or 50% decrease (squares) of each parameter in comparison with the control set of parameters (solid line) for the control model (a) and for the alternative model with the assumption of activation of B cells by the virus (b). (a) Changes in death rates of uninfected and infected epithelial cells (δE, δE*), initial level of uninfected epithelial cells (E0), infection rate of epithelial cells (βE), CD8 T-cell migration factor (γ), CD8 T-cell migration delay (τT), viral production rate (πv), rate of CD8 T-cell killing (kE), death rate of uninfected DC (δD), and infection rate of DC (βD) had minimal effects on time to viral clearance. An increase in the viral clearance rate (cv), the rate of antibody neutralization (kv), initial level of DC (D0), or the antigen processing rate (kD) significantly reduces the time to clear virus. Increase in the death rate of infected DC (δD*) or mature DC (δDM) or in the migration delay of virus-loaded DC (τD) significantly prolongs the infection (a). In the alternative model, each increase in the initial level of uninfected epithelial cells (E0) and in the rate of viral production (πv) results in the largest changes in the duration of infection.
The CD8 T-cell migration delay from lymphoid compartment to lung (τT) and the migration factor (γ) were chosen as 0.5 day and 0.15, respectively, by comparing experimental kinetics of antigen-specific CD8 T cells in the lung with that in the lymphoid compartment (Fig. 2d and g). We chose a viral clearance rate, cv, of 1 day−1, which is comparable to that from experiments suggesting that nonspecific physical removal (expulsion, phagocytosis, uptake by target cells, etc.) of infective virions takes 4 to 24 h (13).
All the other parameters were set to match the experimental kinetics of viral load (62), DC in the lymphoid compartment (10), and antibody (44) as well as to describe the deletion experiments of CD8 T cells, B cells, both CD8 and B cells, and CD4 T cells simultaneously with one set of parameters. Where parameter values were not available from the literature, values were selected to match reported data by first limiting values to a biologically plausible range and then fine-tuning values to achieve a good match to the data. Rigorous statistical estimates of kinetic parameters based on experimental data are needed. We are pursing these based on recently collected time series data by our laboratories, and these results will be reported in a future paper.
Slope of viral load and infected cell level increase.
At the initial stage of viral replication before CD8 T-cell and antibody responses, equations 1, 2, and 3 can be written as follows:
 |
(16) |
 |
(17) |
 |
(18) |
When the viral load is small, the uninfected epithelial cell number is approximately E0. If we assume Ep = E0, then equations 17 and 18 become the following linear two-variable system:
 |
(19) |
 |
(20) |
Solving the characteristic equation,
 |
(21) |
yields two eigenvalues
 |
(22) |
For the parameters given in Table 2, both eigenvalues are real, with one eigenvalue being positive and the other being negative. Let  be the eigenvectors corresponding to λ±, respectively. Solving
 |
(23) |
yields the two eigenvectors
 |
(24) |
where ω± = πv/(cv + λ±). Finally, we find
 |
(25) |
where from the initial conditions  and V(0) = V0, we calculate the constant c±, which is given by
  . From equation 25, the initial ramp-up slope, r, of both infected epithelial cells and viral load can be approximated by the positive eigenvalue,
 |
(26) |
Note that r does not depend on the initial viral load, as V0 does not appear in equation 26.
Antiviral drug responses.
We simulated the presence of an anti-IAV drug, such as amantadine (20), which blocks infection by reducing the rate of infection of epithelial cells, βE(1 −ɛ1)EpV in equations 1 and 2 (60):
 |
(27) |
 |
(28) |
for t > tdrug. Here, ɛ1 represents drug efficacy.
To simulate a drug with the drug efficacy ɛ2 that limits the production of viral particles, for instance, a neuraminidase inhibitor (blocking the release of newly formed virions) or RNA polymerase inhibitors (inhibiting IAV RNA replicative activity) (20), the equation for viral load in equation 3 is modified to the following (60):
 |
(29) |
The simulation of a therapy with both types of drugs is performed with the following equations after the drug administration time, t > tdrug,
 |
(30) |
 |
(31) |
 |
(32) |
RESULTS
Baseline solution of the model for intact mice.
We solved equations 1 to 15 and obtained numerical solutions with the initial values of variables and the parameter values specified in Tables 1 and 2, respectively. Figure 1 shows the flow chart of the model structure (see Materials and Methods). Figure 2 shows plots of all model variables over time for a baseline simulation. These are in good agreement with extant data regarding viral clearance, the peak of virus-loaded DC, and antigen-specific CD8 T cells (10, 44, 62). The peak of the viral load in lung is attained approximately 2 days after infection. The peak of virus-loaded DC in the lymphoid compartment appears around 3 days. The level of CD8 T cells in lung is around 15% of the level of CD8 T cells in the lymphatic compartment with a migration delay of 0.5 day (Fig. 2D and G). The level of serum antibody persists more than 100 days at a titer of around 1:104, consistent with the observation in reference 44 (Fig. 2J).
We next simulated different initial IAV inoculation doses, V0, from 0.01 to 10 EID50/ml (Fig. 2K). Consistent with an experimental report (46), a low viral inoculum delayed the time to peak pulmonary viral load and the magnitude of the peak was independent of the inoculation dose. The calculations for the initial ramp-up slopes of viral load and infected cell increases are presented in Materials and Methods.
Simulations of T- and B-cell depletion.
As a means to test the fidelity of the model assumptions and parameter values, various arms of the adaptive immune system were selectively reduced to zero at the start of the infection. For example, cytotoxic CD8 T cells (TE) are important for the clearance of primary influenza virus infection (84). Nevertheless, animal studies demonstrate that IAV clearance occurs in the absence of CD8 T cells (44, 54). Viral kinetics were modeled in the absence of effector CD8 T cells [TE(t) = 0 in equation 2] to simulate CD8 T-cell depletion. Figure 3c shows that infected cell clearance was delayed by around 7 days due to the absence of CD8 T-cell killing. Figure 3d shows that viral clearance was delayed by around 2 days, which is in agreement with experimental data from CD8-deficient mice (54).
FIG. 3.

Absence of each arm of the immune response. The kinetics of uninfected and infected epithelial cells are shown in the left panels (a, c, e, g, and i), viral load (EID50/ml) is shown in the right panels (b, d, f, h, and j); data for short-lived and long-lived plasma cells (k) and antibody titers (l) are also shown. The absence of CD8 T-cell response in primary influenza virus infection results in slower clearance of infected epithelial cells (c, compare with panel a) and delay of the viral clearance (d), compared to control observations (red dots in panel b). In the absence of an IAV-specific antibody response in primary influenza virus infection, the kinetics of infected, uninfected, and infected epithelial cells are not changed (a and e). However, the absence of antibodies results in slower viral clearance (d) than control observations. The absence of both CD8 T-cell and B-cell responses results in infected epithelial cells persisting longer (g) due to the lack of cytotoxic CD8 T-cell response and sustained viral load (h). In the absence of CD4 T-cell help, viral kinetics results in a 2-day delay in viral clearance (j). Differentiation of long-lived plasma cells does not occur without CD4 T-cell help (k), which results in decay of the antibody level without CD4 T-cell help (l). Red dots with standard deviations in panel l denote serum influenza virus-specific IgG kinetics from five MHC class II-deficient mice (see reference 44).
In the literature, there are conflicting reports on the outcome of influenza virus infection in the absence of B cells and antibody. In some studies, B-cell-deficient mice succumb to lower doses of IAV and have lower viral clearance rates than normal mice (33, 44). Characteristically, viral titers remain high and all mice die despite the large numbers of airway-resident, IAV-specific CD8 T cells (44). However, other studies have demonstrated clearance in the absence of B cells, with little mortality unless concurrent CD8 T-cell depletion exists (27). These studies used different strains of virus with different rates of replication. Therefore, we used the model to test the hypothesis that the difference in outcomes could be explained by differences in the efficiency of virus replication. In the baseline model, the rate of epithelial cell infection (βE) is 7 × 10⁻⁵ (EID50/ml)−1 day−1 (Table 2). When the absence of neutralizing antibody is simulated with A(t) = 0, virus clearance occurs within 14 to 15 days (Fig. 3e and f), and titers remain in the survival range described above. In contrast, a fourfold increase of the epithelial cell infection rate (βE) resulted in earlier appearance of virus and higher viral loads (105 EID50/ml), persisting around half a day longer than in the baseline simulation (data not shown). The model suggests one possible explanation for the disparate observations reported in the literature with respect to survival of B-cell-deficient mice, indicating that the outcome of infection in B-cell-deficient mice is a function of influenza virus strain virulence (79, 80, 83). In agreement with published data, our simulation of the absence of B and CD8 T cells results in persistence of viral loads for over 15 days after infection (Fig. 3g and h). Our model predicts that sustained high viral loads and mortality in B-cell-deficient mice is a function of IAV strain virulence, suggesting an explanation for the disparate experimental observations reported in the literature (79, 80, 83).
CD4 T cells are necessary for optimal B-cell activation, class switching, and development of long-lived memory B and plasma cells. Mice lacking CD40 or MHC class II (and functional CD4 T cells) produce detectable titers of influenza virus-specific IgG and recover from influenza virus infection in a manner similar to that of normal mice (44); however, they lack long-lived antibody-secreting cells and influenza virus-specific IgG at 60 days (44). Other studies also reported limited effects on virus clearance and development of a cytotoxic CD8 T-cell response in the lungs in CD4 T-cell-deficient mice (1, 76). The model distinguishes antibody-secreting cell differentiation with and without CD4 T-cell help by separating B-cell differentiation into either long-lived or short-lived plasma cells. In the absence of CD4 T-cell help, because interactions between CD4 T cells and activated B cells do not occur (equation 12, πLHEBA = 0), long-lived antibody-secreting cells do not develop (Fig. 3k), and the model accurately replicates the loss of virus-specific antibody with time (44). Consistent with experimental data (44), short-term IAV-specific antibody levels are sufficient for efficient viral clearance in primary IAV infection, even in the absence of long-lived plasma cells (Fig. 3j).
Sensitivity analysis.
Intensive sensitivity analyses can be performed in various ways (49, 56, 70). Here we performed a limited sensitivity analysis to determine which parameters might strongly influence the time to clear the virus. We increased or decreased each parameter by 50%, one at a time, and examined the effect on viral clearance. When we increased or decreased parameter values 10-fold, we obtained similar results (data not shown), although the magnitudes of changes were different.
Increasing the overall viral clearance rate (cv), the rate of antibody neutralization (kv), the initial level of DC (D0), or the antigen processing rate (kD) each accelerated viral clearance, while an increase in the death rate of infected DC (δD*), DC migration delay (τD), or the death rate of mature DC (δDM) prolonged infection. This amounts to an inability to control the infection. A decrease in the initial level of DC (D0) or the antigen processing rate (kD) increased the period of infection. This corresponds to a scenario occurring during superinfection with two pathogens, such that the depletion of APC by the first infection limits the ability to respond to the second pathogen. Whether or not this occurs requires direct experimentation. Viral clearance was not substantially affected by changes in death rates of uninfected and infected epithelial cells (δE and δE*) or the death rate of uninfected DC (δD). More surprisingly, little change occurred when the epithelial cell infection rate (βE), viral production rate (πv), or the rate of CD8 T-cell killing (kE) (Fig. 4a) were varied.
Though based on biological observation, the strong influence of parameters related to antigen presentation and activation of naïve T and B cells in the first model is a reflection of the model structure and assumptions. One of these is the assumption that naïve B cells “see” the virus when it is carried to the lymphatic compartment by activated, mature DC. One advantage of modeling is that it can be used to explicitly explore alternative biological scenarios. This model was thus restructured so that the activation of naïve B cells would be a direct function of free viral load, versus the presence of virus-loaded mature DC (Fig. 5). Under these conditions, B cells are directly activated by virus, and the proliferation of B cells is regulated by virus and helper T cells, by substituting πB(DM) and ρBA(DM + hHE) in Eq. 11 and 12 with πB(V) and ρBA(V + hHE), respectively. We chose the viral load for half maximal activation of naïve B cells as 5 × 10⁵ EID50/ml and viral load for half-maximal proliferation of activated B cells as 5 × 10² EID50/ml. In this case, the sensitivity analysis showed the largest changes in the duration of infection when we altered the initial level of uninfected cells (E0) and the virus production rate (πv) (Fig. 4b). The contributions of the DC parameters, such as the initial number of DC and death rates of mature and virus-loaded DC, were reduced (Fig. 4a and b). Although we do not know which model structure more accurately reflects the in vivo situation, these simulations suggest that the dependence on professional antigen-presenting cells may be reduced when virus can reach and trigger naive B cells directly.
CD4 T-cell licensing of dendritic cells.
In the first version of the model, both CD4 and CD8 naïve T cells are activated by mature, virus-loaded DC (Fig. 1). It has been shown that development of fully activated CD8 effectors and memory depend on CD4 T-cell-mediated help, administered through the DC in a process that has been termed licensing (9, 74). To explore the consequences of DC licensing by CD4+ T cells on model outcomes, we constructed an alternative model with a separate population of licensed DC (DL) added (Fig. 6). The kinetics of DL is given by
 |
(33) |
with πD(HN + HE) = πD1 × (HN + HE)/(HN + HE + πD2), where πD1 denotes the maximum maturation rate of DC through the interaction between helper T cells and DC (presumably via CD40 and CD40L binding) and πD2 is the level of naïve and effector helper T cells which provide the half-maximum maturation rate. We chose a πD1 of 100 day−1 and πD2 of 5 × 10³ to match with the kinetics of CD8 T cells in lung and lymphoid compartments in Fig. 2. The development of licensed DC therefore depends on the number of naïve and effector CD4 T cells. The level of interaction between DC and helper CD4+ T cells is controlled by changing the value of πD1.
FIG. 6.

Schematic representation of the alternative model with a separate population of licensed DC (DL) added. The blue lines denote the changes from the baseline model in Fig. 1.
The other change in the model is that activation, proliferation, and death of effector CD8 T cells are controlled by DL instead of DM in Equations 9 and 10. Under these conditions, the peak CD8 T-cell response is reduced as the maturation rate of DL is diminished. Under the baseline parameter values, a fivefold decrease in the maximum maturation rate of licensed DC reduces the peak level of CD8 T cells by 3 orders of magnitude. In this scenario, the CD8 T-cell response is much more dependent on CD4 T cells than in the initial version of the model, where the CD8 T cells do not require CD4 T-cell help. This supports the notion that suppressing the CD8 T-cell response could operate through inhibiting CD4 T-cell interactions with the DC. We simulated the depletion of CD4 T cells when CD8 T-cell priming depends only on licensed DC, which resulted in the failure to generate effector CD8 T cells and delayed viral clearance from 9 to 15 days.
Antiviral drugs.
One approach to controlling IAV infection is to administer antiviral drugs. Two types of drugs against influenza, M2 ion channel blockers and neuramidase inhibitors, are currently licensed. We first simulated the effect of a drug limiting epithelial cell infection (βE) like amantadine (20) (see Materials and Methods). When this type of drug with an efficacy, ɛ1, of 100%, which is not typically achievable in practice, is administered 1 day after the infection, peak viral load is reduced to 1.2 × 10⁴ EID50/ml from 2.5 × 10⁵ EID50/ml (Fig. 7). However administration on day 2 or later had little effect. Neuraminidase inhibitors block release of viral particles from the surface of infected cells, effectively reducing the production of virus (πv). A polymerase inhibitor would be also simulated in the same fashion by reducing the values of πv. When polymerase inhibitors with an efficacy, ɛ2, of 100% were administered 1 day after the infection, peak viral load decreased by a factor of 102. However administration on day 2 or later had little effect. Similar to clinical observations (20, 37, 53), a drug affecting virus production was only effective when administered within 2 days of infection (Fig. 7).
FIG. 7.

Drug responses. Viral kinetics with administration of a drug either limiting viral infection (amantadine), limiting viral production (neuraminidase inhibitor or RNA polymerase inhibitor), or both types of drugs. The timing of the administration of the drug since the infection is denoted by Tdrug (dashed line). The efficacy of drug limiting viral infection is denoted as ɛ1 and that of drug limiting viral production is denoted as ɛ2. Containment of viral spread is slightly enhanced when the drug limiting viral production is used. No differences in viral kinetics were observed under either condition when drug was administered 3 or more days after viral inoculation. Combination of both types of drugs can enhance viral clearance when they are administrated within 2 days.
Combination drug therapies have been effective with other viruses, such as HIV-1 (22), particularly to limit escape mutants, but have not been routinely used against influenza virus. We therefore examined whether combination therapy would hasten influenza virus clearance or allow delayed administration by simulating simultaneous administration of drugs that limit cell-to-cell transmission and viral replication. As expected and in contrast to each drug alone, combination therapy reduced peak viral load and accelerated viral clearance even when each drug was less than 100% efficient (ɛ1 = ɛ2 = 75%). However, the combination therapy still had to be introduced by day 2 to have any effect (Fig. 7). This is due to the fact that, unlike chronic HIV-1 infection, the acute nature of influenza virus infection means there is a narrow window of opportunity during early infection (<2 days) when interfering with virus replication can reduce viral load. After this time, target cell limitation and the immune response are the major factors controlling viral load.
Preexisting immunity.
Immune memory is the goal of vaccination, characterized by increased influenza virus neutralizing antibodies and virus-specific T cells (22). Although the model was not explicitly designed to deal with questions of memory and vaccination, we tested whether it could be used to compare, for example, having increased titers of neutralizing antibodies or numbers of virus-specific effector T cells at the start of the infection. Model simulations predict that viral load is inversely proportional to initial influenza virus-specific antibody titers (1:0 to 103), with failure to establish infection at titers greater than 1:105 (Fig. 8a). Next, influenza virus-specific CD8 T-cell memory was simulated by setting the initial level of effector CD8 T cells (TE) in the lymphoid compartment at the start of infection greater than zero. Here, viral clearance was enhanced as the number of initial IAV effector CD8 memory T cells increased and the viral titer peak was limited to less than 104 EID50/ml with 105 effector CD8 memory T cells in the lymphoid compartment at the beginning of secondary infection (Fig. 8a).
FIG. 8.

Immune memory response. (a) Kinetics of viral load in the secondary response with immune memory of antibody only (top left panel), CD8 T cells only (top right panel), and both antibody and CD8 T cells. The initial antibody titer is fixed as 102 and the initial effector CD8 T-cell level [TE(0)] is changed from 0 to 105 (bottom left panel). The initial antibody level is fixed as a 103 titer and the initial level of CD8 T cells is changed from 0 to 105 (bottom right panel). (b) Time to clear the virus (tclear) as a function of initial antibody titer, A(0), initial level of effector CD8 T cells, TE(0), initial level of airway/lung resident effector CD8 T cells, T*E(0), and initial level of effector CD4 T cells, HE(0). Time to clear the virus is defined as time for the viral load to reach 1 EID50/ml since infection. The light blue horizontal line indicates one-half the time to clear virus in the absence of any memory responses.
We examined whether a vaccine inducing both antibody and cytotoxic T-cell memory may be superior in limiting IAV infection. Given a suboptimal antibody titer (102), increased CD8 T cells enhance viral clearance compared to antibody alone (Fig. 8a) if the initial level of CD8 T cells is 105 or greater, suggesting that flu-specific CD8 T cells are important when antibody levels are low. When initial effector T-cell numbers are low (103), antibody titers of ≥103 still allow faster IAV clearance (Fig. 8a).
To compare the relative effectiveness of CD8 versus antibody memory on viral clearance, the time to clear virus (tclear, when the viral load is <1 EID50/ml after the peak) was plotted as the level of each immune memory component was changed (Fig. 8b). In the presence of anti-IAV antibody titers, A(0) greater than 102, tclear significantly decreases, and infection is abrogated when A(0) is ≥104. Increasing the levels of influenza virus-specific memory CD4 or CD8 T cells at day zero, HE(0) or TE(0), to very high levels (108) could only shorten tclear to 5.5 days, predicting that lymphoid T-cell memory has a limited effect, even at high frequencies. Analysis of the model structure suggests that these differences are due mainly to the delays in migration of effector CD8 T cells from the lymphoid compartment to the lung and in the production of antibody. In comparison, viral clearance is accelerated when effector CD8 T cells in the lung at the time of infection, T*E(0), are greater than 104 (Fig. 8b). This is equivalent to a situation in which local virus-specific effector memory T cells are present, an immune component known to be protective (24, 67). Interestingly, lung-resident memory/effector CD8 T cells as well as antibody could shorten the duration of infection to less than half the time of a naïve situation (4.6 days [Fig. 8b]). Our predictions imply effective immunity is conferred through either conventional vaccination designed to raise antibody titers or through vaccination designed to elicit lung-resident effector/memory CD8 T cells.
DISCUSSION
Our mathematical modeling of influenza virus infection had two primary goals: (i) to replicate the measured adaptive immune response to influenza virus in mathematical terms and (ii) to reveal unexpected outcomes or relationships, make predictions, and assess the relative importance of various biological parameters on the outcome of influenza virus infection. The model delineated in this report achieves both of these goals. In particular, the model suggests an explanation for the reported discrepancy in outcomes of influenza virus infection in B-cell-deficient mice. Changes in the model terms regulating the efficiency of viral replication altered the duration and peak of the virus load in the lung, shifting from survival to mortality. This is in agreement with experiments in which A/PR8 and A/JAPAN influenza viruses caused mortality in B-cell-deficient mice (33, 44) versus those in which mice inoculated with equivalent titers of the less pathogenic B/Ann Arbor virus effectively controlled the infection with little or no mortality (57). Although the replication rates for these viruses have not been directly measured, the observations and the model predictions are consistent with well-described differences in pathogenicity (26).
In addition, the model suggests that virulence may be a trait mediated through virally induced inhibition of antigen presentation. In the version of the model in which the adaptive response depends entirely on presentation of viral antigens by professional APC to T cells and B cells, changes in the parameters affecting the DC had a strong influence on the duration of infection. Similarly, the model suggests that a compensatory increase in the DC-mediated antigen presentation can compensate for the increased infection rate of highly virulent influenza virus strains. Indeed, experimental observations support that the early appearance of DC in draining lymph nodes is correlated with a more robust CD8 T-cell response (38). In the same vein, viral genes that affect innate recognition of the virus, such as NS1, also affect DC maturation and slow the antigen presentation rate (6, 28). Mutations in these genes are correlated with increased pathogenicity, as in the 1918 and H5N1 influenza virus strains (65, 73, 78). Similarly, a recent in vivo macaque study observed that suppression of NS1 function through mutation can accelerate immune responses (39).
When activation of naïve B cells is modeled to occur by direct virus recognition, the dependence of the B-cell and antibody responses on parameters that affect antigen presentation shift to those that regulate the production of virus. For influenza virus infection, it is currently unclear whether B cells are directly activated by free virus or by APC presentation of virus carried to lymph nodes by APC. Neither mechanism has been excluded, and the mode of B-cell priming may depend on the virus used in a particular experiment. For example, a virus that replicates rapidly and produces evidence of virus particles in the lymph nodes may be less dependent on cellular mechanisms of presentation than a virus that replicates slowly and is more restricted to the airways. Explicit experimentation will be needed to resolve these questions.
We recognize that this model has focused on the adaptive immune response to influenza virus and has not specifically delineated the contributions of the innate immune response. Rather, the contributions of innate immune mechanisms, such as macrophage/NK cell-mediated viral clearance and IFN-α/β induction and effects are contained within parameters that specify “other” nonspecific viral clearance mechanisms or effects on epithelial cell immunity to viral infection and replication. For example, one finding of the model is that antibody contributes little to viral clearance in a primary immune response against influenza virus but the model clearly predicts that CD8 killing of infected epithelial cells and other “nonantibody” viral clearance mechanisms predominate (cvV). These “nonantibody” viral clearance mechanisms likely include NK and macrophage mediated clearance. Further detailed experimental data are necessary to replace the umbrella parameter for “nonantibody” viral clearance (cv) with more specific parameters that address the quantitative contribution of such mechanisms. Because all ODE models of biological processes are simplifications and abstractions, such iterative refinements are the natural result of the interplay between the modeling process and the experimental design and findings.
The parameters affecting the generation of CD8 T-cell effectors were also modeled. In previously reported studies, depletion of CD4 T cells prior to infection had minimal impact on the generation of cytotoxic CD8 T cells that go to the airways (22), and these animals effectively control the virus without making a substantial neutralizing antibody response (12, 40, 76). In other systems, the development of CD8 effectors and durable, functional memory CD8 T cells is dependent on CD4 T-cell “help” for CD8 T cells, possibly mediated through the DC (12, 40, 76). Licensing of DC by the CD4 T cells is critical to convey sufficient activation and developmental signals to the CD8 T cells (2, 14, 74). When we simulated these two alternative versions of CD8 T-cell activation, we found that in the absence of CD4 T cells, only a minimal delay in virus clearance occurred when the CD8 T-cell activation depended only on mature DC alone. However, in a simulation where DC licensing was invoked, depletion of CD4 T cells resulted in a failure to generate effector CD8 T cells and prolonged infection. Although DC licensing is required for the priming of CD8 T-cell immunity to other viruses, such as herpes simplex virus (2, 74), in vivo experimental observations do not currently support this mechanism for influenza virus. Current information on T-cell help for CD8 responses suggests that CD4 T-cell help can be important for determining the quality of the memory response that mediates protection in a subsequent infection (36). In a response that involves strong inflammatory signals, such as influenza virus infection, DC licensing by CD4 T cells is probably not a major mechanism affecting either the total numbers of activated CD8 T cells during the primary response or the effectiveness of each CD8 T cell in killing infected cells.
Though not designed to replicate immune memory, the influenza virus model described was robust and flexible enough to account for the effects of preexisting immune memory on secondary infection, especially the importance of neutralizing antibodies. In addition to neutralizing antibodies, our model demonstrated the influence of effector CD8 T cells in the lung at the time of infection through accelerated clearance. Our results simulate observations that heterosubtypic immunity to influenza virus depends on the number of CD8 T cells in the airways at the start of infection (24, 25, 47, 65). These in vivo observations and in silico model predictions suggest that vaccine efficacy could be improved if designed to evoke local immune memory cells that were maintained long term at the local site rather than in the circulation, as well as robust neutralizing antibody titers.
Model simulations of current and potential antiviral agents predicted that lowering the viral load or spread within 2 days of infection allows the rapid control of the infection. These results match known limitations of neuraminidase inhibitors, which inhibits viral release by infected cells but are only effective when given within 2 days of symptom onset (20). The model predicts that combinations of drugs that both limit cell infection and viral production will be more effective than a neuraminidase inhibitor alone, but only if administered before the peak viremia. These outcomes emphasize the critical phase of intervention with antiviral drugs, the phase of viral replication, and spread.
We have constructed a mathematical model of influenza virus immunity that can act as a foundation for future modeling efforts. Our model, like all models and abstractions, is a simplification of a complex biological process. Its accuracy depends on the validity of the assumptions made in constructing the model, as well as the parameter values chosen to populate it. The fidelity of the model would no doubt be improved further by direct experimental verification of those parameters, especially those for which direct measurements were or are not available. These experiments are under way. It is also obvious that several of the model predictions will need to be experimentally tested. Nevertheless, these issues demonstrate the utility of modeling for challenging our assumptions, exploring alternative scenarios, and suggesting future experimentation. Much work remains in developing more detailed mathematical submodels of the innate immune response, DC maturation and antigen presentation, T helper differentiation, and memory, for example. These will add refinement and depth to the present macroscopic approach. These more detailed efforts will generate new predictions and therapeutic strategies to better understand and improve the host response to virus infection.
Acknowledgments
We thank G. Belz, W. Heath, and T. Randall for providing raw data from their previous publications for comparisons with model predictions.
This work was funded by National Institute of Allergy and Infectious Diseases contract N01-AI-50020. Portions of this work were done under the auspices of the U.S. Department of Energy under contract DE-AC52-06NA25396.
Footnotes
Published ahead of print on 13 May 2009.
REFERENCES
- 1.Allan, W., Z. Tabi, A. Cleary, and P. C. Doherty. 1990. Cellular events in the lymph node and lung of mice with influenza. Consequences of depleting CD4+ T cells. J. Immunol. 1443980-3986. [PubMed] [Google Scholar]
- 2.Ashton-Rickardt, P. G. 2004. A license to remember. Nat. Immunol. 51097-1098. [DOI] [PubMed] [Google Scholar]
- 3.Baccam, P., C. Beauchemin, C. A. Macken, F. G. Hayden, and A. S. Perelson. 2006. Kinetics of influenza A virus infection in humans. J. Virol. 807590-7599. [DOI] [PMC free article] [PubMed] [Google Scholar]
- 4.Bajaria, S. H., and D. E. Kirschner. 2005. CTL action during HIV-1, p. 219-254. In W.-T. Tan and H. Wu (ed.), Deterministic and stochastic models for AIDS epidemics and HIV infection with interventions. World Scientific Publisher, Hackensack, NJ.
- 5.Barchet, W., S. Oehen, P. Klenerman, D. Wodarz, G. Bocharov, A. L. Lloyd, M. A. Nowak, H. Hengartner, R. M. Zinkernagel, and S. Ehl. 2000. Direct quantitation of rapid elimination of viral antigen-positive lymphocytes by antiviral CD8+ T cells in vivo. Eur. J. Immunol. 301356-1363. [DOI] [PubMed] [Google Scholar]
- 6.Baskin, C. R., H. Bielefeldt-Ohmann, A. Garcia-Sastre, T. M. Tumpey, N. Van Hoeven, V. S. Carter, M. J. Thomas, S. Proll, A. Solorzano, R. Billharz, J. L. Fornek, S. Thomas, C. H. Chen, E. A. Clark, K. Murali-Krishna, and M. G. Katze. 2007. Functional genomic and serological analysis of the protective immune response resulting from vaccination of macaques with an NS1-truncated influenza virus. J. Virol. 8111817-11827. [DOI] [PMC free article] [PubMed] [Google Scholar]
- 7.Beauchemin, C., J. Samuel, and J. Tuszynski. 2005. A simple cellular automaton model for influenza A viral infections. J. Theor. Biol. 232223-234. [DOI] [PubMed] [Google Scholar]
- 8.Beauchemin, C. A., J. J. McSharry, G. L. Drusano, J. T. Nguyen, G. T. Went, R. M. Ribeiro, and A. S. Perelson. 2008. Modeling amantadine treatment of influenza A virus in vitro. J. Theor. Biol. 254439-451. [DOI] [PMC free article] [PubMed] [Google Scholar]
- 9.Behrens, G., M. Li, C. M. Smith, G. T. Belz, J. Mintern, F. R. Carbone, and W. R. Heath. 2004. Helper T cells, dendritic cells and CTL Immunity. Immunol. Cell Biol. 8284-90. [DOI] [PubMed] [Google Scholar]
- 10.Belz, G. T., C. M. Smith, L. Kleinert, P. Reading, A. Brooks, K. Shortman, F. R. Carbone, and W. R. Heath. 2004. Distinct migrating and nonmigrating dendritic cell populations are involved in MHC class I-restricted antigen presentation after lung infection with virus. Proc. Natl. Acad. Sci. USA 1018670-8675. [DOI] [PMC free article] [PubMed] [Google Scholar]
- 11.Belz, G. T., W. Xie, and P. C. Doherty. 2001. Diversity of epitope and cytokine profiles for primary and secondary influenza A virus-specific CD8+ T cell responses. J. Immunol. 1664627-4633. [DOI] [PubMed] [Google Scholar]
- 12.Bender, B. S., T. Croghan, L. Zhang, and P. A. Small, Jr. 1992. Transgenic mice lacking class I major histocompatibility complex-restricted T cells have delayed viral clearance and increased mortality after influenza virus challenge. J. Exp. Med. 1751143-1145. [DOI] [PMC free article] [PubMed] [Google Scholar]
- 13.Bocharov, G. A., and A. A. Romanyukha. 1994. Mathematical model of antiviral immune response. III. Influenza A virus infection. J. Theor. Biol. 167323-360. [DOI] [PubMed] [Google Scholar]
- 14.Bourgeois, C., B. Rocha, and C. Tanchot. 2002. A role for CD40 expression on CD8+ T cells in the generation of CD8+ T cell memory. Science 2972060-2063. [DOI] [PubMed] [Google Scholar]
- 15.Carbone, F. R., G. T. Belz, and W. R. Heath. 2004. Transfer of antigen between migrating and lymph node-resident DCs in peripheral T-cell tolerance and immunity. Trends Immunol. 25655-658. [DOI] [PubMed] [Google Scholar]
- 16.Chapman, T. J., M. R. Castrucci, R. C. Padrick, L. M. Bradley, and D. J. Topham. 2005. Antigen-specific and non-specific CD4+ T cell recruitment and proliferation during influenza infection. Virology 340296-306. [DOI] [PubMed] [Google Scholar]
- 17.Chen, W., P. A. Calvo, D. Malide, J. Gibbs, U. Schubert, I. Bacik, S. Basta, R. O'Neill, J. Schickli, P. Palese, P. Henklein, J. R. Bennink, and J. W. Yewdell. 2001. A novel influenza A virus mitochondrial protein that induces cell death. Nat. Med. 71306-1312. [DOI] [PubMed] [Google Scholar]
- 18.De Boer, R. J., D. Homann, and A. S. Perelson. 2003. Different dynamics of CD4+ and CD8+ T cell responses during and after acute lymphocytic choriomeningitis virus infection. J. Immunol. 1713928-3935. [DOI] [PubMed] [Google Scholar]
- 19.De Boer, R. J., M. Oprea, R. Antia, K. Murali-Krishna, R. Ahmed, and A. S. Perelson. 2001. Recruitment times, proliferation, and apoptosis rates during the CD8+ T-cell response to lymphocytic choriomeningitis virus. J. Virol. 7510663-10669. [DOI] [PMC free article] [PubMed] [Google Scholar]
- 20.De Clercq, E. 2006. Antiviral agents active against influenza A viruses. Nat. Rev. Drug Disc. 51015-1025. [DOI] [PMC free article] [PubMed] [Google Scholar]
- 21.Dibrov, B. F., M. A. Livshits, and M. V. Volkenstein. 1977. Mathematical model of immune processes. J. Theor. Biol. 65609-631. [DOI] [PubMed] [Google Scholar]
- 22.Doherty, P. C., D. J. Topham, R. A. Tripp, R. D. Cardin, J. W. Brooks, and P. G. Stevenson. 1997. Effector CD4+ and CD8+ T-cell mechanisms in the control of respiratory virus infections. Immunol. Rev. 159105-117. [DOI] [PubMed] [Google Scholar]
- 23.Duca, K. A., M. Shapiro, E. Delgado-Eckert, V. Hadinoto, A. S. Jarrah, R. Laubenbacher, K. Lee, K. Luzuriaga, N. F. Polys, and D. A. Thorley-Lawson. 2007. A virtual look at Epstein-Barr virus infection: biological interpretations. PLoS Pathog. 31388-1400. [DOI] [PMC free article] [PubMed] [Google Scholar]
- 24.Ely, K. H., L. S. Cauley, A. D. Roberts, J. W. Brennan, T. Cookenham, and D. L. Woodland. 2003. Nonspecific recruitment of memory CD8+ T cells to the lung airways during respiratory virus infections. J. Immunol. 1701423-1429. [DOI] [PubMed] [Google Scholar]
- 25.Ely, K. H., A. D. Roberts, and D. L. Woodland. 2003. Cutting edge: effector memory CD8+ T cells in the lung airways retain the potential to mediate recall responses. J. Immunol. 1713338-3342. [DOI] [PubMed] [Google Scholar]
- 26.Ennis, F. A., M. Verbonitz, P. Reichelderfer, and S. Daniel. 1976. Recombination of influenza A virus strains: effect on pathogenicity. Dev. Biol. Stand. 33220-225. [PubMed] [Google Scholar]
- 27.Epstein, S. L., C. Y. Lo, J. A. Misplon, and J. R. Bennink. 1998. Mechanism of protective immunity against influenza virus infection in mice without antibodies. J. Immunol. 160322-327. [PubMed] [Google Scholar]
- 28.Fernandez-Sesma, A., S. Marukian, B. J. Ebersole, D. Kaminski, M. S. Park, T. Yuen, S. C. Sealfon, A. Garcia-Sastre, and T. M. Moran. 2006. Influenza virus evades innate and adaptive immunity via the NS1 protein. J. Virol. 806295-6304. [DOI] [PMC free article] [PubMed] [Google Scholar]
- 29.Foulds, K. E., L. A. Zenewicz, D. J. Shedlock, J. Jiang, A. E. Troy, and H. Shen. 2002. Cutting edge: CD4 and CD8 T cells are intrinsically different in their proliferative responses. J. Immunol. 1681528-1532. [DOI] [PubMed] [Google Scholar]
- 30.Gabriel, G., M. Abram, B. Keiner, R. Wagner, H. D. Klenk, and J. Stech. 2007. Differential polymerase activity in avian and mammalian cells determines host range of influenza virus. J. Virol. 819601-9604. [DOI] [PMC free article] [PubMed] [Google Scholar]
- 31.Ganusov, V. V., and R. J. De Boer. 2008. Estimating in vivo death rates of targets due to CD8 T-cell-mediated killing. J. Virol. 8211749-11757. [DOI] [PMC free article] [PubMed] [Google Scholar]
- 32.GeurtsvanKessel, C. H., M. A. Willart, L. S. van Rijt, F. Muskens, M. Kool, C. Baas, K. Thielemans, C. Bennett, B. E. Clausen, H. C. Hoogsteden, A. D. Osterhaus, G. F. Rimmelzwaan, and B. N. Lambrecht. 2008. Clearance of influenza virus from the lung depends on migratory langerin+ CD11b− but not plasmacytoid dendritic cells. J. Exp. Med. 2051621-1634. [DOI] [PMC free article] [PubMed] [Google Scholar]
- 33.Graham, M. B., and T. J. Braciale. 1997. Resistance to and recovery from lethal influenza virus infection in B lymphocyte-deficient mice. J. Exp. Med. 1862063-2068. [DOI] [PMC free article] [PubMed] [Google Scholar]
- 34.Hancioglu, B., D. Swigon, and G. Clermont. 2007. A dynamical model of human immune response to influenza A virus infection. J. Theor. Biol. 24670-86. [DOI] [PubMed] [Google Scholar]
- 35.Handel, A., I. M. Longini, Jr., and R. Antia. 2007. Neuraminidase inhibitor resistance in influenza: assessing the danger of its generation and spread. PLoS Comput. Biol. 3e240. [DOI] [PMC free article] [PubMed] [Google Scholar]
- 36.Harty, J. T., and V. P. Badovinac. 2008. Shaping and reshaping CD8+ T-cell memory. Nat. Rev. Immunol. 8107-119. [DOI] [PubMed] [Google Scholar]
- 37.Hayden, F. G., A. D. Osterhaus, J. J. Treanor, D. M. Fleming, F. Y. Aoki, K. G. Nicholson, A. M. Bohnen, H. M. Hirst, O. Keene, K. Wightman, et al. 1997. Efficacy and safety of the neuraminidase inhibitor zanamivir in the treatment of influenza virus infections. N. Engl. J. Med. 337874-880. [DOI] [PubMed] [Google Scholar]
- 38.Hayman, A., S. Comely, A. Lackenby, L. C. Hartgroves, S. Goodbourn, J. W. McCauley, and W. S. Barclay. 2007. NS1 proteins of avian influenza A viruses can act as antagonists of the human alpha/beta interferon response. J. Virol. 812318-2327. [DOI] [PMC free article] [PubMed] [Google Scholar]
- 39.Hogan, R. J., E. J. Usherwood, W. Zhong, A. A. Roberts, R. W. Dutton, A. G. Harmsen, and D. L. Woodland. 2001. Activated antigen-specific CD8+ T cells persist in the lungs following recovery from respiratory virus infections. J. Immunol. 1661813-1822. [DOI] [PubMed] [Google Scholar]
- 40.Hou, S., P. C. Doherty, M. Zijlstra, R. Jaenisch, and J. M. Katz. 1992. Delayed clearance of Sendai virus in mice lacking class I MHC-restricted CD8+ T cells. J. Immunol. 1491319-1325. [PubMed] [Google Scholar]
- 41.Ingulli, E., C. Funatake, E. L. Jacovetty, and M. Zanetti. 2009. Cutting edge: antigen presentation to CD8 T cells after influenza A virus infection. J. Immunol. 18229-33. [DOI] [PubMed] [Google Scholar]
- 42.Klaus, S. J., L. M. Pinchuk, H. D. Ochs, C. L. Law, W. C. Fanslow, R. J. Armitage, and E. A. Clark. 1994. Costimulation through CD28 enhances T cell-dependent B cell activation via CD40-CD40L interaction. J. Immunol. 1525643-5652. [PubMed] [Google Scholar]
- 43.Kochs, G., A. Garcia-Sastre, and L. Martinez-Sobrido. 2007. Multiple anti-interferon actions of the influenza A virus NS1 protein. J. Virol. 817011-7021. [DOI] [PMC free article] [PubMed] [Google Scholar]
- 44.Lee, B. O., J. Rangel-Moreno, J. E. Moyron-Quiroz, L. Hartson, M. Makris, F. Sprague, F. E. Lund, and T. D. Randall. 2005. CD4 T cell-independent antibody response promotes resolution of primary influenza infection and helps to prevent reinfection. J. Immunol. 1755827-5838. [DOI] [PubMed] [Google Scholar]
- 45.Legge, K. L., and T. J. Braciale. 2003. Accelerated migration of respiratory dendritic cells to the regional lymph nodes is limited to the early phase of pulmonary infection. Immunity 18265-277. [DOI] [PubMed] [Google Scholar]
- 46.Legge, K. L., and T. J. Braciale. 2005. Lymph node dendritic cells control CD8+ T cell responses through regulated FasL expression. Immunity 23649-659. [DOI] [PubMed] [Google Scholar]
- 47.Liang, S., K. Mozdzanowska, G. Palladino, and W. Gerhard. 1994. Heterosubtypic immunity to influenza type A virus in mice. Effector mechanisms and their longevity. J. Immunol. 1521653-1661. [PubMed] [Google Scholar]
- 48.Marchuk, G. I. 1997. Mathematical modelling of immune response in infectious disease, MIA, vol. 395. Kluwer Academic Publishers, Dordrecht, The Netherlands.
- 49.Marino, S., I. B. Hogue, C. J. Ray, and D. E. Kirschner. 2008. A methodology for performing global uncertainty and sensitivity analysis in systems biology. J. Theor. Biol. 254178-196. [DOI] [PMC free article] [PubMed] [Google Scholar]
- 50.McCown, M. F., and A. Pekosz. 2006. Distinct domains of the influenza a virus M2 protein cytoplasmic tail mediate binding to the M1 protein and facilitate infectious virus production. J. Virol. 808178-8189. [DOI] [PMC free article] [PubMed] [Google Scholar]
- 51.McCown, M. F., and A. Pekosz. 2005. The influenza A virus M2 cytoplasmic tail is required for infectious virus production and efficient genome packaging. J. Virol. 793595-3605. [DOI] [PMC free article] [PubMed] [Google Scholar]
- 52.Mohler, L., D. Flockerzi, H. Sann, and U. Reichl. 2005. Mathematical model of influenza A virus production in large-scale microcarrier culture. Biotechnol. Bioengin. 9046-58. [DOI] [PubMed] [Google Scholar]
- 53.Monto, A. S., D. M. Fleming, D. Henry, R. de Groot, M. Makela, T. Klein, M. Elliott, O. N. Keene, and C. Y. Man. 1999. Efficacy and safety of the neuraminidase inhibitor zanamivirin the treatment of influenza A and B virus infections. J. Infect. Dis. 180254-261. [DOI] [PubMed] [Google Scholar]
- 54.Mozdzanowska, K., K. Maiese, and W. Gerhard. 2000. Th cell-deficient mice control influenza virus infection more effectively than Th- and B cell-deficient mice: evidence for a Th-independent contribution by B cells to virus clearance. J. Immunol. 1642635-2643. [DOI] [PubMed] [Google Scholar]
- 55.Nowak, M. A., A. L. Lloyd, G. M. Vasquez, T. A. Wiltrout, L. M. Wahl, N. Bischofberger, J. Williams, A. Kinter, A. S. Fauci, V. M. Hirsch, and J. D. Lifson. 1997. Viral dynamics of primary viremia and antiretroviral therapy in simian immunodeficiency virus infection. J. Virol. 717518-7525. [DOI] [PMC free article] [PubMed] [Google Scholar]
- 56.Oakley, J. E., and A. O'Hagan. 2004. Probabilistic sensitivity analysis of complex models: a Bayesian approach. J. R. Stat. Soc. B 66751-769. [Google Scholar]
- 57.Obenauer, J. C., J. Denson, P. K. Mehta, X. Su, S. Mukatira, D. B. Finkelstein, X. Xu, J. Wang, J. Ma, Y. Fan, K. M. Rakestraw, R. G. Webster, E. Hoffmann, S. Krauss, J. Zheng, Z. Zhang, and C. W. Naeve. 2006. Large-scale sequence analysis of avian influenza isolates. Science 3111576-1580. [DOI] [PubMed] [Google Scholar]
- 58.Palese, P. 2004. Influenza: old and new threats. Nat. Med. 10S82-S87. [DOI] [PubMed] [Google Scholar]
- 59.Pape, K. A., D. M. Catron, A. A. Itano, and M. K. Jenkins. 2007. The humoral immune response is initiated in lymph nodes by B cells that acquire soluble antigen directly in the follicles. Immunity 26491-502. [DOI] [PubMed] [Google Scholar]
- 60.Perelson, A. S., and P. Nelson. 1999. Mathematical analysis of HIV-1 dynamics in vivo. SIAM Rev. 413-44. [Google Scholar]
- 61.Perelson, A. S., A. U. Neumann, M. Markowitz, J. M. Leonard, and D. D. Ho. 1996. HIV-1 dynamics in vivo: virion clearance rate, infected cell life-span, and viral generation time. Science 2711582-1586. [DOI] [PubMed] [Google Scholar]
- 62.Polakos, N. K., I. Klein, M. V. Richter, D. M. Zaiss, M. Giannandrea, I. N. Crispe, and D. J. Topham. 2007. Early intrahepatic accumulation of CD8+ T cells provides a source of effectors for nonhepatic immune responses. J. Immunol. 179201-210. [DOI] [PubMed] [Google Scholar]
- 63.Press, W. H., B. P. Flannery, S. A. Teukolsky, and W. T. Vetterling. 1992. Numerical recipes in C: the art of scientific computing, 2nd ed. Cambridge University Press, Cambridge, England.
- 64.Qi, H., J. G. Egen, A. Y. Huang, and R. N. Germain. 2006. Extrafollicular activation of lymph node B cells by antigen-bearing dendritic cells. Science 3121672-1676. [DOI] [PubMed] [Google Scholar]
- 65.Ray, S. J., S. N. Franki, R. H. Pierce, S. Dimitrova, V. Koteliansky, A. G. Sprague, P. C. Doherty, A. R. de Fougerolles, and D. J. Topham. 2004. The collagen binding α1β1 integrin VLA-1 regulates CD8 T cell-mediated immune protection against heterologous influenza infection. Immunity 20167-179. [DOI] [PubMed] [Google Scholar]
- 66.Regoes, R. R., D. L. Barber, R. Ahmed, and R. Antia. 2007. Estimation of the rate of killing by cytotoxic T lymphocytes in vivo. Proc. Natl. Acad. Sci. USA 1041599-1603. [DOI] [PMC free article] [PubMed] [Google Scholar]
- 67.Richter, M. V., and D. J. Topham. 2007. The alpha1beta1 integrin and TNF receptor II protect airway CD8+ effector T cells from apoptosis during influenza infection. J. Immunol. 1795054-5063. [DOI] [PubMed] [Google Scholar]
- 68.Rundell, A., R. DeCarlo, H. HogenEsch, and P. Doerschuk. 1998. The humoral immune response to Haemophilus influenzae type B: a mathematical model based on T-zone and germinal center B-cell dynamics. J. Theor. Biol. 194341-381. [DOI] [PubMed] [Google Scholar]
- 69.Salomon, R., J. Franks, E. A. Govorkova, N. A. Ilyushina, H. L. Yen, D. J. Hulse-Post, J. Humberd, M. Trichet, J. E. Rehg, R. J. Webby, R. G. Webster, and E. Hoffmann. 2006. The polymerase complex genes contribute to the high virulence of the human H5N1 influenza virus isolate A/Vietnam/1203/04. J. Exp. Med. 203689-697. [DOI] [PMC free article] [PubMed] [Google Scholar]
- 70.Saltelli, A., S. Tarantola, et al. 1999. A quantitative model independent method for global sensitivity analysis of model output. Technometrics 4139-56. [Google Scholar]
- 71.Scandella, E., K. Fink, T. Junt, B. M. Senn, E. Lattmann, R. Forster, H. Hengartner, and B. Ludewig. 2007. Dendritic cell-independent B cell activation during acute virus infection: a role for early CCR7-driven B-T helper cell collaboration. J. Immunol. 1781468-1476. [DOI] [PubMed] [Google Scholar]
- 72.Seder, R. A., and R. Ahmed. 2003. Similarities and differences in CD4+ and CD8+ effector and memory T cell generation. Nat. Immunol. 4835-842. [DOI] [PubMed] [Google Scholar]
- 73.Seo, S. H., E. Hoffmann, and R. G. Webster. 2002. Lethal H5N1 influenza viruses escape host anti-viral cytokine responses. Nat. Med. 8950-954. [DOI] [PubMed] [Google Scholar]
- 74.Smith, C. M., N. S. Wilson, J. Waithman, J. A. Villadangos, F. R. Carbone, W. R. Heath, and G. T. Belz. 2004. Cognate CD4+ T cell licensing of dendritic cells in CD8+ T cell immunity. Nat. Immunol. 51143-1148. [DOI] [PubMed] [Google Scholar]
- 75.Talon, J., M. Salvatore, R. E. O'Neill, Y. Nakaya, H. Zheng, T. Muster, A. Garcia-Sastre, and P. Palese. 2000. Influenza A and B viruses expressing altered NS1 proteins: a vaccine approach. Proc. Natl. Acad. Sci. USA 974309-4314. [DOI] [PMC free article] [PubMed] [Google Scholar]
- 76.Tripp, R. A., S. R. Sarawar, and P. C. Doherty. 1995. Characteristics of the influenza virus-specific CD8+ T cell response in mice homozygous for disruption of the H-2lAb gene. J. Immunol. 1552955-2959. [PubMed] [Google Scholar]
- 77.Trombetta, E. S., and I. Mellman. 2005. Cell biology of antigen processing in vitro and in vivo. Annu. Rev. Immunol. 23975-1028. [DOI] [PubMed] [Google Scholar]
- 78.Twu, K. Y., R. L. Kuo, J. Marklund, and R. M. Krug. 2007. The H5N1 influenza virus NS genes selected after 1998 enhance virus replication in mammalian cells. J. Virol. 818112-8121. [DOI] [PMC free article] [PubMed] [Google Scholar]
- 79.Vieira, P., and K. Rajewsky. 1986. The bulk of endogenously produced IgG2a is eliminated from the serum of adult C57BL/6 mice with a half-life of 6-8 days. Eur. J. Immunol. 16871-874. [DOI] [PubMed] [Google Scholar]
- 80.Vieira, P., and K. Rajewsky. 1988. The half-lives of serum immunoglobulins in adult mice. Eur. J. Immunol. 18313-316. [DOI] [PubMed] [Google Scholar]
- 81.Wolf, A. I., D. Buehler, S. E. Hensley, L. L. Cavanagh, E. J. Wherry, P. Kastner, S. Chan, and W. Weninger. 2009. Plasmacytoid dendritic cells are dispensable during primary influenza virus infection. J. Immunol. 182871-879. [DOI] [PubMed] [Google Scholar]
- 82.Yates, A., F. Graw, D. L. Barber, R. Ahmed, R. R. Regoes, and R. Antia. 2007. Revisiting estimates of CTL killing rates in vivo. PLoS ONE 2e1301. [DOI] [PMC free article] [PubMed] [Google Scholar]
- 83.Zdanov, V. M., and A. G. Bukrinskaja. 1969. Myxoviruses reproduction. Medicina, Moscow, Russia.
- 84.Zinkernagel, R. M., and P. C. Doherty. 1979. MHC-restricted cytotoxic T cells: studies on the biological role of polymorphic major transplantation antigens determining T-cell restriction-specificity, function, and responsiveness. Adv. Immunol. 2751-177. [DOI] [PubMed] [Google Scholar]