Abstract
Networks describe a variety of interacting complex systems in social science, biology, and information technology. Usually the nodes of real networks are identified not only by their connections but also by some other characteristics. Examples of characteristics of nodes can be age, gender, or nationality of a person in a social network, the abundance of proteins in the cell taking part in protein-interaction networks, or the geographical position of airports that are connected by directed flights. Integrating the information on the connections of each node with the information about its characteristics is crucial to discriminating between the essential and negligible characteristics of nodes for the structure of the network. In this paper we propose a general indicator Θ, based on entropy measures, to quantify the dependence of a network's structure on a given set of features. We apply this method to social networks of friendships in U.S. schools, to the protein-interaction network of Saccharomyces cerevisiae and to the U.S. airport network, showing that the proposed measure provides information that complements other known measures.
Keywords: entropy, inference, social networks, communities
Networks have become a general tool for describing the structure of interaction or dependencies in such disparate systems as cell metabolism, the internet, and society (1–5). Loosely speaking, the topology of a given network can be thought of as the byproduct of chance and necessity (6), where functional aspects and structural features are selected in a stochastic evolutionary process. The issue of separating “chance” from “necessity” in networks has attracted much interest. This entails understanding random network ensembles (i.e., chance) and their inherent structural features (7–9) but also developing techniques to infer structural and functional characteristics on the basis of a given network's topology. Examples go from inference of gene function from protein-interaction networks (10) to the detection of communities in social networks (11, 12). Community* detection, for example, aims at uncovering a hidden classification of nodes, and a variety of methods have been proposed relying on (i) structural properties of the network [betweenness centrality (13), modularity (14), spectral decomposition (15), cliques (16), and hierarchical structure (17)], (ii) statistical methods (18), or (iii) processes defined on the network (9, 19). Implicitly, each of these methods relies on a slightly different understanding of what a community is. Furthermore, there are intrinsic limits to detection; often the outcome depends on the algorithm and a clear assessment of the role of chance is possible in only a few cases (see, e.g., refs. 9 and 20).
As a matter of fact, in several cases, a great deal of additional information, beyond the network topology, is known about the nodes. This comes in the form of attributes such as age, gender, and ethnic background in social networks or annotations of known functions for genes and proteins. Sometimes this information is incomplete, so it is legitimate to attempt to estimate missing information from the network's structure. But often, the empirical data on the network are no more reliable or complete than those on the attributes of the nodes. In such cases, it may be more informative to ask what the functions or attributes of the nodes tell us about the network than the other way around. In this article we propose an indicator Θ that quantifies how much the topology of a network depends on a particular assignment of node characteristics. This provides an information bound that can be used as a benchmark for feature-extraction algorithms. This exercise, as we shall see, can also reveal statistical regularities that shed light on possible mechanisms underlying the network's stability and formation.
In the following, we first define Θ, and then we investigate separately the case in which node characteristic assignment induces a community structure on the network and the case in which the assignment corresponds to a position of the nodes in some metric space. We will calculate Θ for benchmarks and for examples of social, biological, and economics networks.
Definition of Θ
We shall first give a description of our indicator Θ in a simple case study and then give a general abstract definition.
Let us consider the specific problem of evaluating the significance of the network community structure induced by the assignment of a characteristic q i ∈ {1,…,Q}, to each node i ∈{1,…,N} of a network of N nodes. Individual nodes are characterized by their degree k i, which is the number of links they have to other nodes in the network. The network g is fully specified by the adjacency matrix taking values g i,j = 1 if nodes i and j are linked and 0 otherwise. The community structure induced by the assignment q i on the network is described by a matrix A of elements A(q,q′) indicating the total number of links between nodes with characteristics q and q′. A natural measure of the significance of the induced community structure q→; on the network g is provided by the number of graphs g′ between those individual nodes (characterized by the degree sequence ) that are consistent with A. The logarithm of this number is the entropy (21, 22) of the distribution that assigns equal weight to each graph g with the same and . This number also depends on the degree sequence and the relative frequency of different values of q across the population. These systematic effects are removed considering the entropy obtained from a random permutation of the assignments, where {π(i),i = 1,…,N} is a random permutation of the integers i ∈ {1,…,N}. The indicator Θ is obtained as the standardized deviation of from the entropy of networks with randomized assignments:
 |
where E π[…] stands for the expected value of over random uniform permutations of the assignments. In words, Θ measures the specificity of the network g for the particular assignment , with respect to assignments obtained by a random permutation.
The indicator Θ can be similarly defined in a much more general setting, with the following abstract definition: Let g ∈ GN be the network we are interested in, where N is the number of vertices and g i,j is the adjacency matrix. GN is the set of all graphs of N vertices. An assignment is a vector , such that for each node i, q i ∈ Q is defined on a set Q of possible characteristics, given by the context. Call Q = Q N the set of all possible such vectors on Q. A feature is a mapping ϕ : GN × Q → Φ, which associates to each graph g and assignment a graph feature . As will become clear, we do not need any assumption about the topology of the set of features Φ.
A simple example of features is those which do not depend on any assignment [ϕ(g,q) = ϕ(g)], such as the number of edges or the degree sequence. Instead, the previously introduced community structure A is an example of a feature depending both on the degree sequence and on the assignment , i.e. .*
In order to assess the relevance of a feature , we make use of the entropy of randomized network ensembles (21, 22). The entropy of the ensemble of graphs with feature is defined as the normalized logarithm of the number of possible graphs, consistent with and normalized by N:†
This quantity evaluates the level of randomness that is present in the ensemble of networks with a given feature. The numerical evaluation of the entropy is a very challenging problem. On the contrary, this quantity can be theoretically calculated by introducing a partition function in a statistical mechanics formalism and evaluating it by saddle point approximation [see supporting information (SI) Text for the equations and the codes for the evaluation of Σ]. Finally, with the same notations used above, the indicator Θ is defined as
 |
The quantity Θ provides a measure of the relevance of a given feature ϕ(g,q) for the structure of the network. Although Σϕ(g,q) can be obtained in analytic form, the average and the standard deviation over permutations require a random sampling of the space of possible permutations of the characteristics. In practice, N samp random permutations are drawn in order to estimate the expected value and the variance of in Eq. 3. Furthermore, the maximal deviation of from the expected value provides an estimate of the confidence interval at probability p = 1/N samp.‡
Besides the value of Θ, our approach also provides more detailed information. Technically, this is extracted from the saddle point values of the Lagrange multipliers introduced in the calculation of Σϕ(g,q) in order to enforce the constraints (see SI). In the examples discussed below, this information is encoded in the probability that a node i is linked to a node j in an ensemble with a given feature . This is given by
The value of the “hidden variables” and the statistical weight W(q,q′) can be inferred from the real data (21, 22). Therefore the function W(q i,q j) can shed light on the dependence of the probability of a link between nodes i and j, on their assignments q i and q j.
Application to Networks with a Community Structure
In the following, we will describe how to measure Θ for assessing the relevance of a community structure. First, we analyze the behavior of Θ on synthetic datasets. These have been used as benchmarks for community detection algorithms (9, 14). For these benchmarks, we find that Θ increases with the number N of vertices, reflecting the intuitive idea that larger graphs can resolve finer information on the global architecture of the network. We shall see that even in the region where community detection algorithms fail, there is a detectable influence of community structure on the topology of the network. Next, we apply this tool to a social network and a biological network. In particular, we will consider a dataset of friendship networks in U.S. schools and a network of high-confidence protein–protein interaction (23). The dataset of friendship networks in U.S. schools, which includes 84 schools, is particularly suitable for contrasting the information gained from Θ to that derived from other indicators, such as modularity (14). We will show that, at least in this case study, the information provided by Θ is of a different nature and more detailed than that provided by other measures.
As discussed above, in this section, we shall take q i ∈{1,…,Q} to be the label of the class which node i belongs to, with .§ The feature specifies the degree sequence and the number A(q,q′) of links between nodes in communities q and q′. Finally, we calculate the indicator Θ defined in Eq. 3 for the different cases.
Evaluation of Θ on Benchmarks.
We evaluate Θ on the benchmark random networks, originally proposed in refs. 9 and 14, of N = 128,256,512 nodes divided into 4 communities of equal size with fixed average connectivity , varying the average degree towards different communities.
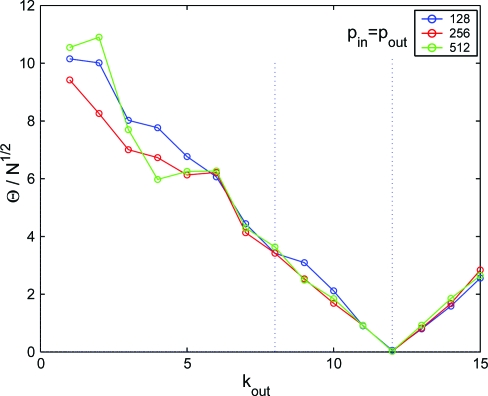
The results are shown in Fig. 1. This shows that, for a fixed structure, Θ for different values of N nicely collapses on a single curve when rescaled by the factor . This suggests that the size dependence of Θ results from the random fluctuations of the intensive quantity . Hence the same scaling is expected in general, in not too heterogeneous systems.¶
Fig. 1.
The dependence of Θ on k out in random networks of N = 128,256,512 nodes with 4 equal size communities and average connectivity (each point is obtained as an average over 10 realizations). To be compared with Figure 7 in ref. 14 and Figure 10 in ref. 9.
Second, Fig. 1 shows that Θ vanishes only when there is no distinction in linking probabilities: With 4 groups this occurs when , which is larger than the value where community detection algorithms fail (9, 14). Indeed, community detection can be seen as the inverse problem to that addressed here. In this spirit, Θ provides an a priori bound on the possibility of detecting communities in networks, as well as a universal indicator of the performance of different algorithms.
Dataset of Friendship Networks in U.S. Schools.
We apply our method to a dataset of 84 U.S. schools in which students were asked to provide information about themselves (among other things specifying in particular sex, age, and ethnic background) together with the names of up to 5 of their female friends and up to 5 of their male friends. Although the networks are directed in origin, in our analysis, in order to simplify study, we consider them as undirected, where each undirected link is present if at least 1 of the 2 students has indicated the linked one as his/her friend. The maximal connectivity of these networks is k = 16, reached only in rare cases. This dataset is particularly interesting for the study of homophily in American schools (24–26).
We have measured the value of Θ associated with the community structure induced by the self-reported ethnic background (there were 6 possibilities in the questionnaire: Q = 6) in all the 84 schools of the dataset. Loosely speaking, in this case Θ measures the extent to which ethnic background shapes the social network of friendship in U.S. schools.
For 25% of the schools we find that Θ is not significant, at the 5% confidence level. For the rest of the dataset, Θ takes widely scattered values across schools (up to Θ ≃ 532). In order to asses how much the variation in Θ correlates with ethnic diversity, we take, as a measure of diversity in the assignment , the Shannon entropy
 |
where x q is the fraction of nodes with q i = q. We remark that the Shannon entropy S of a partition measures the diversity in the population but does not contain any information on the social network.
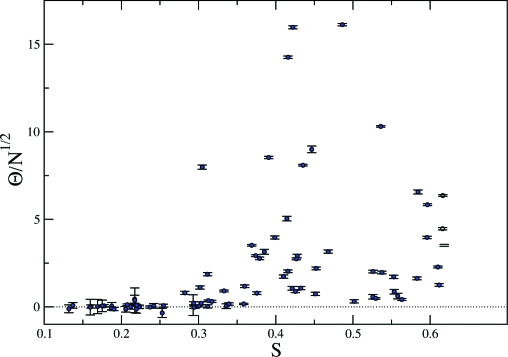
In Fig. 2 we report the dependence of Θ on S. We observe that the value of is small and not statistically significant in ethnically uniform schools (S < 0.3) but it grows larger and significant for schools with a stronger diversity. The largest values of Θ, as well as the largest spread, occur for intermediate values of S (0.4 ÷ 0.5), suggesting a nontrivial dependence. In order to asses the statistical relevance of this result, we have studied the dependence of Θ on S in benchmark synthetic networks, such as the ones presented above, where the fraction of links within the community of each individual is kept constant, but the relative sizes of communities are varied. A much weaker, barely significant increase of Θ with S was found in synthetic networks, hinting that a nontrivial interplay between homophily and diversity might be responsible for the features observed in Fig. 2.
Fig. 2.
Relation between , which captures the relevance of ethnic background for friendship networks, and the Shannon entropy S, indicating the ethnic diversity of the student population. Each point corresponds to a different U.S. school in the dataset. Error bars indicate 5% confidence intervals.
A popular measure for community structure, frequently used in the literature, is modularity, which is closely related to inbreeding homophily indices in social sciences (27) and the F-statistic in genetics (28).
Modularity M measures how densely connected the nodes that belong to the same partition are. It is defined as
 |
where Q is the total number of communities or classes, L is the total number of links, l q is the total number of links joining nodes of community q and k q is the sum of the degrees of the nodes in the community q.
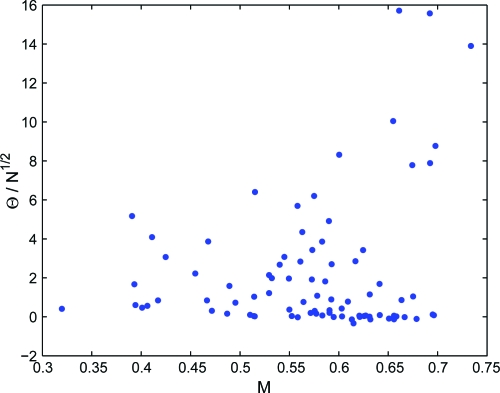
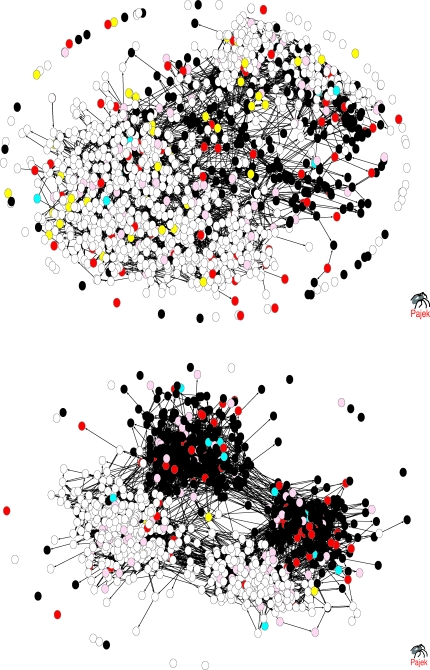
Fig. 3 reports the value of versus the value of the modularity M for each school, suggesting that the 2 indicators are not simply correlated. The 2 indicators provide different information: loosely speaking, whereas M provides an absolute measure of the excess of inward or outward links in a community assignment, Θ measures how much the biases in the community assignment is correlated with the network topology. In order to substantiate this statement in a visual manner, we identify 2 schools with different values of but similar values of N, modularity M, and Shannon entropy S. Fig. 4 reports the friendship networks in the 2 schools, strongly suggesting that significant differences in Θ imply different degrees of separation between the different communities, an effect which is not captured by M. This shows that a community assignment with a given value of the modularity, is more informative on the network topology when the network is strongly clustered in groups, than when the network has a less pronounced cluster structure.
Fig. 3.
The value of versus the modularity M for the dataset of friendship networks in American Schools. Each point is a school.
Fig. 4.
The case of 2 schools with similar modularity and Shannon entropy but very different value of Θ. (Upper) The friendship network of a school of N 1 = 1,461 students, average connectivity 〈k〉 = 5.3, Shannon entropy S 1 = 0.41, modularity M 1 = 0.64, and . (Lower) The friendship network of a school of N 2 = 1,147 students, average degree 〈k〉 = 8.8, Shannon entropy S 2 = 0.48, modularity M 2 = 0.66, and . The different colors represent the self-reported ethnic backgrounds of the students.
Dataset of a Protein–Protein Interaction Network.
We apply the proposed method to the study of the relevance of the protein abundance on the protein interacting map of Saccharomyces cerevisiae. The dataset, published in ref. 23, is a subset of the protein-interaction network of S. cerevisiae formed by N = 1,740 proteins with known concentrations x i and 4,185 interactions, independently confirmed in at least 2 publications. The abundance of a protein varies between 50 molecules per cell up to 1,000,000 molecules per cell with a median of 3,000 molecules per cell. The abundance of a protein is not correlated with simple local structural features of the protein interaction map, such as the degree (R = 0.13) or the clustering coefficient (R = 0.005). This raises the question of whether the concentration of proteins has any relevance to the interaction network and if so, what information it provides.
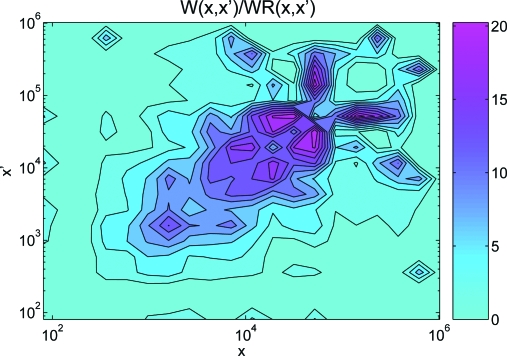
We bin the abundance x into 20 logarithmically spaced intervals given by the ordered vector . Next, we assign to each protein i the corresponding coarse-grained abundance q i = k if x i ∈ [x k−1,x k). The features of the network that we consider are again the connectivity of each protein together with the number of links between proteins of different abundance A(q i,q j). We find a value of Θ = 21.76, well beyond the 1% confidence interval Θ < 2.7, showing that the abundance of the protein encodes relevant information on the network structure. In Fig. 5 we report the value of the statistical weight W(x,x′) in Eq. 4 as a function of the (log–) abundance of each pair of proteins in the network. The value of W(x,x′) is normalized to the value WR(x,x′) found in networks where the protein abundance is randomized in order to highlight features of the specific concentration assignments in the dataset. The maximum of W(x,x′)/WR(x,x′) along the diagonal suggests that proteins of a given concentration tend to interact preferentially with proteins with a similar concentration, therefore showing some “assortativity” of the interaction map in the plane of the abundance x,x′.
Fig. 5.
Relevance of protein abundance x for the protein–protein interaction network studied in ref. 23. The statistical weight W(x,x′) describing the likelihood of links between proteins with concentrations x and x′ is first normalized to the analogous function WR(x,x′), which is obtained in the randomized dataset (with a random permutation of the abundance values x i). The density plot reports the dependence of W(x,x′)/WR(x,x′) as a function of the protein abundance x, x′.
Application to Spatial Networks
The role of the space in which networks are embedded, and its implications on navigability and efficiency, has attracted considerable interest (29–32). Here, we show how the proposed indicator Θ can be used for assessing how relevant the spatial position of the nodes in some geographical or abstract metric space is.
In this case, each node can be characterized by its degree k i and by its position in space q i. We first define a set d ∈ {d 1,…,d D} (D = O(N)) of fixed increasing distance values. We then consider the ensemble of networks with given feature , where B(d) = (b 1,…,b D) is the vector of the total number b ℓ of links between nodes at distance d = |q i − q j| ∈ [d ℓ−1,d ℓ] (d 0 = 0). Finally, we calculate the entropy of this ensemble and the indicator Θ from the definition of Eq. 3.
Dataset of U.S. Airport Networks.
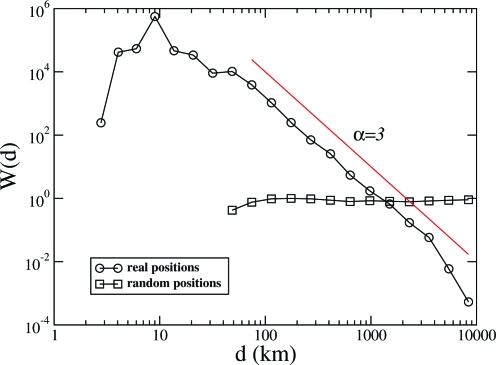
Here, we apply the proposed method to the network of U.S. airports studied in ref. 33. We find that, as it occurs for the internet (29), also the airport network is consistent with a power-law dependence of the linking probability between 2 nodes with their distance. The network contains N = 675 airports and 3,253 connections, each of which is a regular flight between 2 airports. In this case, with each airport is associated a geographical location q i. We bin the distances into D = 20 logarithmically spaced intervals, and we consider as features of our graph the degree sequence together with B(d), as discussed above. We find a high value of Θ = 1.1 × 10³, showing high significance of space in the structure of airport connections, as expected. In this case, W(q,q′) = W(d(q,q′)) is a function of the distance only. In Fig. 6, we report the shape of the function W = W(d), depending on the distance d between any 2 airports i and j, together with the shape of WR(d) in the case in which the positions of the airports are randomly reshuffled. The function W(d) indicates that the probability of a connection decays approximately like a power law, with deviations for airports at distances < 100 km (flights over such small distances mainly connect places such as islands or remote areas in Alaska, for which charter flights are the only feasible connection). A log–log fit yields W(d) ∼ d −α with α = 3.0 ± 0.2 for d > 100 km.
Fig. 6.
The function W(q i,q j) = W(d) in the U.S. airport network, which (see Eq. 4) encodes the statistical weight of a link between airports at distance d (in kilometers). For comparison, the same function is shown for the randomized network in which the geographic locations of the airports have been reshuffled. The line, which represents an inverse dependence on the cube of the distance (α = 3), is drawn as a guide to the eye.
Networks with a linking probability that depends on a power law of the distance are of special relevance, both because they occur in real networks (see, e.g., ref. 29) and, in abstract terms, for navigability and efficiency (30–32).
A possible interpretation of the reported statistical regularity is the following. Imagine that flights were designed by a social planner with the aim of optimizing the network for an uniformly distributed population of passengers. This task is similar to that of finding small-world networks with optimal navigability. Following the pioneering work of Kleinberg (30), it has been shown that optimal navigability can be achieved in small-world networks where long-range links are drawn from a distribution with α ∈ [2,3] (32). If we suppose that airports are uniformly distributed across the country and that flying costs have a contribution which increases linearly with distance, then an airline company would face costs
to cover distances greater than R ≫ 1. With α < 3, costs would be dominated by long-distance flights. In a regime of free competition between airlines, α ≥ 3 is essential in order to maintain a diversified portfolio of flights over short and long distances. This suggests that α ≈3 corresponds to the optimal compromise between networks with optimal navigability and those which are economically viable in a competitive market of airline companies.
Conclusion
In conclusion, we propose a method for assessing the relevance of additional information about the nodes of a networks using the information that comes from the topology of the network itself. The method makes use of a quantity Θ, which is not reducible to any other quantity already introduced in network analysis. The method can be generalized to directed or weighted networks. We test and illustrate this method on synthetic as well as real networks, such as the social network of friendship interaction in U.S. schools, the protein interaction map of S. cerevisiae, and the U.S. airport network. As a byproduct, the method also provides additional nontrivial information and highlights hidden statistical regularities.
Data
The networks of American schools come from the National Longitudinal Study of Adolescent Health. It consists of data from surveys conducted in 1994 in a sample of 84 American high schools and middle schools by the University of North Carolina Carolina Population Center (www.cpc.unc.edu/addhealth).
The protein interaction map that we used is based on the BioGRID database 2.0.20 (www.thebiogrid.org). It is described in detail in ref. 23 and is freely available as supplementary material of ref. 23.
The airport network was recorded by ref. 33 from the 2005 statistics of the International Air Transport Association (www.iata.org) and is available at http://cxnets.googlepages.com.
Supplementary Material
Acknowledgments.
We acknowledge interesting discussions with Marc Bailly-Bechet, Marco Cosentino Lagomarsino, and Paolo De Los Rios. We thank Alessandro Vespignani for making the U.S. airports network available to us. G.B. acknowledges support from the Information Science Technologies Specific Targeted Research Project (STREP) GENNETEC Contract 034952. P.P. and M.M. acknowledge support from European Union STREP Project 516446 COMPLEXMARKETS.
Footnotes
The authors declare no conflict of interest.
This article is a PNAS Direct Submission.
A community structure, in general terms, is an assignment of nodes into classes. Community detection aims at partitioning nodes into homogeneous classes, according to similarity or proximity considerations.
To be precise, here k i = Σjg i,j is the degree and A(q,q′) = Σi,jg i,jδqi,qδqj,q′ is the number of links between nodes with attribute q and q′.
In other words, is the Gibbs–Boltzmann entropy of the ensemble of graphs which assigns equal weight to each graph g satisfying the constraints, which is equivalent to the usual Shannon entropy of the distribution of graphs in this ensemble.
A more precise estimate of the probability of occurrence of a given value of Θ would entail the study of large deviation properties of the entropy distribution. This goes beyond our present purposes.
This limitation is imposed by the fact that the saddle point method we use to evaluate the entropy is reliable only if the number of imposed constraints N + Q 2 is of the same order of magnitude of N.
A plausibility argument for the scaling behavior is the following: Consider a particular permutation π and imagine making a small number n ≪ N of further perturbations by exchanging assignments on pairs of randomly chosen nodes. Each such perturbation is likely to affect a different part of the network, which means that the associated changes in the entropy can be considered as uncorrelated. Hence, we expect a change in the entropy density of the order of . This is expected to hold true also for n/N finite but small suggesting that, as N increases, the difference between the entropies of 2 random permutations—and hence the denominator in Eq. 3—is of order .
This article contains supporting information online at www.pnas.org/cgi/content/full/0811511106/DCSupplemental.
References
- 1.Barabási A-L, Albert R. Statistical mechanics of complex networks. Rev Mod Phys. 2002;74:47–97. [Google Scholar]
- 2.Dorogovtsev SN, Mendes JFF. Evolution of Networks: From Biological Nets to the Internet and WWW. Oxford: Oxford Univ Press; 2003. [Google Scholar]
- 3.Newman MEJ. The structure and function of complex networks. SIAM Rev. 2003;45:157–256. [Google Scholar]
- 4.Boccaletti S, Latora V, Moreno Y, Chavez M, Hwang DU. Complex networks: Structure and dynamics. Phys Rep. 2006;424:175–308. [Google Scholar]
- 5.Caldarelli G. Scale-Free Networks. Oxford: Oxford Univ Press; 2007. [Google Scholar]
- 6.Monod J. Chance and Necessity: An Essay on the Natural Philosophy of Modern Biology. Glasgow: Collins; 1972. [Google Scholar]
- 7.Bianconi G, Marsili M. Loops of any size and Hamilton cycles in random scale-free networks. J Stat. 2005;P06005 [Google Scholar]
- 8.Bianconi G, Marsili M. Emergence of large cliques in random scale-free networks. Europhys Lett. 2006;74:740–746. [Google Scholar]
- 9.Reichardt J, Bornholdt S. Statistical mechanics of community detection. Phys Rev E. 2006;74:016110. doi: 10.1103/PhysRevE.74.016110. [DOI] [PubMed] [Google Scholar]
- 10.Leone M, Pagnani A. Predicting protein functions with message passing algorithms. Bioinformatics. 2005;21:239–247. doi: 10.1093/bioinformatics/bth491. [DOI] [PubMed] [Google Scholar]
- 11.Fortunato S, Castellano C. Encyclopedia of Complexity and System Science. New York: Springer; 2008. Community structure in graphs. [Google Scholar]
- 12.Danon L, Díaz-Guilera A, Dutch J, Arenas A. Comparing community structure identification. J Stat. 2005;P09008 [Google Scholar]
- 13.Girvan M, Newman MEJ. Community structure in social and biological networks. Proc Natl Acad Sci USA. 2002;99:7821–7826. doi: 10.1073/pnas.122653799. [DOI] [PMC free article] [PubMed] [Google Scholar]
- 14.Newman MEJ, Girvan M. Finding and evaluating community structure in networks. Phys Rev E. 2004;69:026113. doi: 10.1103/PhysRevE.69.026113. [DOI] [PubMed] [Google Scholar]
- 15.Newman MEJ. Detecting community structure in networks. Eur Phys J B. 2004;38:321. doi: 10.1103/PhysRevE.69.066133. [DOI] [PubMed] [Google Scholar]
- 16.Palla G, Derenyi I, Farkas I, Vicsek T. Uncovering the overlapping community structure of complex networks in nature and society. Nature. 2005;435:814–818. doi: 10.1038/nature03607. [DOI] [PubMed] [Google Scholar]
- 17.Clauset A, Moore C, Newman MEJ. Hierarchical structure and the prediction of missing links in networks. Nature. 2008;453:98–101. doi: 10.1038/nature06830. [DOI] [PubMed] [Google Scholar]
- 18.Newman MEJ, Leicht E. Mixture models and exploratory analysis in networks. Proc Natl Acad Sci USA. 2007;104:9564–9569. doi: 10.1073/pnas.0610537104. [DOI] [PMC free article] [PubMed] [Google Scholar]
- 19.Arenas A, Díaz-Guilera A, Pérez-Vicente CJ. Synchronization reveals topological scales in complex networks. Phys Rev Lett. 2006;96:114102. doi: 10.1103/PhysRevLett.96.114102. [DOI] [PubMed] [Google Scholar]
- 20.Fortunato S, Barthélemy M. Resolution limit in community detection. Proc Natl Acad Sci USA. 2007;104:36–41. doi: 10.1073/pnas.0605965104. [DOI] [PMC free article] [PubMed] [Google Scholar]
- 21.Bianconi G. The entropy of randomized network ensembles. Europhys Lett. 2008;81:28005. [Google Scholar]
- 22.Bianconi G. The entropy of network ensembles. Phys Rev E. 2009;79:036114. doi: 10.1103/PhysRevE.79.036114. [DOI] [PubMed] [Google Scholar]
- 23.Maslov S, Ispolatov I. Propagation of large concentration changes in revesible protein-binding networks. Proc Natl Acad Sci USA. 2007;104:13655–13660. doi: 10.1073/pnas.0702905104. [DOI] [PMC free article] [PubMed] [Google Scholar]
- 24.Moody J. Race, school integration, and friendship segregation in America. Am J Sociol. 2001;107(3):679–716. [Google Scholar]
- 25.González MC, Herrmann HJ, Kertész J, Vicsek T. Community structure and ethnic preferences in school friendship networks. Physica A. 2007;379:307–316. [Google Scholar]
- 26.Currarini S, Jackson MO, Pin P. An economic model of friendship: Homophily, minorities and segregation. Econometrica. 2008 in press. [Google Scholar]
- 27.Coleman J. Relational analysis: the study of social organizations with survey methods. Hum Organ. 1958;17:28–36. [Google Scholar]
- 28.Wright S. Coefficients of inbreeding and relationship. Am Nat. 1922;56:330–338. [Google Scholar]
- 29.Yook S, Jeong H, Barabási A-L. Modeling the internet's large-scale topology. Proc Natl Acad Sci USA. 2002;99:13382–13386. doi: 10.1073/pnas.172501399. [DOI] [PMC free article] [PubMed] [Google Scholar]
- 30.Kleinberg JM. Navigation in a small world. Nature. 2000;406:845. doi: 10.1038/35022643. [DOI] [PubMed] [Google Scholar]
- 31.Boguña M, Krioukov D, Claffy KC. Navigability of complex networks. Nat Phys. 2009;5:74–81. [Google Scholar]
- 32.Caretta Cartozo C, De Los Rios P. Extended navigability of small world networks: Exact results and new insights. arXiv/0901.4710. 2009 doi: 10.1103/PhysRevLett.102.238703. [DOI] [PubMed] [Google Scholar]
- 33.Colizza V, Pastor-Satorras R, Vespignani A. Reaction-diffusion processes and metapopulation models in heterogeneous networks. Nat Phys. 2007;3:276–282. [Google Scholar]
Associated Data
This section collects any data citations, data availability statements, or supplementary materials included in this article.


