

Abstract
Developmental regulatory networks constitute all the interconnections among molecular components that guide embryonic development. Developmental transcriptional regulatory networks are circuits of transcription factors and cis-acting DNA elements that control expression of downstream regulatory and effector genes. Developmental networks comprise functional subnetworks that are deployed sequentially in requisite spatiotemporal patterns. Here we discuss integrative genomics approaches for elucidating transcriptional regulatory networks, with an emphasis on those involved in Drosophila mesoderm development and mammalian embryonic stem cell maintenance and differentiation. As examples of regulatory subnetworks, we consider the transcriptional and signaling regulation of genes that interact to control cell morphology and migration. Finally, we describe integrative experimental and computational strategies for defining the entirety of molecular interactions underlying developmental regulatory networks.
Introduction
Developmental regulatory networks comprise the complete set of molecular components and their functional interactions that guide the progressive determination of pluripotent cells, thereby allowing cell fates to become sequentially restricted and differentiation programs to be properly executed during embryonic development. Both intracellular signaling and intrinsic control mechanisms that reflect the developmental histories of cells contribute to such developmental networks. Transcriptional regulatory networks (TRNs) act within and contribute to the more global effects of developmental networks by orchestrating embryonic gene expression patterns by controlling whether a gene will be expressed and at what level in a particular place and time within the embryo. TRNs operate through cis regulatory modules (CRMs), stretches of DNA composed of short DNA subsequences that are recognized by sequence-specific DNA binding proteins that in many cases integrate the activity of tissue-specific, cell-specific and signal-activated transcription factors (TFs) to guide gene expression programs [1,2]. That is, CRMs are responsive to specific combinations of TFs, and TRNs comprise networks of TFs, CRMs, and co-regulated genes. A TRN that orchestrates the spatiotemporal gene expression programs specifying a given developmental process, i.e., a developmental TRN, is one part of a larger developmental regulatory network. The biochemical functions, posttranslational modifications and molecular interactions of the gene products or effectors that define specific cellular behaviors within a developing organism complete the regulatory network. Here, we summarize recent work aimed at deciphering selected developmental TRNs, and consider current efforts directed toward the more challenging problem of elucidating predictive models that account for the complete architecture and function of developmental regulatory networks.
Historically, molecular and genetic methods have been used to define TFs, effector genes and CRMs involved in orchestrating a developmental process. Building on extensive gene perturbation studies, the TRN controlling sea urchin endomesoderm specification was the first developmental TRN to be described in detail [3]. More recently, inroads have been made in dissecting the TRNs regulating patterning and cell fate specification in numerous plant and invertebrate and vertebrate animal model systems [2,4]. Interestingly, this work has shown that a network can be subdivided into subnetworks of interconnected genes, each of which performs a particular developmental function. Each developmental subnetwork acts at a specific time and place to induce characteristic changes in cell division, movement, size, shape and a variety of specialized functions specific to particular cell types (such as myoblast fusion, neuronal synapse formation or hormone secretion). Thus, development can be viewed as being controlled by a sequence of subnetworks arising at particular places and times, with spatiotemporally coincident subnetworks defining distinct cell states (Figure 1). To illustrate this view, we discuss recent studies that have focused on understanding the developmental networks controlling organogenesis in selected model systems, starting with the specification of individual cell fates and progressing to the regulatory circuits that execute unique cellular differentiation programs.
Figure 1.
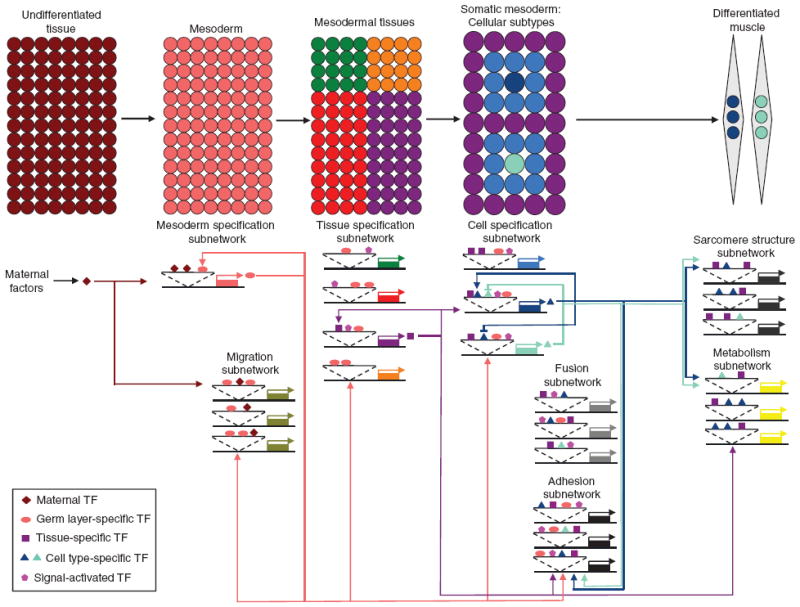
A developmental regulatory network controlling Drosophila embryonic somatic muscle formation. The specification and differentiation of somatic muscle cells in the Drosophila embryo is shown here as an example of how distinct developmental subnetworks direct the progressive determination of initially pluripotent cells. The fundamental themes that are highlighted are likely to be similar for a diverse array of other cell types. Maternal factors first activate expression of a TF (diamond) which subdivides the Drosophila embryo into distinct tissue domains by activating and repressing (not shown) distinct sets of zygotic target genes. The zygotically expressed TF specific for the mesodermal germ layer (oval) is able to autoregulate its own expression to amplify the maternal response and to promote stability in the transcriptional network governing mesoderm formation. The germ layer-specific TF in association with the maternal factor activate subnetworks of genes important for different processes such as those governing cell migration. The germ layer-specific TF—along with signal-activated TFs (pentagons)—also activates batteries of genes that include additional tissue-specific TFs (squares) that serve to subdivide the mesoderm into distinct mesodermal tissues (including heart, fat body, visceral and somatic muscle). Focusing on the somatic mesodermal subdivision, germ layer-specific, tissue-specific and signal-activated TFs cooperate in activating distinct sets of genes, including cell type-specific or “identity” TFs (light blue-green and dark blue triangles). Repressive and autoregulatory interactions amongst the cell type-specific TFs contribute to the pattern of individual cellular identities. Coincident with or shortly after cell fate specification, sets of genes will be activated by the germ layer-, tissue-, signal-activated and cell type-specific TFs to form subnetworks of effectors important for a myriad of developmental processes including cell fusion and adhesion. The products encoded by these genes may work together with constitutively expressed components that also are involved in the same process. In addition, different subnetworks can overlap as the components from one subnetwork can be utilized in other subnetworks and can be affected by the activity of multiple inputs. The final stages of differentiation are driven by tissue-specific and cell type-specific TFs which activate additional subnetworks of genes, such as those important for sarcomere structure and high rates of metabolism. Cell type-specific effectors—regulated by the corresponding identity TFs—contribute to the unique functional and structural features of individual myotubes (represented by the light blue-green and dark blue nuclei in the differentiated muscles shown at the upper right of the figure). The myogenic regulatory network depicted here incorporates the collective findings of numerous independent studies [6,7,11-13,19-21].
Developmental Networks for Cell Fate Specification and Differentiation
Dorsal, an NF-κb homolog, along with two of its targets, Twist, a basic helix-loop-helix TF required to initiate mesoderm formation [5] and Snail, a TF involved in activating ectodermal and repressing mesodermal target genes, comprise a set of TFs specifying distinct tissue domains in the Drosophila embryo. Recently, two independent groups, using a combination of chromatin immunoprecipitation followed by microarray analysis (so-called ChIP-chip), genome-wide expression profiling, and integrative bioinformatics approaches, investigated how these three TFs cooperate to regulate a developmental program [••6,••7]. Interestingly, computational scans for Dorsal binding sites revealed an enrichment of such sites associated with Twist-bound CRMs [••6], which agrees with the extensive co-clustering of Twist and Dorsal DNA binding site motifs [••7]. Twist and Dorsal proteins are known to physically interact [8] and this interaction could be dependent on the number, spacing, order and orientation of their respective binding sites. However, whether such architectural features of a CRM, or binding site “grammar” [9,10], apply to these two TFs is a possibility that remains to be examined. This idea could be tested by altering motifs within authentic CRMs or by creating entirely synthetic CRMs comprising combinations of TF binding sites of interest. Similar integrative genomics approaches combining ChIP-chip, gene expression profiling, and bioinformatics have been applied to investigate the role of Mef2 in muscle gene transcription and the role of Forkhead and NK homeobox TFs in Drosophila visceral muscle gene regulation [11-13]. Underscoring the utility of the ChIP-chip approach for characterizing regulatory networks in distinct tissue types in other organisms, including mammals, is the recent description of the role of different TFs orchestrating human liver [14], mouse muscle [15-17], and mouse liver and pancreas [18] cellular determination and differentiation.
As development progresses following the specification and separation of embryonic germ layers, distinct developmental circuits program the progressive determination of individual cells within these tissues. Some recent studies have explored the regulatory networks specifying individual cells in the Drosophila mesoderm. Jagla and his colleagues undertook an integrative approach to examine the role of the NK homeobox TF Ladybird (Lb) in the specification of a subset of Drosophila heart and muscle cells [19]. They combined ChIP-chip with gene expression profiling of Lb mutants to generate a genome-scale view of cell fate determination. With this approach, it was established that Lb is involved not only in the initial specification but also in the later differentiation program of Lb-expressing cells.
We have recently combined genetic, genomic and computational methodologies to elucidate the transcriptional codes and downstream effectors directing Drosophila muscle development [••20,••21,22-24]. Specifically, we compiled a compendium of genome-wide gene expression profiles from flow-sorted primary mesodermal cells derived from flies of multiple different genotypes that perturb muscle development in known ways [••20]. A statistical meta-analysis of the cumulative microarray data resulted in the identification of hundreds of previously uncharacterized genes with myoblast subtype expression patterns. Computational methods were then used to investigate if these muscle genes are subject to a common cis regulatory logic. To this end, the expression data affecting muscle specification were clustered and then analyzed with a novel computational algorithm that evaluates the likelihood that a specific combination of TF binding site motifs is enriched among a set of co-expressed genes [••21]. The results of this analysis showed that only a subset of known myoblast subtype genes is targeted by a subset of the predicted regulating TFs. Of critical importance in these studies was the use of empirical tests to establish the validity of the statistical predictions of both gene expression and gene regulation.
More recently, these computational algorithms were refined and extended to decipher matrices of cis regulatory codes for hundreds of putative mammalian regulatory motifs and gene sets [25]. These programs significantly advance the goal of ascertaining relevant TRNs directly from genomic sequence and gene expression data. As a complement to these studies, catalogs of TF binding site motifs (‘motif dictionaries’) are being systematically compiled using protein binding microarray, one-hybrid, and comparative genomics approaches [••26,27,••28,29,30]. In an important application of these approaches to one large family of TFs, Berger et al. and Noyes et al. highlighted differences in binding sequence preferences associated with different classes of homeodomain (HD) proteins [••26,••28], thereby increasing the utility of information about such motifs for genome-wide computational scans. Such DNA binding profiles or motif dictionaries can be used to computationally predict combinations of TFs that may co-regulate particular gene sets [25]. Hypotheses derived from such bioinformatics approaches must then be independently validated using appropriate transcriptional reporter assays.
As comprehensive in situ hybridization atlases of gene expression are compiled for various tissues, cis regulatory codes for co-expressed genes can be predicted using similar methods. Recently, Malik and his colleagues combined in situ hybridization with the embryonic position of gene expression and morphological “landmarks” to describe an atlas of co-expressed genes along the anteroposterior axis in Drosophila [31]. Similarly, the Allen Brain Atlas combined serial sectioning and anatomical registering to elucidate expression of transcripts in the adult mouse brain [32]. Although a significant first step, it is likely that more sophisticated approaches and technological advances will be required to resolve the expression patterns of the full complement of genes expressed by an individual cell in more complex tissues. Toward this end, individual cells can now be purified by laser capture microdissection [33] or by fluorescence-activated cell sorting [20,••34,35,•36], and significant increases in the sensitivity of transcript detection can be obtained by massively parallel sequencing technologies [37]. Combining these approaches should lead to the identification of co-expressed genes at single cell resolution. Together, experimental and computational strategies that refine gene expression profiling and CRM prediction will facilitate the delineation of the complete genetic programs of individual cells, and will contribute to our understanding of the molecular basis of cellular and organismal phenotypes.
An emerging view is that key regulatory TFs controlling organogenesis exert their influence upon many downstream targets throughout a developmental process. In further support of this mechanism, we described a role for Twist in regulating gene expression within a subset of Drosophila embryonic myoblasts, including genes that have either early or late developmental functions as these cells differentiate [••21]. In addition, Twist activates the expression of numerous TFs (about 25% of all annotated TFs) and potentially functions together with these factors in regulating downstream target genes [••6]. Such feed-forward mechanisms—in which one TF regulates the expression of a second TF and then both factors regulate expression of a third gene—are quite prevalent in developmental regulatory networks, serving to generate combinatorial specificity and to lock in a new cellular state [2,14,18,38,39]. In addition, combinatorial regulation of target genes involving the cooperative binding of multiple TFs is widespread throughout development [1,2,••6,••7,11,16-18,••21,24]. Related work has further shown that there is significant cross- and auto-regulation of key regulatory TFs, which has been suggested to promote stability in transcriptional networks [2,••6,••7,13,14,16-18]. Finally, these studies highlight the importance of integrating numerous genome-scale datasets to dissect and model TRNs. Integration of various data types can provide novel insights, in particular because setting empirical thresholds set on a single data type can be challenging and can lead to erroneous conclusions [40]. Combining multiple, independently generated observations (such as gene expression, in vivo TF binding, physical and genetic interactions, and the clustering and evolutionary conservation of DNA motifs) to infer network structure can strengthen the resulting model [••41,42].
Developmental Subnetworks
Transcriptional mechanisms drive the co-expression of functionally related genes which interact within subnetworks that govern how cells undergo their unique developmental behaviors. An “interactome”—defined here as the complete set of molecular associations in a cell—comprise not only physical interactions but also functional relationships which do not require direct contacts such as protein-protein, protein-DNA or mRNA-microRNA interactions. Given their functional significance, defining cell type-specific interactomes can be even more important than identifying gene co-expression and co-regulation for acquiring a systems-level view of development.
In addition, a comprehensive understanding of the subnetworks that underlie development can provide mechanistic insight into a mutant phenotype or drug action. For example, a network analysis approach has been successfully applied in yeast by clustering gene expression data for approximately 300 deletion mutants to predict and verify the mechanism of action of an antifungal drug [43]. A similar perturbation-based molecular signature strategy has been applied to a mammalian cell line to infer strong connectivities among related drugs which act at points distal to transcriptional regulation, to generate testable hypotheses about how uncharacterized small molecules act based on their related effects on gene expression, and to identify unanticipated relationships between known drugs that can be exploited in developing new combination chemotherapies [44]. The utility of these systematic perturbation strategies will be greatly enhanced by efforts to create predictive models of biological networks in many different contexts, including development.
Interactome data can be derived from various sources (gene co-expression, co-regulation, literature mining, etc.) with many interactions being identified by high-throughput technologies such as yeast two-hybrid assays [45-47], protein affinity purification followed by mass spectrometry [48,49], and synthetic lethal/sickness screens [50-52]. Fraser and his colleagues have undertaken a synthetic lethal screen to catalog genetic interactions affecting C. elegans vulva development. They identified a small group of genes, or hubs, that interact with many other genes in the genetic network [52]. Integrating this information with gene expression profiles, physical and genetic interactions, and literature mining, Marcotte, Fraser and their colleagues built a proteome-scale probabilistic network of genetic interactions for C. elegans [••53]. This network successfully predicted tissue-specific phenotypes and identified novel genes involved in disparate pathways. Similarly, Zhong and Sternberg integrated interactome, expression, and annotation data sets for C. elegans and comparable data from other species to fill in “holes” in any one data set to predict novel genetic interactions [••54]. Finally, a study by Zhu et al. combined gene expression, protein-protein interaction and TF binding site data to build a network capable of predicting systems-level behavior in yeast [••41]. Importantly, they identified and empirically verified subnetworks of genes which are coordinately controlled by factors associated with particular expression quantitative trait loci. Taken together, these studies establish that a comprehensive ‘circuit diagram’ can be delineated for complicated biological processes, and suggest the potential to similarly elucidate even more complex developmental networks.
The previously described work involved organism-scale interactome studies. However, developmental subnetworks are largely operative at the level of individual cells, each of which expresses a unique combination of proteins. Thus, recent studies have moved toward a systems-level understanding of the composition of the signaling and transcriptional networks regulating the morphology and migration of a uniform population of single cells. Bakal et al. sought a quantitative understanding of the signaling networks regulating cell morphology by manipulating gene expression in fluorescently labeled cultured Drosophila neuronal cells [••55]. Image analysis algorithms and hierarchical clustering were used to define groups of genes which, when perturbed, exhibit phenotypes with similar morphological features (“phenoclusters”). This strategy allowed the authors to map the local signaling networks that control cell adhesion and membrane protrusion and tension.
A logical extension of this work would involve proceeding from cellular phenotypes to phenoclustering genes orchestrating more complex developmental functions. As genes performing a similar function tend to be co-expressed and transcriptionally co-regulated, it is likely that these developmental phenoclusters are under common transcriptional regulation. Along these lines, a recent study sought to understand how transcriptional networks control the generation of morphological form during heart cell migration in Ciona intestinalis [••34]. The major finding was that distinct effector genes important for directed cell migration were transcriptionally regulated by the cardiogenic network. Interestingly, these effector genes worked in concert with other constitutively expressed cellular components involved in the same process. Thus, these two sets of genes together coded for the cellular machinery enabling proper cell migration. This study highlights the modular nature of regulatory networks, in which transcriptional regulation of a small set of effector genes can dramatically influence a developmental process.
Developmental Networks Controlling Embryonic Stem Cells
Embryonic stem (ES) cells depend on an extensive network of TFs and external signals to maintain their undifferentiated state and their ability to self-renew and differentiate [56]. There have been extensive efforts to study these cells’ regulatory networks not only to understand development and disease but also with the goal of reprogramming somatic cells to acquire a stem cell fate [57]. Because of their prevalence and ability to be cultured and differentiated in vitro, ES cell lines provide a facile system for investigating developmental regulatory networks and subnetworks. In order to avoid the pitfalls of working in vitro, additional genome-scale studies will be required to dissect the cellular and molecular events directing self-renewal and differentiation of ES cells in systems where these cells can be tracked in vivo [58].
Two recent studies used loss- and gain-of-function approaches to define genes important for ES cell maintenance [59,60]. Lemischka and his colleagues used loss-of-function RNA interference to define three previously unrecognized genes that regulate ES cell maintenance [59]. In contrast, Takahashi and Yamanaka used a gain-of-function approach to define genes important for reprogramming mouse somatic cells to an ES-like cell state [60]. They showed that the over-expression of just four TFs induced reprogramming of embryonic and adult mouse fibroblasts to an ES cell-like state (so-called induced pluripotent stem (iPS) cells). Similar combinations of TFs are sufficient to convert human somatic cells into iPS cells [61,62].
Our understanding of somatic cell reprogramming is increasing as the regulatory network used by ES cells is interrogated on the genome-scale with ChIP-chip or ChIP-Seq (which uses high-throughput sequencing to detect and quantify immunoprecipitated DNA fragments bound by TFs) [63,•64,65,66]. In fact, with such extensive whole-genome data sets—including ChIP-chip and ChIP-Seq of multiple TFs, maps of epigenetic states, expression profiling of genetically manipulated cells, protein-protein interactions, and complementary studies in more than one mammalian species [59,63,•64,65-68,•69,70-72]—it should be possible to construct comprehensive developmental ‘wiring diagrams’ similar to those previously described for yeast, sea urchin and C. elegans [2,3,••41,••53,••54]. Finally, reprogramming somatic cells into iPS cells is progressing at an unprecedented pace, and recent protocols have removed the tumor-inducing c-myc gene from the cocktail of inducing factors [62,73]. However, this manipulation led to a lowering of the reprogramming efficiency [73] which could be circumvented by adding chemical inhibitors of histone deacetylase and DNA methyltransferase to cell cultures [•69,74]. A more thorough understanding of the ES cell network should suggest additional rational perturbations that may avoid the use of inhibitors which alter genome-wide patterns of epigenetic modifications, thereby preventing potentially unintended consequences.
Conclusions and Future Directions
In this review, we have described examples of regulatory networks that direct organogenesis through their effects on cell fate specification and differentiation, and we have highlighted integrative systems-level approaches that are being used to analyze the organization and functions of such networks. The emerging view is that subnetworks within larger cellular regulatory networks drive specific aspects of the progressive determination and subsequent differentiation of individual cells. Recent work has also demonstrated the importance of integrating multiple genome- and proteome-scale data sets to increase the power of network models to predict the functions of interacting genes involved in a particular biological process. As Davidson and his colleagues have recently shown for skeletogenesis in the sea urchin embryo [•75], it is now possible to reconstruct regulatory networks that are sufficiently comprehensive as to explain the transcriptional control of genes encoding all TFs and signals affecting a developmental process. Combining genomic and other systems-level data with loss-of-function studies should be an essential part of a platform for understanding and modeling other developmental regulatory networks. Indeed, whole-genome RNAi-based loss-of-function studies are now approachable in cultured mammalian cells [76,77], paving the way for rapid genome-wide perturbation analysis of numerous cellular and developmental mechanisms. The challenge here will be to relate cell culture findings to in vivo events where cell-cell and cell-matrix interactions play an important role.
While genomic tools are currently in place for identifying components of biological regulatory networks through systematic perturbation studies, a major limitation to applying these methods for the dissection of functional protein interactions is the availability of informative high-throughput assays. In this regard, it should be possible to adapt a recently described method, protein fragment complementation assays, to directly measure protein-protein interactions in living cells, thereby raising the possibility of describing large-scale, cell type-specific interactomes in the very near future [78]. This approach can also be employed in a more targeted manner to test specific predictions of regulatory network models derived from other findings. Finally, it must be recognized that studies of developmental regulatory networks to date have largely emphasized qualitative assessments of network components and their functional interactions. However, it must be kept in mind that a regulatory model is only as complete and accurate as its ability to explain all aspects of development—from the integration of upstream signaling and transcriptional networks, to the downstream effector functions of target gene products—in a predictive, quantitative manner that can account for all cellular behaviors and interactions within the embryo. The construction of such models will require the generation of quantitative and dynamic datasets—including, for example, developmental time course measurements of protein concentrations in relevant subcellular compartments and affinity constants for molecular interactions—as well as the development of new computational tools for the analysis and integration of such information. Achieving these goals will be a major challenge for developmental systems biology in the coming years.
Acknowledgments
B.W.B. and A.M.M. were supported by the Division of Intramural Research of the National, Heart, Lung and Blood Institute, National Institutes of Health. M.L.B. was supported in part by grants U01 GM076603 from NIH/NIGMS and U01 HL081755 from NIH/NHLBI.
Footnotes
Publisher's Disclaimer: This is a PDF file of an unedited manuscript that has been accepted for publication. As a service to our customers we are providing this early version of the manuscript. The manuscript will undergo copyediting, typesetting, and review of the resulting proof before it is published in its final citable form. Please note that during the production process errors may be discovered which could affect the content, and all legal disclaimers that apply to the journal pertain.
References and recommended reading
• of special interest
•• of outstanding interest
- 1.Carroll SB, Grenier JK, Weatherbee SD. From DNA to Diversity Molecular Genetics and the Evolution of Animal Design. 2. Malden, Massachusetts: Blackwell Publishing; 2005. [Google Scholar]
- 2.Davidson E. The Regulatory Genome: Gene Regulatory Networks In Development And Evolution. Academic Press; 2006. [Google Scholar]
- 3.Davidson EH, Rast JP, Oliveri P, Ransick A, Calestani C, Yuh CH, Minokawa T, Amore G, Hinman V, Arenas-Mena C, et al. A genomic regulatory network for development. Science. 2002;295:1669–1678. doi: 10.1126/science.1069883. [DOI] [PubMed] [Google Scholar]
- 4.Long TA, Brady SM, Benfey PN. Systems Approaches to Identifying Gene Regulatory Networks in Plants. Annu Rev Cell Dev Biol. 2008 doi: 10.1146/annurev.cellbio.24.110707.175408. [DOI] [PMC free article] [PubMed] [Google Scholar]
- 5.Stathopoulos A, Levine M. Dorsal gradient networks in the Drosophila embryo. Dev Biol. 2002;246:57–67. doi: 10.1006/dbio.2002.0652. [DOI] [PubMed] [Google Scholar]
- ••6.Sandmann T, Girardot C, Brehme M, Tongprasit W, Stolc V, Furlong EE. A core transcriptional network for early mesoderm development in Drosophila melanogaster. Genes Dev. 2007;21:436–449. doi: 10.1101/gad.1509007.. In this study, the authors used ChIP-chip at distinct developmental time windows to define the regulatory network controlled temporally by Twist. They designed a scoring scheme to confidently assign Twist binding to a particular target by scoring highly those genes with known mesodermal expression patterns or muscle-expressed mouse orthologs with downstream targets defined by expression profiling of Twist mutants. Many of these Twist-bound genomic regions were functional CRMs when tested in transgenic reporter assays, supporting the validity of their overall strategy.
- ••7.Zeitlinger J, Zinzen RP, Stark A, Kellis M, Zhang H, Young RA, Levine M. Whole-genome ChIP-chip analysis of Dorsal, Twist, and Snail suggests integration of diverse patterning processes in the Drosophila embryo. Genes Dev. 2007;21:385–390. doi: 10.1101/gad.1509607.. Here the authors examined how Dorsal, Twist and Snail cooperate in dorsoventral patterning in Drosophila by defining CRMs associated with target genes identified for these three TFs by ChIP-chip. They show hundreds of binding clusters of Dorsal, Twist and Snail throughout the genome. Many of these CRMs were shown to be functional enhancers. Interestingly, many of these clusters of Dorsal, Twist, and Snail are associated with genes involved in later developmental events, including anteroposterior axis patterning and cellular signaling.
- 8.Shirokawa JM, Courey AJ. A direct contact between the dorsal rel homology domain and Twist may mediate transcriptional synergy. Mol Cell Biol. 1997;17:3345–3355. doi: 10.1128/mcb.17.6.3345. [DOI] [PMC free article] [PubMed] [Google Scholar]
- 9.Senger K, Armstrong GW, Rowell WJ, Kwan JM, Markstein M, Levine M. Immunity regulatory DNAs share common organizational features in Drosophila. Mol Cell. 2004;13:19–32. doi: 10.1016/s1097-2765(03)00500-8. [DOI] [PubMed] [Google Scholar]
- 10.Brown CD, Johnson DS, Sidow A. Functional architecture and evolution of transcriptional elements that drive gene coexpression. Science. 2007;317:1557–1560. doi: 10.1126/science.1145893. [DOI] [PubMed] [Google Scholar]
- 11.Jakobsen JS, Braun M, Astorga J, Gustafson EH, Sandmann T, Karzynski M, Carlsson P, Furlong EE. Temporal ChIP-on-chip reveals Biniou as a universal regulator of the visceral muscle transcriptional network. Genes Dev. 2007;21:2448–2460. doi: 10.1101/gad.437607. [DOI] [PMC free article] [PubMed] [Google Scholar]
- 12.Junion G, Jagla T, Duplant S, Tapin R, Da Ponte JP, Jagla K. Mapping Dmef2-binding regulatory modules by using a ChIP-enriched in silico targets approach. Proc Natl Acad Sci U S A. 2005;102:18479–18484. doi: 10.1073/pnas.0507030102. [DOI] [PMC free article] [PubMed] [Google Scholar]
- 13.Sandmann T, Jensen LJ, Jakobsen JS, Karzynski MM, Eichenlaub MP, Bork P, Furlong EE. A temporal map of transcription factor activity: mef2 directly regulates target genes at all stages of muscle development. Dev Cell. 2006;10:797–807. doi: 10.1016/j.devcel.2006.04.009. [DOI] [PubMed] [Google Scholar]
- 14.Odom DT, Dowell RD, Jacobsen ES, Nekludova L, Rolfe PA, Danford TW, Gifford DK, Fraenkel E, Bell GI, Young RA. Core transcriptional regulatory circuitry in human hepatocytes. Mol Syst Biol. 2006;2(2006 0017) doi: 10.1038/msb4100059. [DOI] [PMC free article] [PubMed] [Google Scholar]
- 15.Bergstrom DA, Penn BH, Strand A, Perry RL, Rudnicki MA, Tapscott SJ. Promoter-specific regulation of MyoD binding and signal transduction cooperate to pattern gene expression. Mol Cell. 2002;9:587–600. doi: 10.1016/s1097-2765(02)00481-1. [DOI] [PubMed] [Google Scholar]
- 16.Blais A, Tsikitis M, Acosta-Alvear D, Sharan R, Kluger Y, Dynlacht BD. An initial blueprint for myogenic differentiation. Genes Dev. 2005;19:553–569. doi: 10.1101/gad.1281105. [DOI] [PMC free article] [PubMed] [Google Scholar]
- 17.Cao Y, Kumar RM, Penn BH, Berkes CA, Kooperberg C, Boyer LA, Young RA, Tapscott SJ. Global and gene-specific analyses show distinct roles for Myod and Myog at a common set of promoters. Embo J. 2006;25:502–511. doi: 10.1038/sj.emboj.7600958. [DOI] [PMC free article] [PubMed] [Google Scholar]
- 18.Odom DT, Zizlsperger N, Gordon DB, Bell GW, Rinaldi NJ, Murray HL, Volkert TL, Schreiber J, Rolfe PA, Gifford DK, et al. Control of pancreas and liver gene expression by HNF transcription factors. Science. 2004;303:1378–1381. doi: 10.1126/science.1089769. [DOI] [PMC free article] [PubMed] [Google Scholar]
- 19.Junion G, Bataille L, Jagla T, Da Ponte JP, Tapin R, Jagla K. Genome-wide view of cell fate specification: ladybird acts at multiple levels during diversification of muscle and heart precursors. Genes Dev. 2007;21:3163–3180. doi: 10.1101/gad.437307. [DOI] [PMC free article] [PubMed] [Google Scholar]
- ••20.Estrada B, Choe SE, Gisselbrecht SS, Michaud S, Raj L, Busser BW, Halfon MS, Church GM, Michelson AM. An Integrated Strategy for Analyzing the Unique Developmental Programs of Different Myoblast Subtypes. PLoS Genet. 2006;2:e16. doi: 10.1371/journal.pgen.0020016.. Along with [21••], the authors took an integrative strategy combining genetic, genomic and computational methodologies to define the myoblast regulatory network. A statistical meta-analysis was used to predict novel myoblast genes from expression profiles of flow-sorted primary mesodermal cells in which myoblast specification was systematically perturbed in predictable ways. Bioinformatics methods were then used to ask if these subsets of myoblast genes are subject to a common cis regulatory logic. From a previously characterized myoblast CRM [23], a transcriptional regulatory model of myoblast regulation was hypothesized and the relevance of the regulatory model to different clusters of genes was ascertained with a novel computational algorithm. A high proportion of predicted CRMs were functional when tested in transgenic reporter assays. This integrative genomics approach provides a framework for similar studies in other systems.
- ••21.Philippakis AA, Busser BW, Gisselbrecht SS, He FS, Estrada B, Michelson AM, Bulyk ML. Expression-guided in silico evaluation of candidate cis regulatory codes for Drosophila muscle founder cells. PLoS Comput Biol. 2006;2:e53. doi: 10.1371/journal.pcbi.0020053.. See annotation to [20••].
- 22.Estrada B, Gisselbrecht SS, Michelson AM. The transmembrane protein Perdido interacts with Grip and integrins to mediate myotube projection and attachment in the Drosophila embryo. Development. 2007;134:4469–4478. doi: 10.1242/dev.014027. [DOI] [PubMed] [Google Scholar]
- 23.Estrada B, Maeland AD, Gisselbrecht SS, Bloor JW, Brown NH, Michelson AM. The MARVEL domain protein, Singles Bar, is required for progression past the pre-fusion complex stage of myoblast fusion. Dev Biol. 2007;307:328–339. doi: 10.1016/j.ydbio.2007.04.045. [DOI] [PMC free article] [PubMed] [Google Scholar]
- 24.Halfon MS, Carmena A, Gisselbrecht S, Sackerson CM, Jiménez F, Baylies MK, Michelson AM. Ras pathway specificity is determined by the integration of multiple signal-activated and tissue-restricted transcription factors. Cell. 2000;103:63–74. doi: 10.1016/s0092-8674(00)00105-7. [DOI] [PubMed] [Google Scholar]
- 25.Warner JB, Philippakis AA, Jaeger SA, He FS, Lin J, Bulyk ML. Systematic identification of mammalian regulatory motifs’ target genes and functions. Nat Methods. 2008;5:347–353. doi: 10.1038/nmeth.1188. [DOI] [PMC free article] [PubMed] [Google Scholar]
- ••26.Berger MF, Badis G, Gehrke AR, Talukder S, Philippakis AA, Pena-Castillo L, Alleyne TM, Mnaimneh S, Botvinnik OB, Chan ET, et al. Variation in homeodomain DNA binding revealed by high-resolution analysis of sequence preferences. Cell. 2008;133:1266–1276. doi: 10.1016/j.cell.2008.05.024.. Previously it had been thought that homeodomain TFs bind a restricted repertoire of identical motifs (i.e., TAAT). However, this paper, along with [28••] showed that different classes of homeodomain TFs have unique TF binding sites. Thus, genome-wide computational scans for these sites are more likely to find the binding site for the appropriate TF. Also, cataloging TF binding sites in this manner will help in predicting gene expression from primary genomic sequences.
- 27.Berger MF, Philippakis AA, Qureshi AM, He FS, Estep PW, 3rd, Bulyk ML. Compact, universal DNA microarrays to comprehensively determine transcription-factor binding site specificities. Nat Biotechnol. 2006;24:1429–1435. doi: 10.1038/nbt1246. [DOI] [PMC free article] [PubMed] [Google Scholar]
- ••28.Noyes MB, Christensen RG, Wakabayashi A, Stormo GD, Brodsky MH, Wolfe SA. Analysis of homeodomain specificities allows the family-wide prediction of preferred recognition sites. Cell. 2008;133:1277–1289. doi: 10.1016/j.cell.2008.05.023.. See Annotation to [26••].
- 29.Stark A, Lin MF, Kheradpour P, Pedersen JS, Parts L, Carlson JW, Crosby MA, Rasmussen MD, Roy S, Deoras AN, et al. Discovery of functional elements in 12 Drosophila genomes using evolutionary signatures. Nature. 2007;450:219–232. doi: 10.1038/nature06340. [DOI] [PMC free article] [PubMed] [Google Scholar]
- 30.Xie X, Lu J, Kulbokas EJ, Golub TR, Mootha V, Lindblad-Toh K, Lander ES, Kellis M. Systematic discovery of regulatory motifs in human promoters and 3’ UTRs by comparison of several mammals. Nature. 2005;434:338–345. doi: 10.1038/nature03441. [DOI] [PMC free article] [PubMed] [Google Scholar]
- 31.Fowlkes CC, Hendriks CL, Keranen SV, Weber GH, Rubel O, Huang MY, Chatoor S, DePace AH, Simirenko L, Henriquez C, et al. A quantitative spatiotemporal atlas of gene expression in the Drosophila blastoderm. Cell. 2008;133:364–374. doi: 10.1016/j.cell.2008.01.053. [DOI] [PubMed] [Google Scholar]
- 32.Lein ES, Hawrylycz MJ, Ao N, Ayres M, Bensinger A, Bernard A, Boe AF, Boguski MS, Brockway KS, Byrnes EJ, et al. Genome-wide atlas of gene expression in the adult mouse brain. Nature. 2007;445:168–176. doi: 10.1038/nature05453. [DOI] [PubMed] [Google Scholar]
- 33.Espina V, Heiby M, Pierobon M, Liotta LA. Laser capture microdissection technology. Expert Rev Mol Diagn. 2007;7:647–657. doi: 10.1586/14737159.7.5.647. [DOI] [PubMed] [Google Scholar]
- ••34.Christiaen L, Davidson B, Kawashima T, Powell W, Nolla H, Vranizan K, Levine M. The transcription/migration interface in heart precursors of Ciona intestinalis. Science. 2008;320:1349–1352. doi: 10.1126/science.1158170.. The authors used an integrative genomics approach comprised of cell sorting, expression profiling, and cis and trans tests of gene function to comprehensively describe the transcriptional networks that control the subnetwork of genes directing heart cell migration in Ciona.
- 35.Reeves N, Posakony JW. Genetic programs activated by proneural proteins in the developing Drosophila PNS. Dev Cell. 2005;8:413–425. doi: 10.1016/j.devcel.2005.01.020. [DOI] [PubMed] [Google Scholar]
- •36.Brady SM, Orlando DA, Lee JY, Wang JY, Koch J, Dinneny JR, Mace D, Ohler U, Benfey PN. A high-resolution root spatiotemporal map reveals dominant expression patterns. Science. 2007;318:801–806. doi: 10.1126/science.1146265.. A combination of microdissection and fluorescence-activated cell sorting was employed to generate gene expression profiles of fourteen cell types at distinct developmental stages in the Arabidopsis root. Resulting transcriptional signatures predicted novel cellular functions.
- 37.Shendure J. The beginning of the end for microarrays? Nat Methods. 2008;5:585–587. doi: 10.1038/nmeth0708-585. [DOI] [PubMed] [Google Scholar]
- 38.Lee TI, Rinaldi NJ, Robert F, Odom DT, Bar-Joseph Z, Gerber GK, Hannett NM, Harbison CT, Thompson CM, Simon I, et al. Transcriptional regulatory networks in Saccharomyces cerevisiae. Science. 2002;298:799–804. doi: 10.1126/science.1075090. [DOI] [PubMed] [Google Scholar]
- 39.Shen-Orr SS, Milo R, Mangan S, Alon U. Network motifs in the transcriptional regulation network of Escherichia coli. Nat Genet. 2002;31:64–68. doi: 10.1038/ng881. [DOI] [PubMed] [Google Scholar]
- 40.Li XY, MacArthur S, Bourgon R, Nix D, Pollard DA, Iyer VN, Hechmer A, Simirenko L, Stapleton M, Luengo Hendriks CL, et al. Transcription factors bind thousands of active and inactive regions in the Drosophila blastoderm. PLoS Biol. 2008;6:e27. doi: 10.1371/journal.pbio.0060027. [DOI] [PMC free article] [PubMed] [Google Scholar]
- ••41.Zhu J, Zhang B, Smith EN, Drees B, Brem RB, Kruglyak L, Bumgarner RE, Schadt EE. Integrating large-scale functional genomic data to dissect the complexity of yeast regulatory networks. Nat Genet. 2008;40:854–861. doi: 10.1038/ng.167.. Along with [53••,54••], these studies have shown that by combining multiple unique genetic and genomic data sets, novel genetic interactions can be accurately predicted and regulatory circuit diagrams can be constructed with high accuracy. An important point is the integration of multiple unique genome-scale data sets including expression profiling, physical and genetic interactions, literature mining, gene annotation, and TF binding site data to build probabilistic networks of component interactions.
- 42.Bernard A, Hartemink AJ. Informative structure priors: joint learning of dynamic regulatory networks from multiple types of data. Pac Symp Biocomput. 2005:459–470. [PubMed] [Google Scholar]
- 43.Hughes TR, Marton MJ, Jones AR, Roberts CJ, Stoughton R, Armour CD, Bennett HA, Coffey E, Dai H, He YD, et al. Functional discovery via a compendium of expression profiles. Cell. 2000;102:109–126. doi: 10.1016/s0092-8674(00)00015-5. [DOI] [PubMed] [Google Scholar]
- 44.Lamb J, Crawford ED, Peck D, Modell JW, Blat IC, Wrobel MJ, Lerner J, Brunet JP, Subramanian A, Ross KN, et al. The Connectivity Map: using gene-expression signatures to connect small molecules, genes, and disease. Science. 2006;313:1929–1935. doi: 10.1126/science.1132939. [DOI] [PubMed] [Google Scholar]
- 45.Giot L, Bader JS, Brouwer C, Chaudhuri A, Kuang B, Li Y, Hao YL, Ooi CE, Godwin B, Vitols E, et al. A protein interaction map of Drosophila melanogaster. Science. 2003;302:1727–1736. doi: 10.1126/science.1090289. [DOI] [PubMed] [Google Scholar]
- 46.Li S, Armstrong CM, Bertin N, Ge H, Milstein S, Boxem M, Vidalain PO, Han JD, Chesneau A, Hao T, et al. A map of the interactome network of the metazoan C. elegans. Science. 2004;303:540–543. doi: 10.1126/science.1091403. [DOI] [PMC free article] [PubMed] [Google Scholar]
- 47.Uetz P, Giot L, Cagney G, Mansfield TA, Judson RS, Knight JR, Lockshon D, Narayan V, Srinivasan M, Pochart P, et al. A comprehensive analysis of protein-protein interactions in Saccharomyces cerevisiae. Nature. 2000;403:623–627. doi: 10.1038/35001009. [DOI] [PubMed] [Google Scholar]
- 48.Gavin AC, Aloy P, Grandi P, Krause R, Boesche M, Marzioch M, Rau C, Jensen LJ, Bastuck S, Dumpelfeld B, et al. Proteome survey reveals modularity of the yeast cell machinery. Nature. 2006;440:631–636. doi: 10.1038/nature04532. [DOI] [PubMed] [Google Scholar]
- 49.Krogan NJ, Cagney G, Yu H, Zhong G, Guo X, Ignatchenko A, Li J, Pu S, Datta N, Tikuisis AP, et al. Global landscape of protein complexes in the yeast Saccharomyces cerevisiae. Nature. 2006;440:637–643. doi: 10.1038/nature04670. [DOI] [PubMed] [Google Scholar]
- 50.Collins SR, Miller KM, Maas NL, Roguev A, Fillingham J, Chu CS, Schuldiner M, Gebbia M, Recht J, Shales M, et al. Functional dissection of protein complexes involved in yeast chromosome biology using a genetic interaction map. Nature. 2007;446:806–810. doi: 10.1038/nature05649. [DOI] [PubMed] [Google Scholar]
- 51.Davierwala AP, Haynes J, Li Z, Brost RL, Robinson MD, Yu L, Mnaimneh S, Ding H, Zhu H, Chen Y, et al. The synthetic genetic interaction spectrum of essential genes. Nat Genet. 2005;37:1147–1152. doi: 10.1038/ng1640. [DOI] [PubMed] [Google Scholar]
- 52.Lehner B, Crombie C, Tischler J, Fortunato A, Fraser AG. Systematic mapping of genetic interactions in Caenorhabditis elegans identifies common modifiers of diverse signaling pathways. Nat Genet. 2006;38:896–903. doi: 10.1038/ng1844. [DOI] [PubMed] [Google Scholar]
- ••53.Lee I, Lehner B, Crombie C, Wong W, Fraser AG, Marcotte EM. A single gene network accurately predicts phenotypic effects of gene perturbation in Caenorhabditis elegans. Nat Genet. 2008;40:181–188. doi: 10.1038/ng.2007.70.. See Annotation to [41••].
- ••54.Zhong W, Sternberg PW. Genome-wide prediction of C. elegans genetic interactions. Science. 2006;311:1481–1484. doi: 10.1126/science.1123287.. See Annotation to [41••].
- ••55.Bakal C, Aach J, Church G, Perrimon N. Quantitative morphological signatures define local signaling networks regulating cell morphology. Science. 2007;316:1753–1756. doi: 10.1126/science.1140324.. In this paper, the authors identify signaling networks regulating cell morphology by manipulating gene expression in fluorescently labeled cells by RNAi or overexpression yielding 145 distinct morphological features. Hierarchical clustering was used to define clusters of genes showing similar morphological features involved in cell adhesion and membrane protrusion and tension. Utilizing the approach for small molecule screening and diagnosing clinical samples are logical extensions of this work, and extending the approach to clustering developmental phenotypes is especially exciting.
- 56.Orkin SH. Diversification of haematopoietic stem cells to specific lineages. Nat Rev Genet. 2000;1:57–64. doi: 10.1038/35049577. [DOI] [PubMed] [Google Scholar]
- 57.Jaenisch R, Young R. Stem cells, the molecular circuitry of pluripotency and nuclear reprogramming. Cell. 2008;132:567–582. doi: 10.1016/j.cell.2008.01.015. [DOI] [PMC free article] [PubMed] [Google Scholar]
- 58.Morrison SJ, Spradling AC. Stem cells and niches: mechanisms that promote stem cell maintenance throughout life. Cell. 2008;132:598–611. doi: 10.1016/j.cell.2008.01.038. [DOI] [PMC free article] [PubMed] [Google Scholar]
- 59.Ivanova N, Dobrin R, Lu R, Kotenko I, Levorse J, DeCoste C, Schafer X, Lun Y, Lemischka IR. Dissecting self-renewal in stem cells with RNA interference. Nature. 2006;442:533–538. doi: 10.1038/nature04915. [DOI] [PubMed] [Google Scholar]
- 60.Takahashi K, Yamanaka S. Induction of pluripotent stem cells from mouse embryonic and adult fibroblast cultures by defined factors. Cell. 2006;126:663–676. doi: 10.1016/j.cell.2006.07.024. [DOI] [PubMed] [Google Scholar]
- 61.Takahashi K, Tanabe K, Ohnuki M, Narita M, Ichisaka T, Tomoda K, Yamanaka S. Induction of pluripotent stem cells from adult human fibroblasts by defined factors. Cell. 2007;131:861–872. doi: 10.1016/j.cell.2007.11.019. [DOI] [PubMed] [Google Scholar]
- 62.Yu J, Vodyanik MA, Smuga-Otto K, Antosiewicz-Bourget J, Frane JL, Tian S, Nie J, Jonsdottir GA, Ruotti V, Stewart R, et al. Induced pluripotent stem cell lines derived from human somatic cells. Science. 2007;318:1917–1920. doi: 10.1126/science.1151526. [DOI] [PubMed] [Google Scholar]
- 63.Boyer LA, Lee TI, Cole MF, Johnstone SE, Levine SS, Zucker JP, Guenther MG, Kumar RM, Murray HL, Jenner RG, et al. Core transcriptional regulatory circuitry in human embryonic stem cells. Cell. 2005;122:947–956. doi: 10.1016/j.cell.2005.08.020. [DOI] [PMC free article] [PubMed] [Google Scholar]
- •64.Chen X, Xu H, Yuan P, Fang F, Huss M, Vega VB, Wong E, Orlov YL, Zhang W, Jiang J, et al. Integration of external signaling pathways with the core transcriptional network in embryonic stem cells. Cell. 2008;133:1106–1117. doi: 10.1016/j.cell.2008.04.043.. This study used ChIP-seq to map the locations of 13 TFs and 2 transcription regulators in mouse ES cells. The authors describe clusters of TF binding throughout the genome and they show the regions are functional by testing their activity in transgenic reporter assays and by showing their association with the transcriptional activator p300 and with ES-expressed genes. Integrating these data with previous gene expression profiles, they construct a transcriptional regulatory network for ES cell-specific gene expression.
- 65.Kim J, Chu J, Shen X, Wang J, Orkin SH. An extended transcriptional network for pluripotency of embryonic stem cells. Cell. 2008;132:1049–1061. doi: 10.1016/j.cell.2008.02.039. [DOI] [PMC free article] [PubMed] [Google Scholar]
- 66.Loh YH, Wu Q, Chew JL, Vega VB, Zhang W, Chen X, Bourque G, George J, Leong B, Liu J, et al. The Oct4 and Nanog transcription network regulates pluripotency in mouse embryonic stem cells. Nat Genet. 2006;38:431–440. doi: 10.1038/ng1760. [DOI] [PubMed] [Google Scholar]
- 67.Ivanova NB, Dimos JT, Schaniel C, Hackney JA, Moore KA, Lemischka IR. A stem cell molecular signature. Science. 2002;298:601–604. doi: 10.1126/science.1073823. [DOI] [PubMed] [Google Scholar]
- 68.Lee TI, Jenner RG, Boyer LA, Guenther MG, Levine SS, Kumar RM, Chevalier B, Johnstone SE, Cole MF, Isono K, et al. Control of developmental regulators by Polycomb in human embryonic stem cells. Cell. 2006;125:301–313. doi: 10.1016/j.cell.2006.02.043. [DOI] [PMC free article] [PubMed] [Google Scholar]
- •69.Mikkelsen TS, Hanna J, Zhang X, Ku M, Wernig M, Schorderet P, Bernstein BE, Jaenisch R, Lander ES, Meissner A. Dissecting direct reprogramming through integrative genomic analysis. Nature. 2008 doi: 10.1038/nature07056.. Here the authors found that reprogrammed somatic cells are very similar in gene expression and epigenetic state to an ES cell. However, partially reprogrammed cells showed incomplete repression of differentiation genes and genes associated with pluripotency were not demethylated. Thus, utilizing an integrative systems-level approach, the authors were able to define the molecular basis of the reprogramming phenomenon and demonstrated that targeting the limiting step could enhance reprogramming efficiency.
- 70.Mikkelsen TS, Ku M, Jaffe DB, Issac B, Lieberman E, Giannoukos G, Alvarez P, Brockman W, Kim TK, Koche RP, et al. Genome-wide maps of chromatin state in pluripotent and lineage-committed cells. Nature. 2007;448:553–560. doi: 10.1038/nature06008. [DOI] [PMC free article] [PubMed] [Google Scholar]
- 71.Wang J, Rao S, Chu J, Shen X, Levasseur DN, Theunissen TW, Orkin SH. A protein interaction network for pluripotency of embryonic stem cells. Nature. 2006;444:364–368. doi: 10.1038/nature05284. [DOI] [PubMed] [Google Scholar]
- 72.Ramalho-Santos M, Yoon S, Matsuzaki Y, Mulligan RC, Melton DA. “Stemness”: transcriptional profiling of embryonic and adult stem cells. Science. 2002;298:597–600. doi: 10.1126/science.1072530. [DOI] [PubMed] [Google Scholar]
- 73.Nakagawa M, Koyanagi M, Tanabe K, Takahashi K, Ichisaka T, Aoi T, Okita K, Mochiduki Y, Takizawa N, Yamanaka S. Generation of induced pluripotent stem cells without Myc from mouse and human fibroblasts. Nat Biotechnol. 2008;26:101–106. doi: 10.1038/nbt1374. [DOI] [PubMed] [Google Scholar]
- 74.Huangfu D, Maehr R, Guo W, Eijkelenboom A, Snitow M, Chen AE, Melton DA. Induction of pluripotent stem cells by defined factors is greatly improved by small-molecule compounds. Nat Biotechnol. 2008 doi: 10.1038/nbt1418. [DOI] [PMC free article] [PubMed] [Google Scholar]
- •75.Oliveri P, Tu Q, Davidson EH. Global regulatory logic for specification of an embryonic cell lineage. Proc Natl Acad Sci U S A. 2008;105:5955–5962. doi: 10.1073/pnas.0711220105.. The authors used a systematic approach to define the transcriptional regulatory network governing specification and differentiation of the sea urchin skeletogenic lineage. The approach included defining regulatory TF expression, monitoring gene expression changes following morpholino knockdown of candidate TFs, and examination of CRM structure from selected genes.
- 76.Paddison PJ, Silva JM, Conklin DS, Schlabach M, Li M, Aruleba S, Balija V, O’Shaughnessy A, Gnoj L, Scobie K, et al. A resource for large-scale RNA-interference-based screens in mammals. Nature. 2004;428:427–431. doi: 10.1038/nature02370. [DOI] [PubMed] [Google Scholar]
- 77.Silva JM, Li MZ, Chang K, Ge W, Golding MC, Rickles RJ, Siolas D, Hu G, Paddison PJ, Schlabach MR, et al. Second-generation shRNA libraries covering the mouse and human genomes. Nat Genet. 2005;37:1281–1288. doi: 10.1038/ng1650. [DOI] [PubMed] [Google Scholar]
- 78.Michnick SW, Ear PH, Manderson EN, Remy I, Stefan E. Universal strategies in research and drug discovery based on protein-fragment complementation assays. Nat Rev Drug Discov. 2007;6:569–582. doi: 10.1038/nrd2311. [DOI] [PubMed] [Google Scholar]