Abstract
Objective
We sought to determine the genetic factors contributing to atherosclerotic plaque size and cellular composition in the innominate artery, a murine model of advanced atherosclerosis.
Methods and Results
We examined genetic contributions to innominate atherosclerotic plaque size and cellular composition in an intercross between C57BL/6J.Apoe-/-, a strain susceptible to aortic lesions, and C3H/HeJ.Apoe-/-, a strain resistant to aortic lesions. Surprisingly, total innominate lesion size was similar in the two strains. Genetic analyses identified one novel locus on Chromosome 2 for innominate artery lesion size, a significant locus for fibrous cap thickness on Chromosome 15, and several suggestive loci for cellular composition, all distinct from loci influencing aortic lesions. The Chromosome 2 locus contains a candidate, CD44. We show that CD44 is expressed in the innominate artery and differs strikingly in expression between the parental strains.
Conclusion
Multiple aspects of innominate lesion composition are genetically determined, but in a manner largely independent of the genetic contributions to aortic lesions.
Keywords: Innominate artery, QTL, Atherosclerosis, Plaque stability
Introduction
Atherosclerosis, the underlying pathological condition leading to most forms of cardiovascular disease, results from a complex interaction between genetic and environmental factors. The use of inbred strains to dissect the genetic factors contributing to atherosclerosis has yielded over 30 loci contributing to atherosclerotic plaque burden (mouse genome informatics, http://www.informatics.jax.org/searches/allele_form.shtml). These studies have primarily focused on lesion development in the aortic sinus1-8. Several studies have also shown that aneurysms, calcification and chondroplastic metaplasia in the aortic sinus are genetically regulated9, 10. Recently we have mapped the loci contributing to atherosclerosis in a cross between C3H/HeJ.Apoe-/-(C3H.Apoe-/-). C57BL/6J.Apoe-/- (B6.Apoe-/-) mice on high fat11 and normal chow diets12.
An alternative site to model atherosclerosis in mice, the innominate or brachiocephalic artery, was initially described by Rosenfeld et al13. Advanced lesions in the innominate artery, referred to henceforth as IA, have several morphological characteristics that are similar to human lesions, including: intra-plaque hemorrhage, acellularity, thin fibrous caps, lateral xanthomas, large necrotic cores and calcification. To date there have been no studies that have investigated the genetic loci contributing to IA lesion size or plaque characteristics.
We now report the identification of loci contributing to IA lesion size and cellular composition, utilizing an F2 intercross between C3H.Apoe-/- and B6.Apoe-/- strains fed a “Western” high-fat diet. Several clinically important traits were found to segregate and, surprisingly, the loci influencing the IA lesion size differed strikingly from those for the aortic sinus.
Methods
Breeding, diets, and assays
B6.Apoe-/- mice were purchased from The Jackson Laboratory and C3H.Apoe-/- mice were bred by backcrossing B6.Apoe-/- to C3H/HeJ for 10 generations. F2 mice (BxH Apoe-/-) were generated by crossing B6.Apoe-/- with C3H.Apoe-/- and subsequently intercrossing the F1 mice as described 12. The mice were fed Purina Chow containing 4% fat until 8 weeks of age, and then placed on a Western diet (Teklad 88137) containing 42% fat and 0.15% cholesterol for 16 weeks until euthanasia at 24 weeks of age. Mice were fasted for 4 hours prior to collection of blood. Plasma triglycerides, total cholesterol, unesterified cholesterol, HDL cholesterol, LDL/VLDL cholesterol, glucose and free fatty acids were measured as previously described14.
Histology
The entire IA from 86 F2 mice and 19 parental mice was dissected, embedded in OCT, and serially sectioned (10 μm). Every other section was collected and every third section was stained with Movat’s Pentachrome stain15. The average lesion area, necrotic core area and maximal fibrous cap thickness were quantitated throughout the IA using an ocular with an μm2 grid. Plaque composition and stability were evaluated by assessing the frequency of the following features: medial erosion (defined as the replacement of the normal media by plaque components), foam cells, buried fibrous caps, chondrocyte-like cells and lateral xanthomas (defined as the presence of aggregates of macrophage-derived foam cells situated on the lateral margins of the plaques). These were recorded as binary outcomes, and the frequency for each animal was determined. The results were assessed by two independent investigators (BJB and XW) and averaged. Detailed methods for CD44 immunochemistry are supplied in the supplemental methods.
Linkage Analysis and Expression Array Profiling
A genetic map with markers about 1.5 cM apart was constructed using SNP markers as described 12. Quantitative trait locus (QTL analysis was performed using R/qtl package16, using single marker linear regression to model QTL effects. The following traits were bimodal and were modeled using the 2-part QTL model: lateral xanthomas, chondrocyte-like cells, buried fibrous caps and thickness of the fibrous cap17. Significant QTL were determined at a genome-wide p-value of <0.05 and suggestive QTL were determined at a p value <0.63. The latter corresponds to one false positive per genome scan18. The LOD scores corresponding to significant and suggestive QTL were determined by permuting the data 1000 times19. The 95% confidence interval for QTL was determined using the 1.5 LOD drop.
RNA was isolated from tissues of the F2 mice using Trizol and microarray analysis was performed on the RNA using 60mer oligonucleotide chips (Agilent Technologies) as previously described 12. Expression data can be obtained from GEO databases for liver (GSE2814). Expression data in the form of mean log ratios (mlratios) were treated as a quantitative trait in eQTL analysis as previously reported 11.
Results
We extensively characterized the IA lesions, including lesion size, necrotic core size, thickness of fibrous caps, number of buried fibrous caps, chondrocyte-like cells, lateral xanthomas and medial disruption in C3H.Apoe-/-, B6.Apoe-/-, and F2 intercross mice. Representative lesions are shown in Figure 1. Summary data for male and female parental strains and F2 mice are summarized in Table 1.
Figure 1. Susceptibility and resistance to development of Advanced Atherosclerosis in an F2 Cross.

Representative sections from innominate artery of F2 cross between C57BL/6 mice and C3H mice.
Table 1.
Atherosclerotic Phenotypes
| Trait | C3H.Apoe-/- (n) | C57BL/6J.Apoe-/- (n) | F2 Cross | |
|---|---|---|---|---|
| Lesion Size μm2 | Male | 149,936 ± 44,623 (8) | 168,478 ± 58,914 (4) | 82,818 ± 57,936 (49) |
| Female | 118,281±13,623 (2) | 128,409 ± 37,964 (5) | 75,138 ± 59,169 (37) | |
| Necrotic Core μm2 | Male | 63,766 ± 23,653 | 60,870 ± 25,644 | 23,129 ± 22,312 |
| Female | 48,125 ± 12,128 | 41,136 ± 28,522 | 16,856 ± 16,878 | |
| Chondrocyte-like Cell (% sections) | Male | 1 ±11 | 17 ± 39 | 6 ± 13 |
| Female | 0 ± 0 | 0 ± 0 | 4±8 | |
| Lateral Xanthomas (% sections) | Male | 18 ± 19 | 53±20 | 24±33 |
| Female | 8 ± 11 | 21± 20 | 16±24 | |
| Buried Fibrous Caps (% sections) | Male | 81 ± 40 | 52± 51 | 24±28 |
| Female | 88 ± 34 | 48 ± 51 | 31±33 | |
| Fibrous Cap Thickness (Average # of cells) | Male | 1.54 ± 0.81 | 2.5 ± 0.4 | 1.4±1.34 |
| Female | 1.7 ± 0.47 | 1.54 ± 1.2 | 1.3 ±1.44 |
denotes P<0.05 All other differences are non-significant
Lack of association of IA plaque size with sex or plasma lipids
Males and females exhibited significant differences in almost all clinical traits related to atherosclerosis including body weight, total cholesterol, HDL cholesterol and triglycerides, (Supplemental Table 1), and we previously reported marked sex differences in atherosclerosis at the aortic sinus11. However, there were no sex differences in the IA lesion size or cellular composition (Table 1). Although sex differences were not seen in the parental strains they may exist for an individual locus and thus we examined the effect of sex using an additive and an interactive model. However, we did not observe significant effect sex on the IA plaque traits (data not shown) and thus we report here unadjusted LOD scores.
There were no significant correlations between IA atherosclerosis and several risk factors for atherosclerosis, including body weight, adiposity and plasma lipoproteins, and IA plaque size (Supplemental Table 1). In general the extent of atherosclerosis at the IA and the aorta were concordant as demonstrated by the strong correlations between IA lesion size, plaque cellular composition and aortic lesion size (Supplemental Table 2).
Genetic determinants of lesion size and plaque composition for advanced lesions in the IA
Notably, we identified a significant QTL contributing to IA lesion size on Chromosome 2 at about 53.5 cM (Fig. 2a). Unexpectedly, the susceptible allele is from C3H rather than B6 (Figure 2c). Additionally we observed suggestive QTL’s contributing to lesion size on Chromosomes 9, 13, and 15 (Table 2).
Figure 2. Innominate Artery Lesion Size QTL.
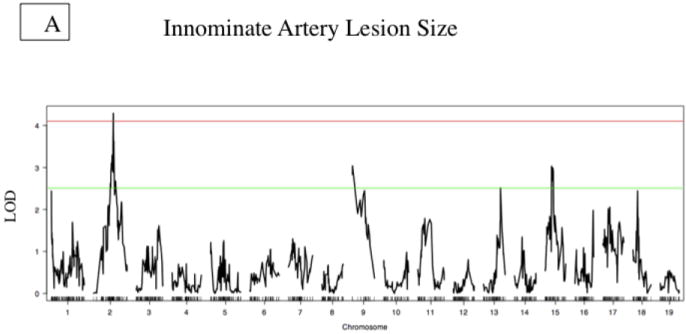
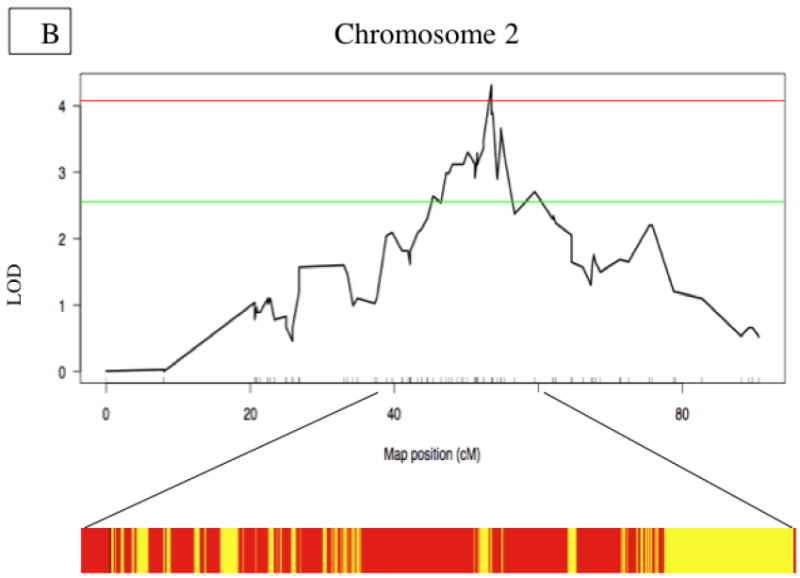
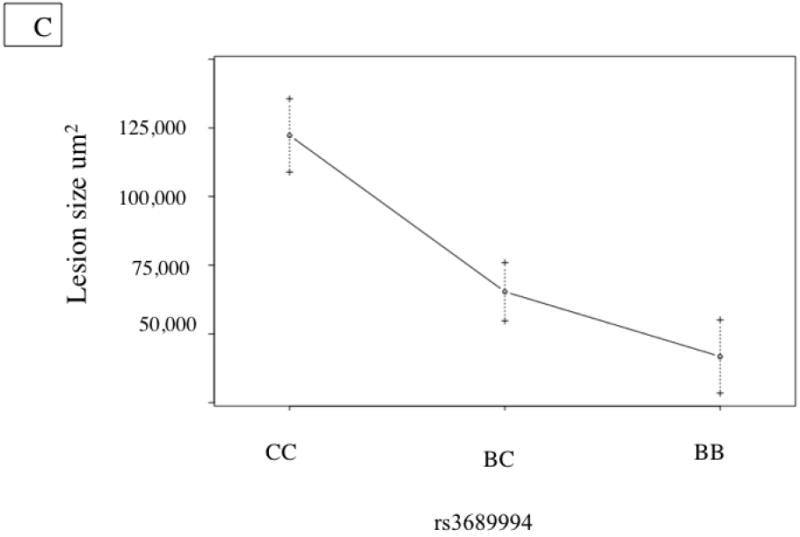
A. Whole genome LOD score plots for Lesion Size in the innominate artery. Red line denotes significance threshold (p<0.05) and the green line denotes suggestive threshold (p<0.63) as determined by permutation testing. B. QTL plot for chromosome 2 locus (top). Bars indicate 85% CI of the QTL. Regions that are identical by descent between C57BL/6J and C3H are shaded yellow and regions of unshared genotypes are shaded in Red. C. The allele distributions for the innominate lesion size locus. CC= C3H homozygotes, BC=heterozygotes, BB=C57BL/6J homozygotes
Table 2.
Summary QTL Results
| Phenotype | Marker | chr | pos cM | lod | pval | % Variance | Significance | Susceptible Allele |
|---|---|---|---|---|---|---|---|---|
| Innominate Lesion Size | rs3689994 | 2 | 53.5 | 4.31 | 0.03* | 5.6 | Significant | C3H |
| mCV23201775 | 9 | 0 | 3.08 | 0.29 | 9.3 | Suggestive | B6 | |
| rs3697753 | 13 | 45.9 | 2.57 | 0.62 | 7.0 | Suggestive | B6 | |
| rs3707900 | 15 | 17.3 | 2.98 | 0.33 | 3.2 | Suggestive | C3H | |
| Fibrous Cap Thickness | rs3653368 | 15 | 20.2 | 3.9 | .050* | 11.8 | Significant | B6 |
| rs4138743 | 5 | 34.4 | 3.07 | 0.52 | 14.9 | Suggestive | C3H | |
| rs3680085 | 8 | 17.9 | 2.8 | 0.41 | 1.6 | Suggestive | B6 | |
| rs3664831 | 18 | 12.3 | 3.56 | 0.61 | 3.7 | Suggestive | C3H | |
| Buried Fibrous Cap | rs3655280 | 11 | 48 | 4.22 | 0.052 | 4.7 | Suggestive | C3H |
| rs3701463 | 2 | 55.3 | 3.2 | 0.37 | 1.0 | Suggestive | C3H | |
| rs3701047 | 4 | 4 | 3.4 | 0.20 | 7.6 | Suggestive | B6 | |
| Necrotic Core Size | rs3688042 | 1 | 56.8 | 3.8 | 0.08 | 4 | Suggestive | B6 |
| rs3662347 | 2 | 26.8 | 2.63 | 0.58 | 2.7 | Suggestive | C3H | |
| rs3680603 | 6 | 56 | 3.04 | 0.30 | 2.7 | Suggestive | C3H | |
| rs3663595 | 15 | 21.4 | 3.46 | 0.15 | 7.7 | Suggestive | C3H | |
| rs3699816 | 18 | 13.8 | 3.51 | 0.13 | 8.0 | Suggestive | B6 | |
| Medial Disruption | rs3698092 | 5 | 69 | 3.1 | 0.38 | Suggestive | B6 | |
| Lateral Xanthomas | rs3680028 | 2 | 39.7 | 4.1 | 0.06 | 4.5 | Suggestive | C3H |
| rs4138743 | 5 | 34.4 | 3.2 | 0.18 | 4.5 | Suggestive | B6 | |
| rs4226262 | 6 | 50.5 | 2.7 | 0.57 | 5.7 | Suggestive | C3H | |
| rs3696307 | 10 | 21.9 | 2.6 | 0.60 | 1.5 | Suggestive | B6 | |
| rs3676510 | 11 | 9.4 | 3.8 | 0.11 | 1.1 | Suggestive | Het | |
| rs3699072 | 14 | 21.3 | 2.7 | 0.43 | 4.9 | Suggestive | B6 | |
| rs3682563 | 16 | 13.1 | 3.3 | 0.22 | 3.1 | Suggestive | Het | |
| rs3717026 | 17 | 50 | 2.7 | 0.41 | 3.8 | Suggestive | C3H | |
| Chondrocyte-like Cells | rs3719258 | 7 | 54 | 3.95 | 0.48 | 2.8 | Suggestive | Het |
| rs3714012 | 9 | 15 | 6.83 | 0.07 | 3.8 | Suggestive | B6 | |
| rs3715939 | 16 | 0 | 5.53 | 0.36 | 1 | Suggestive | Het | |
Marker, marker under max LOD score; cM, location of marker; LOD, peak LOD score, P-value, Significance, Significant P<.05 determined by permutation testing, Suggestive P<0.63 determined by permutation testing.
Lesions in the innominate artery develop several characteristics similar to human atherosclerotic plaques, providing an opportunity to examine the genetics of atherosclerotic plaque composition. These include features of advanced atherosclerotic plaques such as chondrocyte-like cells, lateral xanthomas, buried caps and thickness of the fibrous cap. These traits are non-normally distributed and thus we use a 2-part QTL model17. Examples of lesions and their cellular composition as assessed by Movat’s Pentachrome stain are shown in Figure 1.
QTL analysis identified a significant locus on Chromosome 15 and three suggestive loci on Chromosomes 5, 8 and 18, contributing to fibrous cap thickness (Figure 3). Three suggestive loci for the genetic regulation of buried fibrous caps were identified on Chromosome 11 (p=0.052) and Chromosomes 2 and 4 (Table 2). Suggestive loci for necrotic core size, chondrocytes, lateral xanthomas and medial disruption are shown in supplemental Figures 1-5 and in Table 2.
Figure 3. Fibrous Cap Thickness QTL.
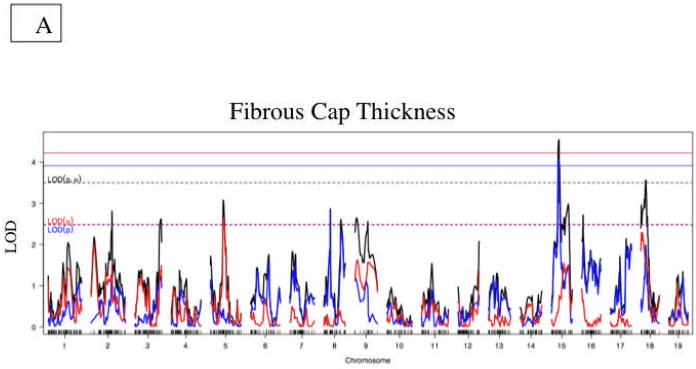
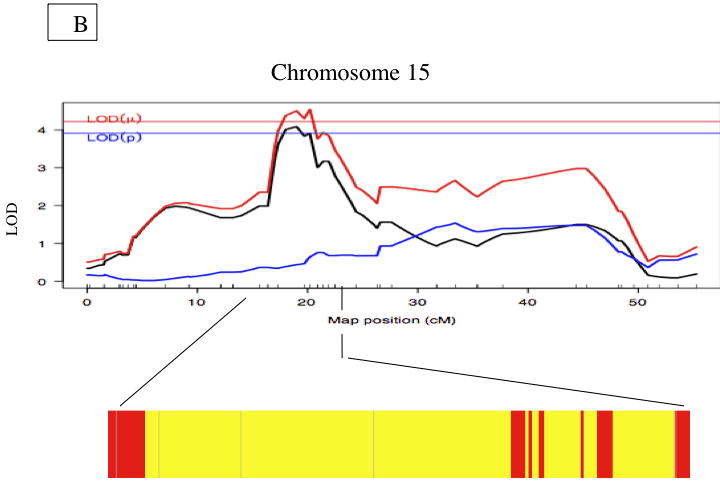
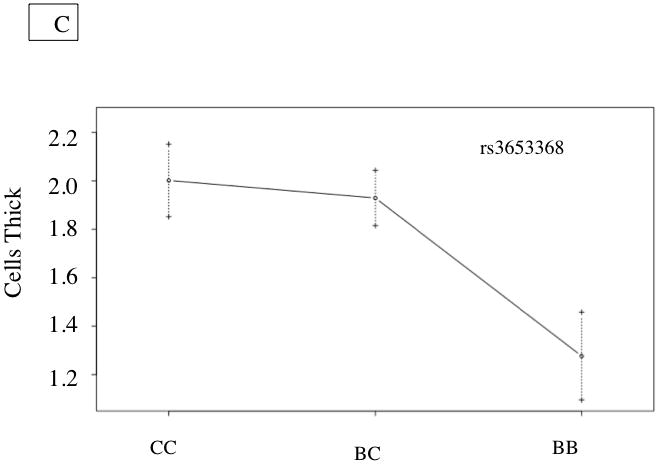
A. Whole genome LOD score plots for fibrous caps thickness in the innominate artery. Red line denotes significance threshold (p<0.05) and the yellow line denotes suggestive threshold (p<0.63) as determined by permutation testing. B. QTL plot for chromosome 15 locus (top). Bars indicate 85% CI of the QTL. Regions that are identical by descent between C57BL/6J and C3H are shaded yellow and regions of unshared genotypes are shaded in Red. C. The allele distributions for the fibrous cap thickness on Chromosome 15. CC= C3H homozygotes, BC=heterozygotes, BB=C57BL/6J homozygotes
Positional Candidate Genes
The 95% confidence interval for IA lesion size spans approximately 14 megabase and contains approximately 360 genes, while the locus for atherosclerotic cap thickness spans 9 megabase and contains approximately 40 genes. Both loci contain candidates based on the literature. For example, the Chromosome 2 locus contains proliferating nuclear cell antigen, associated with unstable plaques in humans20, and histidine decarboxylase and beta 2 microglobin, both associated with atherosclerosis21, 22.
We first identified genes that are in regions non-identical by descent between the 2 strains by querying the SNP genotyping available at the mouse hapmap project (http://mouse.perlegen.com/mouse/mousehap.html). Genes in regions identical by decent are unlikely to contain the causal gene(s) underlying the QTL since such regions have little genetic variation. As shown in Figure 2b, the lesion locus contains multiple regions, containing 327 genes, that are non-identical by descent between the 2 strains. However, the Chromosome 15 locus for fibrous cap thickness locus was identical by descent between the 2 strains, Figure 3b.
Another approach to narrow the list of candidate genes at a locus is to use transcript levels as an intermediate molecular phenotype. We first identified genes whose expression is correlated with the phenotype of interest, nominal p value <0.05. And second, we identified genes at the loci whose expression was regulated by proximal, presumably cis-acting, elements. These genes are listed in Supplemental Tables 3 and 4.
These approaches allowed us to refine our candidate list for IA lesion size. Within the chromosome 2 locus, there are 67 genes with local expression QTLs (eQTLs) in liver, including the previously mentioned genes, B2m, Pcna, Hdc, and Cd44. Of these CD44 is of particular interest since it was regulated by the Chr. 2 locus and its expression was significantly correlated with lesion size. CD44 is expressed by immune and vessel wall cells, binds extracellular matrix components including: osteopontin and hyaluronan, and is an important mediator of cell adhesion, motility and macrophage activation21. Multiple studies have identified CD44 as pro-atherogenic as CD44 accumulates in rupture-prone regions in human atherosclerotic lesions22 and double knockout CD44-/-/Apoe-/- have decreased atherosclerosis23. We confirm the expression of CD44 within IA plaques using immunochemistry and also observe strain specific expression of CD44 within atherosclerotic plaques. There is a 75% increase in the percent of lesion staining positive for CD44 in C3H.Apoe-/- mice compared B6.Apoe-/- mice (Fig. 4). This difference reached statistical significance using a Mann-Whitney test (p=0.02).
Figure 4. CD44 Expression in Advanced Atherosclerotic Plaques in the Innominate Artery.
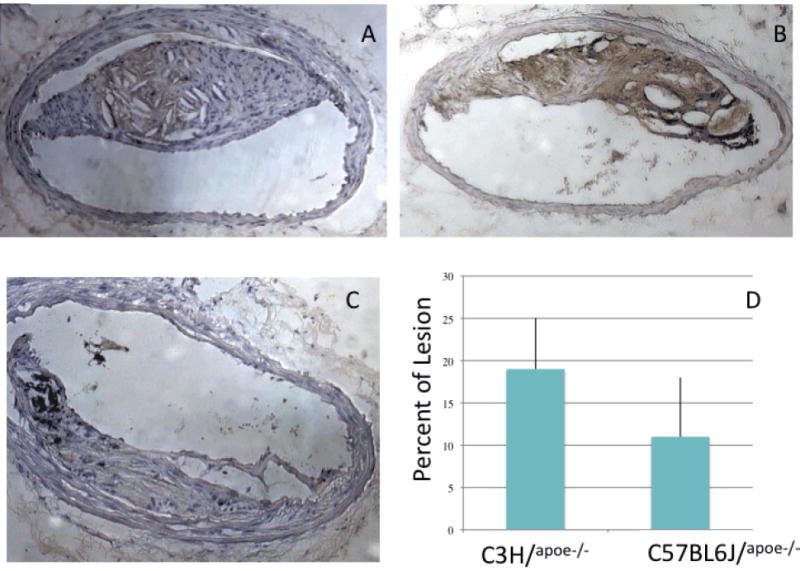
A. Representative micrograph depicting CD44 expression in B6ApoE-/- mice. B. Representative micrograph depicting CD44 expression in C3H/Apoe-/- mice. C. Rat IgG control. D. Quantification of immunostaining demonstrates significant increase in CD44 positive lesion area in C3H/Apoe-/- using Mann-Whitney test p=0.02.
No cis-eQTL for the fibrous cap thickness phenotype on Chr. 15 were observed, an expected finding given that C3H and B6 are identical by descent at the locus.
Discussion
Studies of atherosclerosis in mice have primarily focused on the aortic sinus and more recently the entire aorta as anatomical sites to study. We, among others5, 11, 12, 23-25, have characterized C3H mice as resistant to atherosclerosis based on our analysis of aortic root sections. Recently, we reported several loci contributing to atherosclerotic burden in the proximal aorta in a genetic cross of B6.Apoe-/- and C3H.Apoe-/- mice. In every case, except for the Ath33 locus, the B6 allele was associated with increased susceptibility. In the current study we have analyzed the atherosclerotic burden and morphological characteristics of advanced plaques in the IA from the cross of B6.Apoe-/- and C3H.Apoe-/- fed a high fat diet. Several significant findings have emerged. First, we have demonstrated that lesion size and cellular composition of the innominate artery are under genetic regulation. Second, we have identified a novel locus contributing to IA lesion size that did not significantly impact aortic lesion size. Third, we have used transcriptional profiling to prioritize candidate genes under the QTL peak. Each point is discussed below.
Surprisingly, plaque burden in the IA of C3H.Apoe-/- mice was similar to that of B6.Apoe-/- mice. Similarly, Maeda et al24 previously observed that Apoe-/- mice on a 129 background had smaller lesions in the aortic sinus but larger lesions in the aortic arch and the IA as compared to B6.Apoe-/- mice. Using candidate gene approaches several groups have shown site-specific effects on atherosclerosis. For example, Reardon and colleagues25 found that deficiency of mature T and B cells, using RAG-/-/Apoe-/- mice, reduced lesion size at the aortic sinus but not the IA. Subsequently, similar results were observed for RAG-/-/LDLR-/- mice26.
Atherosclerosis has long been known to be a site-specific disease27 and there have been disparate results between studies comparing atherosclerosis at the IA and aortic sinus27, 29, 31. Flow differences may mediate, in part the site specificity of atherosclerosis. Analysis of lesion size in the F2 population identified one novel significant QTL for IA lesion size on Chr. 2 and replicated several QTL previously identified for lesions in the proximal aorta. Additionally, Li et al reported a novel QTL for left common carotid lesion area on Chr. 12 in a different cross between B6.Apoe-/- and C3H.Apoe-/- mice28, indicating that there are different genes contributing to atherosclerotic burden in different vascular beds. The identification of a unique QTL for the IA in the present study indicates that the differences observed in previous studies between the aortic sinus and innominate artery may reflect both genetic and flow mediated differences between the two anatomical sites.
Using the same scoring criteria as Rosenfeld et al13, we assessed the lesions for several compositional characteristics: chondrocyte-like cells, lateral xanthomas, necrotic core size, thickness of the fibrous cap and buried fibrous caps. Previous reports indicate that both statins and OPG inactivation can significantly alter IA cellular composition33, 34. We now demonstrate that common genetic variation can dramatically affect both these lesion phenotypes and overall lesion size. We were able to detect one significant QTL for fibrous cap thickness and several suggestive QTL for each of these phenotypes. This represents the first conclusive evidence for a genetic contribution to these traits.
In order to identify novel candidates in the chromosome 2 locus we used an integrative expression analysis29 where we both identified cis-eQTL and genes whose expression was correlated with lesion size. Interestingly, the most correlated gene with IA lesion size was CD44, which also had a significant liver cis-eQTL. Previous reports have clearly implicated CD44 in the atherosclerosis36. Subsequent studies have shown that CD44 expression, in mice, varies between vascular sites and is highest in lesion prone sites37. Our own integrative genomics approach and the literature implicate CD44 as a strong candidate gene for follow-up. In order to better characterize CD44 as a positional candidate for this locus, we examined its expression in IA atherosclerotic lesions from C3H.Apoe-/- and B6.Apoe-/- mice. We observed that CD44 expression was significantly greater in C3H.Apoe-/- atherosclerotic lesions than B6.Apoe-/-lesions, further strengthening CD44 as a positional candidate for the Chr .2 IA lesion size locus. However, several other genes have cis-eQTL at the locus and are significantly correlated with IA lesion size and thus the evidence for CD44 is only suggestive.
Identifying the genetic regulation of fibrous cap thickness is significant because thinning or loss of fibrous cap thickness is thought to be one characteristic of vulnerable plaque30. We failed to identify eQTL within the 95% CI of this QTL, but this locus contains several genes already associated with various aspects of coronary artery disease. One interesting gene is Tnfrsf11b, which encodes a protein called osteoprotegerin (Opg). Human studies have shown correlation between plasma OPG levels and the severity and extent of CHD31 and heart failure32 and polymorphisms in the human OPG gene are associated with increased carotid intimal thickness33. Another potential candidate gene is hyaluronan synthase, Has2. Hyaluronic acid is a component of matrix of atherosclerotic lesions and over-expression of human Has2 increases atherosclerotic burden in Apoe-/- mice42.
We identified one near-significant locus contributing to the presence of buried fibrous caps. This particular phenotype has been used as a marker of previous plaque rupture 34, but its use remains controversial35. Regardless, identifying QTL for this morphological characteristic further suggests that plaque stability and perhaps susceptibility to rupture is under genetic control. One interesting gene under the clinical QTL whose expression is also under genetic regulation, is the smooth muscle development gene Meox1 with a cis-eQTL LOD score of 65.336.
In summary, we have demonstrated that both innominate artery lesion size and cellular composition are genetically regulated. The locus for IA lesion size was not detected in the aortic sinus, indicating a difference in the genetics of atherosclerosis in the innominate artery. We also mapped several lesion phenotypes associated with advanced atherosclerosis and found one significant locus for fibrous cap thickness and several suggestive QTL for other lesion phenotypes. Global gene expression analysis helped identify several strong candidate genes for these QTL. In particular, hepatic CD44 expression was genetically regulated and correlated with IA lesion size. Further, studies to clarify the basis of the site-specific nature of atherosclerosis in mouse models, and the relevance to human disease, are warranted. The fact that clear clinical phenotypes regulating lesion composition segregate in mouse crosses raises the possibility of their genetic dissection.
Acknowledgments
The authors acknowledge Drs. Eric E. Schadt and Pek Lum and their colleagues at Rossetta/Merck for help in expression array and statistical analyses and UCLA Brain Research institute Microscopy core for assistance with immunochemistry.
Sources of funding: This work was supported by NIH grant HL30568. Brian Bennett was supported in part by NIH Training Grant T32-DK07789.
References
- 1.Welch CL, Bretschger S, Latib N, Bezouevski M, Guo Y, Pleskac N, Liang CP, Barlow C, Dansky H, Breslow JL, Tall AR. Localization of atherosclerosis susceptibility loci to chromosomes 4 and 6 using the Ldlr knockout mouse model. Proc Natl Acad Sci U S A. 2001;98:7946–7951. doi: 10.1073/pnas.141239098. [DOI] [PMC free article] [PubMed] [Google Scholar]
- 2.Colinayo VV, Qiao JH, Wang X, Krass KL, Schadt E, Lusis AJ, Drake TA. Genetic loci for diet-induced atherosclerotic lesions and plasma lipids in mice. Mamm Genome. 2003;14:464–471. doi: 10.1007/s00335-002-2187-2. [DOI] [PubMed] [Google Scholar]
- 3.Smith JD, James D, Dansky HM, Wittkowski KM, Moore KJ, Breslow JL. In silico quantitative trait locus map for atherosclerosis susceptibility in apolipoprotein E-deficient mice. Arterioscler Thromb Vasc Biol. 2003;23:117–122. doi: 10.1161/01.atv.0000047461.18902.80. [DOI] [PubMed] [Google Scholar]
- 4.Seidelmann SB, De Luca C, Leibel RL, Breslow JL, Tall AR, Welch CL. Quantitative trait locus mapping of genetic modifiers of metabolic syndrome and atherosclerosis in low-density lipoprotein receptor-deficient mice: identification of a locus for metabolic syndrome and increased atherosclerosis on chromosome 4. Arterioscler Thromb Vasc Biol. 2005;25:204–210. doi: 10.1161/01.ATV.0000149146.32385.1b. [DOI] [PMC free article] [PubMed] [Google Scholar]
- 5.Wang X, Ria M, Kelmenson PM, Eriksson P, Higgins DC, Samnegard A, Petros C, Rollins J, Bennet AM, Wiman B, de Faire U, Wennberg C, Olsson PG, Ishii N, Sugamura K, Hamsten A, Forsman-Semb K, Lagercrantz J, Paigen B. Positional identification of TNFSF4, encoding OX40 ligand, as a gene that influences atherosclerosis susceptibility. Nat Genet. 2005;37:365–372. doi: 10.1038/ng1524. [DOI] [PubMed] [Google Scholar]
- 6.Smith JD, Bhasin JM, Baglione J, Settle M, Xu Y, Barnard J. Atherosclerosis susceptibility loci identified from a strain intercross of apolipoprotein E-deficient mice via a high-density genome scan. Arterioscler Thromb Vasc Biol. 2006;26:597–603. doi: 10.1161/01.ATV.0000201044.33220.5c. [DOI] [PubMed] [Google Scholar]
- 7.Paigen B, Mitchell D, Reue K, Morrow A, Lusis AJ, LeBoeuf RC. Ath-1, a gene determining atherosclerosis susceptibility and high density lipoprotein levels in mice. Proc Natl Acad Sci U S A. 1987;84:3763–3767. doi: 10.1073/pnas.84.11.3763. [DOI] [PMC free article] [PubMed] [Google Scholar]
- 8.Paigen B, Nesbitt MN, Mitchell D, Albee D, LeBoeuf RC. Ath-2, a second gene determining atherosclerosis susceptibility and high density lipoprotein levels in mice. Genetics. 1989;122:163–168. doi: 10.1093/genetics/122.1.163. [DOI] [PMC free article] [PubMed] [Google Scholar]
- 9.Qiao JH, Fishbein MC, Demer LL, Lusis AJ. Genetic determination of cartilaginous metaplasia in mouse aorta. Arterioscler Thromb Vasc Biol. 1995;15:2265–2272. doi: 10.1161/01.atv.15.12.2265. [DOI] [PubMed] [Google Scholar]
- 10.Qiao JH, Xie PZ, Fishbein MC, Kreuzer J, Drake TA, Demer LL, Lusis AJ. Pathology of atheromatous lesions in inbred and genetically engineered mice. Genetic determination of arterial calcification. Arterioscler Thromb. 1994;14:1480–1497. doi: 10.1161/01.atv.14.9.1480. [DOI] [PubMed] [Google Scholar]
- 11.Wang SS, Schadt EE, Wang H, Wang X, Ingram-Drake L, Shi W, Drake TA, Lusis AJ. Identification of pathways for atherosclerosis in mice: integration of quantitative trait locus analysis and global gene expression data. Circ Res. 2007;101:e11–30. doi: 10.1161/CIRCRESAHA.107.152975. [DOI] [PubMed] [Google Scholar]
- 12.Wang SS, Shi W, Wang X, Velky L, Greenlee S, Wang MT, Drake TA, Lusis AJ. Mapping, Genetic Isolation, and Characterization of Genetic Loci That Determine Resistance to Atherosclerosis in C3H Mice. Arterioscler Thromb Vasc Biol. 2007 doi: 10.1161/ATVBAHA.107.148106. [DOI] [PubMed] [Google Scholar]
- 13.Rosenfeld ME, Polinsky P, Virmani R, Kauser K, Rubanyi G, Schwartz SM. Advanced atherosclerotic lesions in the innominate artery of the ApoE knockout mouse. Arterioscler Thromb Vasc Biol. 2000;20:2587–2592. doi: 10.1161/01.atv.20.12.2587. [DOI] [PubMed] [Google Scholar]
- 14.Mehrabian M, Qiao JH, Hyman R, Ruddle D, Laughton C, Lusis AJ. Influence of the apoA-II gene locus on HDL levels and fatty streak development in mice. Arterioscler Thromb. 1993;13:1–10. doi: 10.1161/01.atv.13.1.1. [DOI] [PubMed] [Google Scholar]
- 15.Movat HZ. Demonstration of all connective tissue elements in a single section; pentachrome stains. AMA Arch Pathol. 1955;60:289–295. [PubMed] [Google Scholar]
- 16.Broman KW, Wu H, Sen S, Churchill GA. R/qtl: QTL mapping in experimental crosses. Bioinformatics. 2003;19:889–890. doi: 10.1093/bioinformatics/btg112. [DOI] [PubMed] [Google Scholar]
- 17.Boyartchuk VL, Broman KW, Mosher RE, D’Orazio SE, Starnbach MN, Dietrich WF. Multigenic control of Listeria monocytogenes susceptibility in mice. Nat Genet. 2001;27:259–260. doi: 10.1038/85812. [DOI] [PubMed] [Google Scholar]
- 18.Lander E, Kruglyak L. Genetic dissection of complex traits: guidelines for interpreting and reporting linkage results. Nat Genet. 1995;11:241–247. doi: 10.1038/ng1195-241. [DOI] [PubMed] [Google Scholar]
- 19.Doerge RW, Churchill GA. Permutation tests for multiple loci affecting a quantitative character. Genetics. 1996;142:285–294. doi: 10.1093/genetics/142.1.285. [DOI] [PMC free article] [PubMed] [Google Scholar]
- 20.Lavezzi AM, Milei J, Grana DR, Flenda F, Basellini A, Matturri L. Expression of c-fos, p53 and PCNA in the unstable atherosclerotic carotid plaque. Int J Cardiol. 2003;92:59–63. doi: 10.1016/s0167-5273(03)00055-x. [DOI] [PubMed] [Google Scholar]
- 21.Pure E, Cuff CA. A crucial role for CD44 in inflammation. Trends Mol Med. 2001;7:213–221. doi: 10.1016/s1471-4914(01)01963-3. [DOI] [PubMed] [Google Scholar]
- 22.Kolodgie FD, Burke AP, Farb A, Weber DK, Kutys R, Wight TN, Virmani R. Differential accumulation of proteoglycans and hyaluronan in culprit lesions: insights into plaque erosion. Arterioscler Thromb Vasc Biol. 2002;22:1642–1648. doi: 10.1161/01.atv.0000034021.92658.4c. [DOI] [PubMed] [Google Scholar]
- 23.Cuff CA, Kothapalli D, Azonobi I, Chun S, Zhang Y, Belkin R, Yeh C, Secreto A, Assoian RK, Rader DJ, Pure E. The adhesion receptor CD44 promotes atherosclerosis by mediating inflammatory cell recruitment and vascular cell activation. J Clin Invest. 2001;108:1031–1040. doi: 10.1172/JCI12455. [DOI] [PMC free article] [PubMed] [Google Scholar]
- 24.Maeda N, Johnson L, Kim S, Hagaman J, Friedman M, Reddick R. Anatomical differences and atherosclerosis in apolipoprotein E-deficient mice with 129/SvEv and C57BL/6 genetic backgrounds. Atherosclerosis. 2007;195:75–82. doi: 10.1016/j.atherosclerosis.2006.12.006. [DOI] [PMC free article] [PubMed] [Google Scholar]
- 25.Reardon CA, Blachowicz L, White T, Cabana V, Wang Y, Lukens J, Bluestone J, Getz GS. Effect of immune deficiency on lipoproteins and atherosclerosis in male apolipoprotein E-deficient mice. Arterioscler Thromb Vasc Biol. 2001;21:1011–1016. doi: 10.1161/01.atv.21.6.1011. [DOI] [PubMed] [Google Scholar]
- 26.Reardon CA, Blachowicz L, Lukens J, Nissenbaum M, Getz GS. Genetic background selectively influences innominate artery atherosclerosis: immune system deficiency as a probe. Arterioscler Thromb Vasc Biol. 2003;23:1449–1454. doi: 10.1161/01.ATV.0000079793.58054.2E. [DOI] [PubMed] [Google Scholar]
- 27.McNamara JJ, Molot MA, Stremple JF, Cutting RT. Coronary artery disease in combat casualties in Vietnam. Jama. 1971;216:1185–1187. [PubMed] [Google Scholar]
- 28.Li Q, Li Y, Zhang Z, Gilbert TR, Matsumoto AH, Dobrin SE, Shi W. Quantitative trait locus analysis of carotid atherosclerosis in an intercross between C57BL/6 and C3H apolipoprotein E-deficient mice. Stroke. 2008;39:166–173. doi: 10.1161/STROKEAHA.107.492165. [DOI] [PMC free article] [PubMed] [Google Scholar]
- 29.Meng H, Vera I, Che N, Wang X, Wang SS, Ingram-Drake L, Schadt EE, Drake TA, Lusis AJ. Identification of Abcc6 as the major causal gene for dystrophic cardiac calcification in mice through integrative genomics. Proc Natl Acad Sci U S A. 2007;104:4530–4535. doi: 10.1073/pnas.0607620104. [DOI] [PMC free article] [PubMed] [Google Scholar]
- 30.Virmani R, Kolodgie FD, Burke AP, Farb A, Schwartz SM. Lessons from sudden coronary death: a comprehensive morphological classification scheme for atherosclerotic lesions. Arterioscler Thromb Vasc Biol. 2000;20:1262–1275. doi: 10.1161/01.atv.20.5.1262. [DOI] [PubMed] [Google Scholar]
- 31.Jono S, Ikari Y, Shioi A, Mori K, Miki T, Hara K, Nishizawa Y. Serum osteoprotegerin levels are associated with the presence and severity of coronary artery disease. Circulation. 2002;106:1192–1194. doi: 10.1161/01.cir.0000031524.49139.29. [DOI] [PubMed] [Google Scholar]
- 32.Ueland T, Yndestad A, Oie E, Florholmen G, Halvorsen B, Froland SS, Simonsen S, Christensen G, Gullestad L, Aukrust P. Dysregulated Osteoprotegerin/RANK Ligand/RANK Axis in Clinical and Experimental Heart Failure. Circulation. 2005 doi: 10.1161/01.CIR.0000165119.62099.14. [DOI] [PubMed] [Google Scholar]
- 33.Brandstrom H, Stiger F, Lind L, Kahan T, Melhus H, Kindmark A. A single nucleotide polymorphism in the promoter region of the human gene for osteoprotegerin is related to vascular morphology and function. Biochem Biophys Res Commun. 2002;293:13–17. doi: 10.1016/S0006-291X(02)00137-7. [DOI] [PubMed] [Google Scholar]
- 34.Jackson CL, Bennett MR, Biessen EA, Johnson JL, Krams R. Assessment of Unstable Atherosclerosis in Mice. Arterioscler Thromb Vasc Biol. 2007 doi: 10.1161/01.ATV.0000261873.86623.e1. [DOI] [PubMed] [Google Scholar]
- 35.Schwartz SM, Galis ZS, Rosenfeld ME, Falk E. Plaque Rupture in Humans and Mice. Arterioscler Thromb Vasc Biol. 2007 doi: 10.1161/01.ATV.0000261709.34878.20. [DOI] [PubMed] [Google Scholar]
- 36.Wasteson P, Johansson BR, Jukkola T, Breuer S, Akyurek LM, Partanen J, Lindahl P. Developmental origin of smooth muscle cells in the descending aorta in mice. Development. 2008;135:1823–1832. doi: 10.1242/dev.020958. [DOI] [PubMed] [Google Scholar]


