Abstract
Pollen tube growth is crucial for the delivery of sperm cells to the ovule during flowering plant reproduction. Previous in vitro imaging of Lilium longiflorum and Nicotiana tabacum has shown that growing pollen tubes exhibit a tip-focused Ca2+ concentration ([Ca2+]) gradient and regular oscillations of the cytosolic [Ca2+] ([Ca2+]cyt) in the tip region. Whether this [Ca2+] gradient and/or [Ca2+]cyt oscillations are present as the tube grows through the stigma (in vivo condition), however, is still not clear. We monitored [Ca2+]cyt dynamics in pollen tubes under various conditions using Arabidopsis (Arabidopsis thaliana) and N. tabacum expressing yellow cameleon 3.60, a fluorescent calcium indicator with a large dynamic range. The tip-focused [Ca2+]cyt gradient was always observed in growing pollen tubes. Regular oscillations of the [Ca2+]cyt, however, were rarely identified in Arabidopsis or N. tabacum pollen tubes grown under the in vivo condition or in those placed in germination medium just after they had grown through a style (semi-in vivo condition). On the other hand, regular oscillations were observed in vitro in both growing and nongrowing pollen tubes, although the oscillation amplitude was 5-fold greater in the nongrowing pollen tubes compared with growing pollen tubes. These results suggested that a submicromolar [Ca2+]cyt in the tip region is essential for pollen tube growth, whereas a regular [Ca2+] oscillation is not. Next, we monitored [Ca2+] dynamics in the endoplasmic reticulum ([Ca2+]ER) in relation to Arabidopsis pollen tube growth using yellow cameleon 4.60, which has a lower affinity for Ca2+ compared with yellow cameleon 3.60. The [Ca2+]ER in pollen tubes grown under the semi-in vivo condition was between 100 and 500 μm. In addition, cyclopiazonic acid, an inhibitor of ER-type Ca2+-ATPases, inhibited growth and decreased the [Ca2+]ER. Our observations suggest that the ER serves as one of the Ca2+ stores in the pollen tube and cyclopiazonic acid-sensitive Ca2+-ATPases in the ER are required for pollen tube growth.
In many flowering plants, a pollen grain that lands on the top surface of a stigma will hydrate and germinate a pollen tube. Following germination, the pollen tube enters the style and grows through the wall of transmitting tract cells on the way to the ovary, where the tube emerges to release the sperm for double fertilization. Therefore, pollen tube growth is essential for reproduction in flowering plants.
Since Brewbaker and Kwack (1963) revealed that Ca2+ is essential for in vitro pollen tube cultures, the relationship between the Ca2+ concentration ([Ca2+]) and pollen tube growth has been further examined under in vitro germination culture conditions. Ratiometric ion imaging using fluorescent dye has revealed that the apical domain of a pollen tube grown in vitro contains a tip-focused [Ca2+] gradient (Pierson et al., 1994, 1996; Cheung and Wu, 2008) and that the cytoplasmic [Ca2+] ([Ca2+]cyt) in the tip region and the growth rate oscillate with the same periodicity (Pierson et al., 1996; Holdaway-Clarke et al., 1997; Messerli and Robinson, 1997). Therefore, oscillation of the [Ca2+]cyt has been thought to correlate with pollen tube growth. It is not clear, however, whether regular [Ca2+]cyt oscillations in the tip region occur in pollen tubes growing through stigmas and styles.
The [Ca2+]cyt is controlled temporally and spatially by transporters in the membranes of intracellular compartments and in the plasma membrane (Sze et al., 2000). Studies using a Ca2+-sensitive vibrating electrode revealed Ca2+ influx in the tip region of the pollen tube (Pierson et al., 1994; Holdaway-Clarke et al., 1997; Franklin-Tong et al., 2002). Stretch-activated Ca2+ channels have been found in the plasma membrane using patch-clamp electrophysiology (Kuhtreiber and Jaffe, 1990; Dutta and Robinson, 2004). Recently, CNGC18 was identified as a Ca2+-permeable channel in the plasma membrane that is essential for pollen tube growth (Frietsch et al., 2007). The intracellular compartments that store Ca2+ in the pollen tube and the relevant Ca2+ transporters, however, have yet to be identified.
Yellow cameleons are genetically encoded Ca2+ indicators that were developed to monitor the [Ca2+] in living cells (Miyawaki et al., 1997). These indicators are chimeric proteins consisting of enhanced cyan fluorescent protein (ECFP), calmodulin (CaM), a glycylglycine linker, the CaM-binding domain of myosin light chain kinase (M13), and enhanced yellow fluorescent protein (EYFP). When the CaM domain binds Ca2+, the domain associates with the M13 peptide and induces fluorescence resonance energy transfer (FRET) between ECFP and EYFP. Several types of cameleons have been developed by tuning the CaM domain binding affinity for Ca2+. Yellow cameleon 2.1 (YC2.1) is a high-affinity indicator that has been used to monitor the [Ca2+]cyt in Arabidopsis (Arabidopsis thaliana) guard cells (Allen et al., 1999, 2000, 2001), Lilium longiflorum and Nicotiana tabacum pollen tubes (Watahiki et al., 2004), and the root hair of Medicago truncatula (Miwa et al., 2006). YC3.1 is a low-affinity indicator that has been used to monitor the [Ca2+]cyt during pollen germination and in papilla cells of Arabidopsis (Iwano et al., 2004).
Recently, YC3.60 was developed as a new YC variant (Nagai et al., 2004), in which the acceptor fluorophore is a circularly permuted version of Venus rather than EYFP (Nagai et al., 2002). YC3.60 has a monophasic Ca2+ dependency with a dissociation constant (Kd) of 0.25 μm. Compared with YC3.1, YC3.60 is equally bright with a 5- to 6-fold larger dynamic range. Thus, YC3.60 results in a markedly enhanced signal-to-noise ratio, thereby enabling Ca2+ imaging experiments that were not possible with conventional YCs. On the other hand, YC4.60 was developed by mutating the Ca2+-binding loop of CaM in YC3.60. Because YC4.60 has a significantly lower Ca2+ affinity with a biphasic Ca2+ dependency (Kd: 58 nm and 14.4 μm), it allows changes in [Ca2+] dynamics to be detected against a high background [Ca2+] (Nagai et al., 2004).
To examine whether the [Ca2+]cyt oscillates in pollen tubes growing through a stigma after pollination (in vivo condition), in those placed in germination medium immediately after passing through a style (semi-in vivo condition), or in those grown in germination medium (in vitro condition), we generated transgenic Arabidopsis and N. tabacum lines expressing the YC3.60 gene in their pollen grains and monitored Ca2+ dynamics in the pollen tube tip. We also examined how inhibitors of pollen tube growth affect Ca2+ dynamics in pollen tubes growing under the semi-in vivo condition. To examine Ca2+ dynamics in the endoplasmic reticulum (ER), we generated transgenic Arabidopsis plants expressing YC4.60 in the pollen tube ER. The results are discussed in relation to the physiological relevance of [Ca2+] oscillations for pollen tube growth.
RESULTS
Expression of YC3.60 in Pollen Grains
Pollen grains harvested from Arabidopsis and N. tabacum plants transformed with YC3.60 were transferred onto solid germination medium. Pollen tubes growing on the germination medium were observed using a fluorescence microscope (blue excitation), which allowed us to select plants with the brightest fluorescence signals. To confirm that the pollen tubes expressed the ECFP and Venus components of YC3.60, we obtained fluorescence spectra from the growing pollen tubes using a spectral-imaging microscope system with excitation at 458 nm. The YC3.60 spectrum was a combination of the spectra typically observed for recombinant ECFP and Venus proteins. Photobleaching a 5- × 10-μm area of the pollen tube tip with a 514-nm light induced an approximately 90% increase in ECFP fluorescence, which was higher than the 15% observed for YC3.1 (data not shown). These results demonstrated that full-length YC3.60 was expressed in the transgenic pollen tubes and that the FRET efficiency within YC3.60 was higher than that within YC3.1.
Ca2+ Imaging in Arabidopsis Pollen Tubes Grown in Vitro
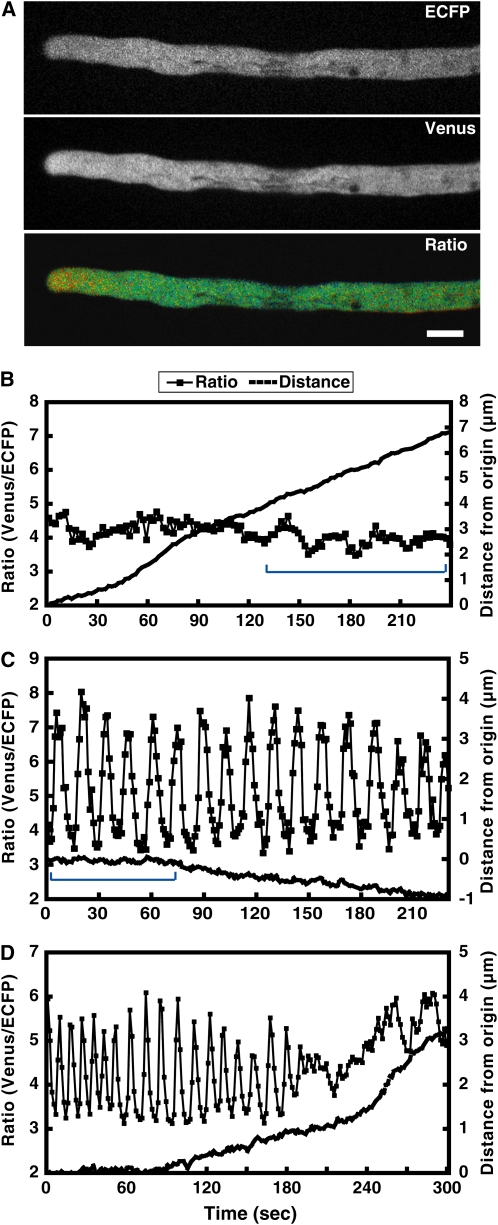
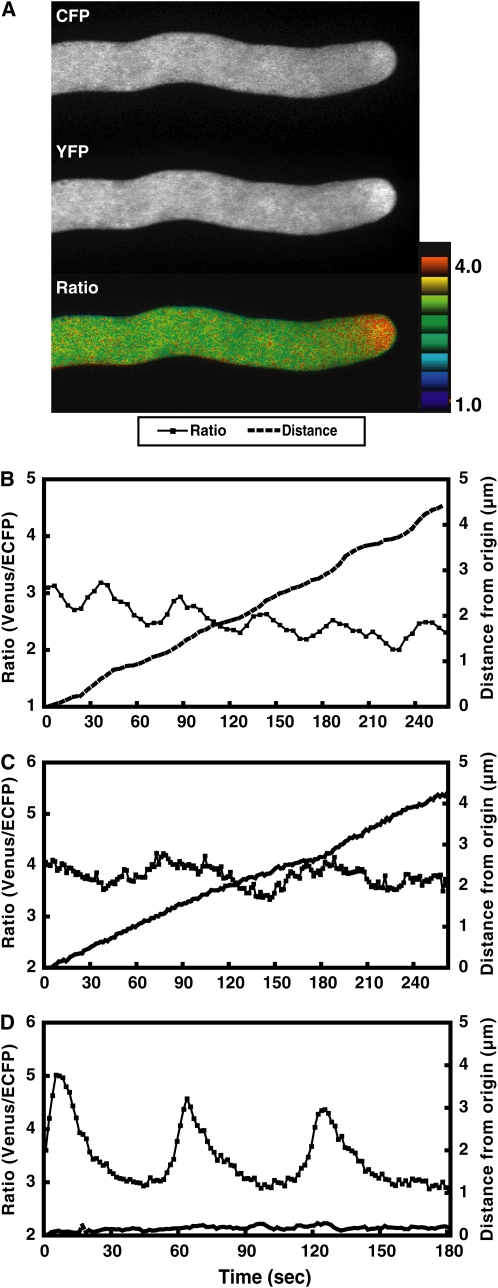
First, we examined Arabidopsis pollen tubes grown in vitro for regular [Ca2+]cyt oscillations, as has been observed in L. longiflorum and N. tabacum. Pollen grains from freshly dehisced anthers of YC3.60-expressing plants were mounted on germination medium. After 5 h, approximately 20% of the pollen grains germinated with elongated pollen tubes. We continued to monitor pollen tubes that were at least 200 μm in length. The signals from ECFP and Venus (FRET image) at the tip of the pollen tubes were obtained at 50-ms to 5.0-s intervals with excitation at 440 nm; Venus/ECFP ratios were calculated from these images (Fig. 1A). ECFP and Venus fluorescence intensities in a tip region with a diameter of 6 μm were measured, and the Venus/ECFP ratio was calculated. [Ca2+]cyt gradients were evident in pollen tubes that grew normally (growth rate: 2.0 ± 1.8 μm/min; Fig. 1A). Although some oscillations were observed (Fig. 1B), consistently regular [Ca2+]cyt oscillations were not detected. The mean value of the maximum ratio was 4.5 ± 0.2, whereas the mean value of the minimum ratio was 3.9 ± 0.3 (Fig. 1B; Table I; Supplemental Video S1). The mean amplitude range was 0.3 ± 0.2, and the periodicity of the [Ca2+]cyt oscillations was irregular, ranging from 4 to 30 s (Fig. 1B). These irregular [Ca2+]cyt oscillations were observed in 45 of 55 pollen tubes observed under the in vitro condition. Four pollen tube tips burst during monitoring.
Figure 1.
Irregular and regular [Ca2+]cyt oscillations observed in elongated Arabidopsis pollen tubes 5 h after dissemination under the in vitro condition. A, ECFP, Venus, and ratio (Venus/ECFP) images of an elongated pollen tube 5 h after dissemination. A tip-focused [Ca2+]cyt gradient was observed. The ratio (Venus/ECFP) in a tip area with a diameter of 6 μm was measured. Bar = 10 μm. B, The ratio change in the tip region and the elongation of a normally growing pollen tube. Primarily irregular oscillations were observed, although relatively regular oscillations also were identified in the range marked with a blue line. C, The ratio change in the tip region of a relatively slowly growing pollen tube (blue line) and the distance moved during monitoring. Regular [Ca2+]cyt oscillations with a large amplitude were observed. D, Regular oscillations followed by irregular oscillations. Regular oscillations were detected in a stopped or slowly growing pollen tube, whereas irregular oscillations were observed in a growing pollen tube.
Table I.
[Ca2+] oscillation and growth rate of the pollen tube in Arabidopsis and N. tabacum
| Condition | Growth Rate | Max/Min Ratio | Amplitude Range | [Ca2+]cyt | Exp. No. |
|---|---|---|---|---|---|
| μm/min | μm | ||||
| Arabidopsis | |||||
| In vitro | 2.0 ± 1.8 | 4.5 ± 0.2/3.9 ± 0.3 | 0.3 ± 0.2 | 0.3–0.4 | 45 |
| In vitro | <1.0 | 7.2 ± 0.5/3.5 ± 0.2 | 1.8 ± 0.3 | 0.3–1.0 | 5 |
| In vivo | 3.6 ± 0.5 | 4.0 ± 0.4/3.4 ± 0.3 | 0.4 ± 0.3 | 0.3–0.4 | 10 |
| Semi-in vivo | 3.1 ± 0.8 | 5.1 ± 0.5/4.5 ± 0.5 | 0.3 ± 0.2 | 0.4–0.5 | 48 |
| N. tabacum | |||||
| In vitro | 2.8 ± 1.6 | 3.9 ± 0.2/3.5 ± 0.2 | 0.2 ± 0.1 | 0.3–0.4 | 17 |
| In vitro | <1.0 | 4.8 ± 0.4/2.8 ± 0.2 | 1.0 ± 0.1 | 0.1–0.5 | 5 |
| In vivo | 0.2 ± 0.1 | 3.5 ± 0.2/3.3 ± 0.1 | 0.1 ± 0.1 | 0.3 | 15 |
| Semi-in vivo | 1.2 ± 0.2 | 3.9 ± 0.4/3.4 ± 0.4 | 0.3 ± 0.2 | 0.3–0.4 | 30 |
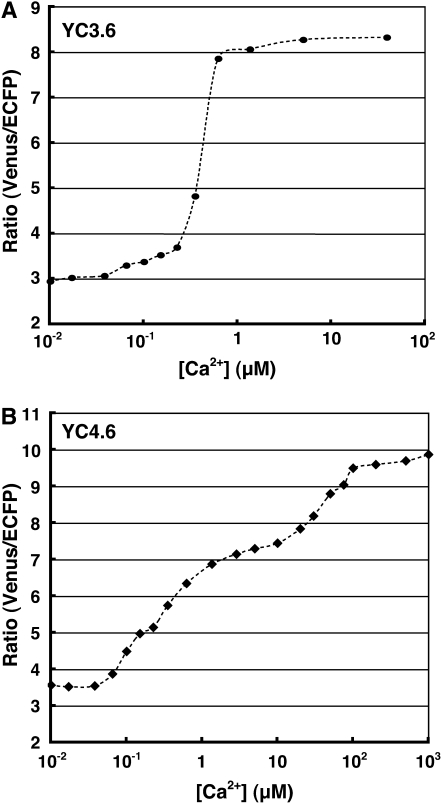
To convert the YC3.60 ratios into approximate [Ca2+]cyt values, calibration of the [Ca2+]cyt was carried out as described previously (Allen et al., 1999). Serial dilutions of purified YC3.60 protein were made in Ca2+ calibration buffer (Molecular Probes), in which the free [Ca2+] ranged from 0 μm to 1 mm. YC3.60 dilutions that resulted in signal intensities similar to those observed in YC3.60-expressing pollen tubes were used to determine minimum ratio (Rmin) and maximum ratio (Rmax). The obtained Rmin and Rmax values for YC3.60 were 2.95 and 8.33, respectively. These values were used to convert the YC3.60 fluorescence ratios into [Ca2+]cyt by fitting them to YC3.60 titration curves obtained in vitro (Fig. 2A). In this way, we estimated that the [Ca2+]cyt in the tip region shown in Figure 1B ranged from 0.3 to 0.4 μm.
Figure 2.
Titration curves for YC3.60 and YC4.60.
On the other hand, regular [Ca2+]cyt oscillations were also observed (Fig. 1C; Supplemental Video S2). These regular [Ca2+]cyt oscillations were observed in five of 55 pollen tubes observed under the in vitro condition. In these cases, however, the pollen tube was not growing (Fig. 1C, blue line). The mean value of the maximum ratio was 7.2 ± 0.5, whereas the mean value of the minimum ratio was 3.5 ± 0.2 (Fig. 1C; Table I). The mean amplitude range was 1.8 ± 0.3, which was significantly different from that of the irregular [Ca2+]cyt oscillations shown in Figure 1B. The [Ca2+]cyt in the tip region was estimated to be between 0.1 and approximately 1 μm. The mean periodicity of the [Ca2+]cyt oscillations was 13.8 ± 1.7 s. In addition, regular [Ca2+]cyt oscillations followed by irregular oscillations were also observed in one sample (Fig. 1D; Supplemental Video S3). In this case, the length of the pollen tube was between 200 and 500 μm, and the regular [Ca2+]cyt oscillations were observed only when the pollen tube stopped growing or grew slowly, whereas the irregular oscillations were observed in the normally growing pollen tube. These data suggested that regular [Ca2+]cyt oscillations in the tip were not essential for Arabidopsis pollen tube growth in vitro.
Ca2+ Imaging in Arabidopsis Pollen Tubes Growing through Stigmas
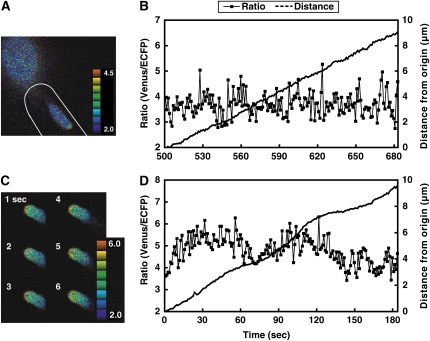
To examine whether regular [Ca2+]cyt oscillations occurred in vivo, we monitored the tips of pollen tubes growing through a stigma. Wild-type papilla cells were pollinated with YC3.60-expressing pollen grains. The pollen grains germinated within 20 min, and each pollen tube penetrated and elongated in a papilla cell wall within 30 min. The mean in vivo growth rate of the pollen tubes in the papilla cells was 3.6 ± 0.5 μm/min. Irregular [Ca2+]cyt oscillations were observed in the tip regions of pollen tubes growing through the papilla cell walls 5 min after penetration (Fig. 3, A and B; Supplemental Video S4). The mean value of the maximum ratio was 4.0 ± 0.4, and the mean value of the minimum ratio was 3.4 ± 0.3 (Fig. 3B; Table I). The amplitude range of the ratio was 0.4 ± 0.3, which was significantly different (P < 0.01) from that of the regular [Ca2+]cyt oscillations observed in vitro (Fig. 1C). In addition, compared with the [Ca2+]cyt oscillations shown in Figure 1C, the periodicity of the [Ca2+]cyt oscillations was more irregular. The data obtained in this experiment were not affected by the monitoring interval (data not shown). Irregular [Ca2+]cyt oscillations were observed in all experiments under the in vivo condition (10/10 samples). In summary, regular [Ca2+]cyt oscillations were not observed in pollen tubes as they grew through the papilla cell wall.
Figure 3.
Irregular oscillations observed in Arabidopsis pollen tubes growing through a papilla cell wall (in vivo condition) and in pollen tubes growing through a style and then on germination medium (semi-in vivo condition). A, A ratio image of a pollen tube growing though a papilla cell obtained approximately 7.5 min after penetration. A tip-focused [Ca2+] gradient was observed. The papilla cell is marked with a white line. B, The ratio change in the tip of the pollen tube shown in A and the elongation of a pollen tube 5 min after penetration. The amplitude and period of the oscillations were irregular. C, Ratio images of a pollen tube that has just passed through the style. D, The ratio change in the tip of the pollen tube shown in C and elongation during monitoring. The amplitude and periodicity of the oscillations were irregular.
Ca2+ Imaging in Arabidopsis Pollen Tubes Growing under Semi-in Vivo Conditions
Arabidopsis pollen tubes were examined under the semi-in vivo condition after they grew through the pistil; this method facilitated the monitoring process because we were able to monitor a number of elongating pollen tubes simultaneously and the growth conditions better represented the in vivo condition (Iwano et al., 2004). We monitored the [Ca2+]cyt in pollen tubes growing in the semi-in vivo condition at 50-ms to 2-s intervals. The mean growth rate was 3.1 ± 0.8 μm/min, and irregular [Ca2+]cyt oscillations were in the pollen tube tips (Fig. 3, C and D; Supplemental Video S5). The mean values of the maximum and minimum ratios were 5.1 ± 0.5 and 4.5 ± 0.5, respectively, with an amplitude range of 0.3 ± 0.2 (Fig. 3D; Table I). Similar irregular [Ca2+]cyt oscillations were observed in all experiments under the semi-in vivo condition (48/48 samples).
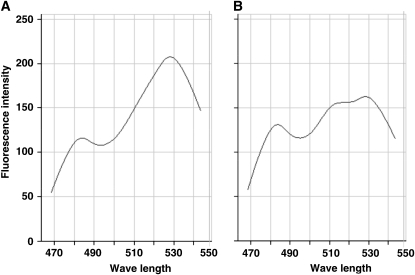
In order to confirm that the cameleon can technically detect [Ca2+]cyt oscillations in semi-in vivo conditions, we obtained fluorescence spectra from the pollen tubes growing in the semi-in vivo condition in the presence of ionophore or in the presence of ionophore and EGTA using a spectral-imaging microscope system with excitation at 458 nm. Compared with that in the presence of ionophore alone (Fig. 4A), fluorescence of Venus component of YC3.60 was decreased in the presence of ionophore and EGTA, which is almost free from Ca2+ (Fig. 4B) Therefore, these results showed that Ca2+-dependent energy transfer from ECFP to Venus occurs also in the semi-in vivo condition.
Figure 4.
The YC3.60 spectrum in the presence of ionophore (A) or in the presence of ionophore and EGTA (B).
Effects of Pollen Tube Growth Inhibitors on Ca2+ Dynamics in Arabidopsis Pollen Tubes
We only observed regular [Ca2+]cyt oscillations when the pollen tubes had stopped growing or when they grew slowly. We therefore speculated that regular [Ca2+]cyt oscillations were directly related to arrest of pollen tube growth. It was previously shown that the growth rate and changes in the [Ca2+]cyt were affected by Ca2+ channel blockers and chelators, such as Gd3+ and EGTA (Malhó et al., 1994; Geitmann and Cresti, 1998; Franklin-Tong et al., 2002). In addition, cyclopiazonic acid (CPA), a specific inhibitor of animal SERCA-type Ca2+-ATPases (Inesi and Sagara, 1994) and plant P-type IIA Ca2+-ATPases (Geisler et al., 2000), affects the growth rate and [Ca2+]cyt dynamics of pollen tubes.
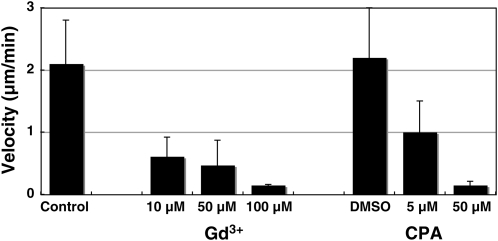
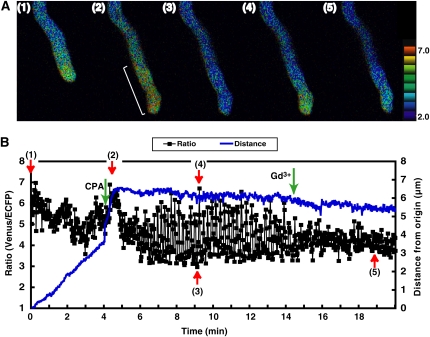
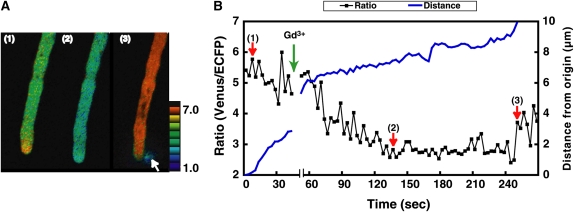
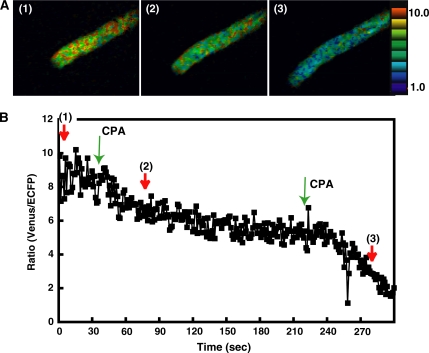
First, we examined the effects of these inhibitors on pollen germination and the growth rate. Gd3+, EGTA, and CPA arrested pollen tube growth in the semi-in vivo condition (Fig. 5). Next, we examined the effects of these inhibitors on [Ca2+]cyt oscillations in pollen tubes growing in the semi-in vivo condition. The maximum [Ca2+]cyt did not change, whereas the area with a high [Ca2+]cyt increased in size just after the addition of CPA to the culture medium (final concentration: approximately 5 μm; Fig. 6). Regular [Ca2+]cyt oscillations then were induced. These regular [Ca2+]cyt oscillations were induced in five of 10 pollen tubes treated with CPA. Two pollen tubes did not induce, and the other three burst during monitoring. After the addition of Gd3+ to these samples, the amplitude of the oscillations decreased and irregular oscillations were observed (Supplemental Video S6). On the other hand, application of Gd3+ alone arrested pollen tube growth but did not induce [Ca2+]cyt oscillation at the tip (Fig. 7; Supplemental Video S7) yet caused a decrease of [Ca2+]cyt at the tip, namely, the disappearance of a tip-focused [Ca2+]cyt gradient (2 in Fig. 7A). Finally, many of the pollen tips burst, and the elevation of [Ca2+]cyt over the whole area of pollen tube was caused by the influx of extracellular Ca2+ (3 in Fig. 7A). These results were repeatedly observed in 10 of 15 pollen tubes treated with Gd3+. The other five burst before monitoring. These results showed that inhibitors of pollen tube growth induced abnormal [Ca2+]cyt dynamics, including regular [Ca2+]cyt oscillations and a disappearance of the tip-focused [Ca2+]cyt gradient. Furthermore, these results suggested that the action site of Gd3+ is different from that of CPA and is related to the formation of the tip-focused [Ca2+]cyt gradient.
Figure 5.
The effects of inhibitors on Arabidopsis pollen tube elongation. DMSO, Dimethyl sulfoxide.
Figure 6.
The effects of inhibitors on the changes in the [Ca2+]cyt in the tip region of Arabidopsis pollen tubes growing in the semi-in vivo condition. A, Ratio images of a pollen tube. The numbers in each figure correspond to each point in the graph shown in B. After the addition of CPA, the [Ca2+]cyt increased in a large area containing the tip region (white line). B, The ratio change in the tip region, an area from the pollen tube shown in A with a diameter of 6 μm. Blue line indicates distance from origin. Before the addition of CPA, irregular fluctuations were observed. Two minutes after the addition of CPA (shown with a green arrow), regular oscillations were induced. These oscillations were inhibited by the addition of Gd3+ (shown with a green arrow). Red arrows (1) to (5) correlate to the ratio images in Figure 6A.
Figure 7.
The effects of Gd3+ on the changes in the [Ca2+]cyt in the tip region of Arabidopsis pollen tubes growing in the semi-in vivo condition. A, Ratio images of a pollen tube before and after the addition of Gd3+. Numbers in each figure correspond to each point in the graph shown in B. After the addition of Gd3+, the tip-focused [Ca2+]cyt gradient disappeared and the tip region burst (white arrow in 3). B, The ratio change in the tip region before and after the addition of Gd3+ (a green arrow) and the elongation of the pollen tube. Red arrows (1) to (3) correlate to the ratio images in Figure 7A. Blue line indicates distance from origin.
Ca2+ Dynamics in the ER of Arabidopsis Pollen Tubes Growing in the Semi-in Vivo Condition
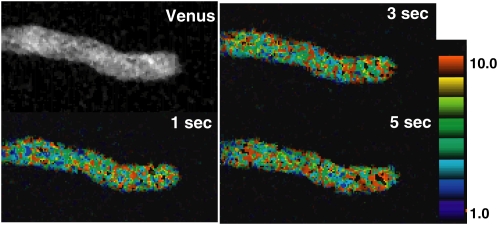
To confirm that ER functions as a Ca2+ store in the pollen tube, we monitored the [Ca2+] in the ER ([Ca2+]ER) of pollen tubes growing in the semi-in vivo condition and examined the effects of CPA treatment. We also generated transgenic Arabidopsis plants expressing a chimeric protein consisting of a signal peptide, YC4.60, and an ER retention signal. We monitored ECFP and Venus (FRET imaging) in a transgenic pollen tube passing through a pistil at 1- to 3-s intervals with excitation at 442 nm; the Venus/CFP fluorescence ratio was then calculated. Venus-labeled ER was localized longitudinally in the pollen tube (Fig. 8). Areas with a high [Ca2+]ER were distributed sporadically throughout the pollen tube (Fig. 8; Supplemental Video S8) and no ER with a high [Ca2+] was observed in the tip of the growing pollen tube. The maximum ratio of the high [Ca2+]ER areas was 9.5, which was estimated to correspond to between 100 and 500 μm (Fig. 2B).
Figure 8.
Imaging of the [Ca2+]ER in Arabidopsis pollen tubes growing in the semi-in vivo condition. The YFP image shows the ER, which was localized throughout the pollen tube. In the ratio (Venus/ECFP) images of the ER, high concentration areas were scattered throughout the pollen tube.
When CPA was added to pollen tubes in the semi-in vivo condition (final concentration: approximately 5 μm), the ratio decreased in 2 min from approximately 9 to 5.5, which corresponds to between 0.1 and 1 μm, although pollen tube growth was not completely inhibited (Fig. 9). When additional CPA was added to the culture medium (final concentration: approximately 10 μm), the ratio decreased further and pollen tube growth was completely arrested. Similar decreases of the ratio by CPA were observed repeatedly in eight of 10 pollen tubes treated with CPA (8/10 samples). The other two burst during monitoring. On the other hand, thapsigargin, another specific inhibitor of animal SERCA-type Ca2+-ATPases, did not change the [Ca2+]ER (data not shown). In these experiments, we assumed the specificity of CPA to be ER-type Ca2+-ATPases. These results suggested that the pollen tube ER contains CPA-sensitive Ca2+-ATPases and that the [Ca2+]ER is maintained at high level in the growing pollen tube. Moreover, it is likely that the ER is a Ca2+ store in pollen tubes and that CPA-sensitive Ca2+-ATPases are required for pollen tube growth.
Figure 9.
The effect of CPA on the [Ca2+]ER in Arabidopsis pollen tubes growing in the semi-in vivo condition. A, Ratio images of the ER. The numbers in each figure correspond to each point in the graph shown in B. B, The ratio change in the tip region. After the addition of CPA, the ratio gradually decreased. After the addition of more CPA, the ratio decreased further.
Ca2+ Imaging in N. tabacum Pollen Tubes
Regular [Ca2+]cyt oscillations in the tip region were rarely observed in the growing pollen tubes of YC3.60-expressing Arabidopsis, even though we monitored [Ca2+]cyt dynamics under three conditions: in vivo, semi-in vivo, and in vitro. Previous studies, however, have reported regular in vitro [Ca2+]cyt oscillations in growing pollen tubes from L. longiflorum and N. tabacum (Watahiki et al., 2004). To determine whether this discrepancy was caused by differences between the species, we monitored [Ca2+]cyt dynamics under various conditions using transgenic YC3.60-expressing N. tabacum. Under the in vitro condition, >90% of the pollen grains germinated with elongated pollen tubes 5 h after dissemination. We monitored growing pollen tubes that were >200 μm in length at 5-s intervals (growth rate: 4.5 ± 1.8 μm/min). [Ca2+]cyt gradients and regular [Ca2+]cyt oscillations were evident in three of 10 pollen tubes (3/10 samples; Fig. 10, A and B; Supplemental Video S9). In these cases, the mean value of the maximum ratio was 4.0 ± 0.2, whereas the mean value of the minimum ratio was 3.6 ± 0.2 (Fig. 10B). The mean amplitude range was 0.2 ± 0.1, and the periodicity of the [Ca2+]cyt oscillation was long, ranging from 40 to 60 s (Fig. 10B). These observations were similar to previously reported results. However, irregular oscillations were also observed in 17 of 20 pollen tubes in monitoring at 1- to 2-s intervals (17/20 samples; Fig. 10C; Table I; Supplemental Video S10). Moreover, distinct regular oscillations were observed in three of 20 pollen tubes when growth ceased or was very slow (3/20 samples; Fig. 10D; Table I; Supplemental Video S11). In these cases, the mean value of the maximum ratio was 4.8 ± 0.4, whereas the mean value of the minimum ratio was 2.8 ± 0.2 (Fig. 10D). The mean amplitude range was large, 1.0 ± 0.1, which was significantly different from the results shown in Figure 10B, although the periodicities of the [Ca2+]cyt oscillations were similar. These data suggested that regular oscillations were not directly related to the growth rate in N. tabacum or Arabidopsis.
Figure 10.
Regular and irregular [Ca2+]cyt oscillations observed in elongated N. tabacum pollen tubes 5 h after dissemination under the in vitro condition. A, ECFP, Venus, and ratio (Venus/ECFP) images of an elongated pollen tube 5 h after dissemination. A tip-focused [Ca2+]cyt gradient was observed. The ratio was measured in a tip area with a diameter of 8 μm. B, The ratio change in the tip region and elongation during monitoring of a normally growing pollen tube. Regular oscillations were observed but the amplitude was small. C, The ratio change in the tip region of a normally growing pollen tube and the distance moved during monitoring. The amplitude and periodicity of the oscillations were irregular. D, Regular oscillations in a pollen tube that was not growing. The amplitude was larger than that in A.
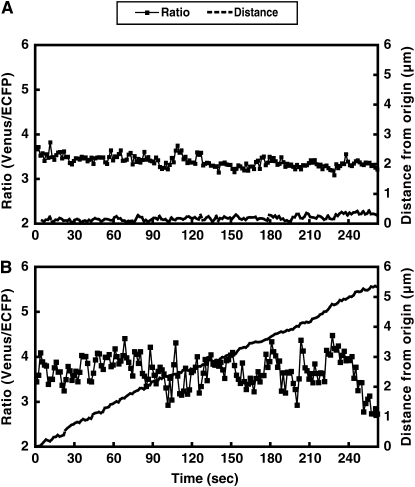
To examine whether regular [Ca2+]cyt oscillations occurred under the in vivo condition, we observed the stigma surface 3 h after pollination and monitored the germinated pollen tubes. Although growth was very slow in the lipophilic environment of the stigma surface, regular [Ca2+]cyt oscillations were not observed in all experiments (15/15 samples; Fig. 11A; Table I; Supplemental Video S12). Furthermore, we monitored pollen tubes after they grew through the pistil (the semi-in vivo condition). When a pollen tube was growing well, a [Ca2+]cyt gradient was evident but regular [Ca2+]cyt oscillations were not observed in all experiments (30/30 samples; Fig. 11B; Table I; Supplemental Video S13). These results were not affected by the monitoring interval. Thus, regular [Ca2+]cyt oscillations with large amplitudes were not observed in normally growing pollen tubes under three conditions: in vivo, semi-in vivo, and in vitro. These results suggested that regular [Ca2+]cyt oscillations are not essential for pollen tube growth in N. tabacum or Arabidopsis.
Figure 11.
Irregular oscillations observed in N. tabacum pollen tubes growing on the stigma (in vivo condition) and in pollen tubes growing through a style and then on germination medium (semi-in vivo condition). A, The ratio change in the tip and elongation of a pollen tube growing on a stigma. The amplitude and periodicity of the oscillations were irregular, whereas the growth rate was relatively low. B, The ratio change in growing pollen tubes under the semi-in vivo condition. The amplitude and periodicity were irregular.
DISCUSSION
Previously, the relationship between pollen tube growth and [Ca2+]cyt dynamics has been examined in vitro. In this study, we monitored pollen tube growth and [Ca2+]cyt dynamics in the pollen tubes of transgenic Arabidopsis and N. tabacum expressing YC3.60 using three different systems: in vitro, in vivo, and semi-in vivo. In addition, we examined the effects of inhibitors of pollen tube growth on [Ca2+]cyt dynamics in the semi-in vivo system.
In Arabidopsis, regular oscillations were not observed under the in vivo condition, in which the pollen tube grew in the papilla cell wall. Furthermore, under the semi-in vivo condition, which is thought to mimic the in vivo condition, only irregular oscillations were observed. Finally, under the in vitro condition, irregular oscillations were observed in growing pollen tubes, whereas regular oscillations were observed only when growth stopped or was very slow. These results suggested that regular oscillations are not essential for pollen tube growth in Arabidopsis.
In N. tabacum, both regular and irregular [Ca2+]cyt oscillations were observed in the tip region of normally growing pollen tubes under the in vitro condition. In addition, regular oscillations also were observed when the growth stopped or was relatively slow. Comparing the amplitudes of the regular oscillations revealed that the amplitude in slow-growing pollen tubes was 5-fold greater than that observed in normally growing pollen tubes. In the previous studies of N. tabacum and L. longiflorum transiently expressing YC2.1, regular [Ca2+]cyt oscillations were observed in normally growing pollen tubes. The amplitude was small, however, ranging from 0.1 to 0.15 in N. tabacum, and the maximum ratio of the oscillation was 1.6, considerably lower than the maximum ratio of 2.7 observed after addition of the ionophore (Watahiki et al., 2004). Moreover, the amplitude was lower in L. longiflorum than in N. tabacum (Watahiki et al., 2004). Interestingly, in regular oscillations from normally growing pollen tubes, the amplitude was small in both this study and the previous study and was different from the value observed in pollen tubes that had stopped growing. Furthermore, regular [Ca2+]cyt oscillations were rarely observed in either the in vivo or semi-in vivo condition. These results suggested that regular oscillations are not essential for the pollen tube growth in N. tabacum as well as in Arabidopsis. [Ca2+]cyt oscillations, which have a large amplitude range, also are not likely to be improper for pollen tube growth. In the previous experiments in L. longiflorum, [Ca2+]cyt do not regularly oscillate in the short pollen tubes about 30 min after germination, while [Ca2+]cyt regularly oscillates in the elongated pollen tubes 3 h after germination (Pierson et al., 1996; Messerli and Robinson, 1997; Feijó et al., 2001). These reports reinforced our conclusion that regular oscillations are not essential for the pollen tube growth. On the other hand, based on the data that the tip-focused [Ca2+]cyt gradient oscillates with the same period as the growth rate (Pierson et al., 1996; Messerli et al., 2000; Holdaway-Clarke and Hepler, 2003; Messerli and Robinson, 2003), models that the growth rate and [Ca2+]cyt were correlated have been presented (Holdaway-Clarke et al., 1997). In addition, it has been reported that the Rop GTPase activity regulating [Ca2+]cyt influx oscillated with the same period as the growth (Li et al., 1999; Hwang et al., 2005). Although we could not examine whether regular oscillation occurs in the nongrowing pollen tube of L. longiflorum or whether Rop GTPase activity oscillates in Arabidopsis, our results showed cases where [Ca2+]cyt oscillation was not correlated with the growth rate. For pollen tube growth, it is both important and essential to fine-tune the components that regulate [Ca2+]cyt. In living cells, the [Ca2+]cyt is critical for many cellular responses and must be maintained at a level approximately 2 × 10⁴ lower than the extracellular [Ca2+] (Petersen et al., 2005; Clapham 2007). In addition, [Ca2+]cyt oscillations are thought to control a diverse range of intracellular processes, which may be regulated by the amplitude, frequency, shape, or any combination of characteristics related to the oscillations (Petersen et al., 2005). We speculate that maintaining the [Ca2+]cyt in a narrow range is important for Ca2+ homeostasis in the pollen tube.
In L. longiflorum, [Ca2+]cyt dynamics in pollen tubes growing in vitro has been examined, revealing that regular [Ca2+]cyt oscillations correlated with the growth rate (Pierson et al., 1996; Messerli et al., 2000; Holdaway-Clarke and Hepler, 2003; Messerli and Robinson, 2003). Although we could not compare the in vitro [Ca2+]cyt dynamics with those observed under the in vivo and semi-in vivo conditions, irregular oscillations may occur under the in vivo or semi-in vivo condition in L. longiflorum and N. tabacum. In fact, TTS (for transmitting tissue specific protein), which is secreted by the pistil, has been shown to attract pollen tubes and stimulate their growth in N. tabacum (Cheung et al., 1995). Thus, molecules released from the pistil may affect [Ca2+]cyt dynamics in the pollen tube under in vivo or semi-in vivo conditions.
Changes in the [Ca2+]cyt are thought to be regulated by transporters localized in Ca2+ stores and the plasma membrane (Sze et al., 2000). The identities of the compartments that function as Ca2+ stores in the pollen tube, however, were previously unknown. In this study, we visualized [Ca2+]ER dynamics using transgenic Arabidopsis pollen expressing YC4.60, a modified fluorescent Ca2+ indicator with a relatively low affinity for Ca2+, making it suitable for the analysis of [Ca2+]ER dynamics against a high background [Ca2+]ER. Although the ERs were localized throughout the pollen tube, the [Ca2+]ER was not homogeneous and areas containing a high local [Ca2+]ER (e.g. 100–500 μm) were scattered throughout the pollen tubes. This result supports the idea that the [Ca2+]ER is heterogeneous due to an uneven distribution of ER Ca2+-binding proteins (Clapham, 2007). Thus, our results indicated that the ER is a Ca2+ store in growing pollen tubes.
Ca2+-sensitive vibrating electrodes and patch-clamp electrophysiology have been used to examine Ca2+ influx in the tip region (Kuhtreiber and Jaffe, 1990; Pierson et al., 1994; Holdaway-Clarke et al., 1997; Franklin-Tong et al., 2002; Dutta and Robinson, 2004). In this study, we always observed a tip-focused [Ca2+]cyt gradient in growing pollen tubes, with a submicromolar [Ca2+]cyt in the tip region. In addition, the regions showing a high [Ca2+]ER were scattered throughout the pollen tubes. These data suggested that Ca2+ imported through the plasma membrane in the tip region immediately moved into Ca2+ stores.
When Gd3+ was added to the samples, [Ca2+]cyt at the tip region decreased and the [Ca2+]cyt gradient disappeared from the tip region. On the other hand, just after the addition of CPA to the culture medium, the area with a high [Ca2+]cyt increased in size. The [Ca2+]cyt increase is thought to be the result of CPA impairing the ability to restore the cytoplasmic Ca2+. After the [Ca2+]cyt increase, [Ca2+]cyt was decreased and then regular [Ca2+]cyt oscillations were induced. The result that Gd3+ inhibited [Ca2+]cyt oscillations suggested that an imbalance of extracellular Ca2+ influx and Ca2+ efflux to outside would induce the regular [Ca2+]cyt oscillations.
In this study, the results that CPA decreased [Ca2+]ER and induced [Ca2+] oscillations suggested that the ER contains CPA-sensitive Ca2+-ATPases and that CPA affected Ca2+ efflux from the cytoplasm to the ER. Thapsigargin, another inhibitor of type IIA Ca2+-ATPases, did not induce a decrease in the [Ca2+]ER, however. Four different IIA-type Ca2+-ATPases and 10 different IIB-type Ca2+-ATPases have been identified in Arabidopsis. One of the IIA-type Ca2+-ATPases, ECA1, is inhibited by CPA but not thapsigargin (Liang et al., 1997; Liang and Sze, 1998; Sze et al., 2000), making it a good candidate for the CPA-sensitive Ca2+-ATPase in the ER of the pollen tube. On the other hand, one of the IIB-type Ca2+-ATPases, ACA2, is not inhibited by CPA, is present in ER, and is expressed in pollen grains (Harper et al., 1998; Hwang et al., 2000). As CPA at a concentration that induced [Ca2+]cyt oscillations did not completely deplete the [Ca2+]ER in this study, a CPA-insensitive Ca2+-ATPase in the ER might be related with the [Ca2+]cyt oscillations. In addition, ECA3, another IIA-type Ca2+-ATPase from Arabidopsis, has been detected in the Golgi apparatus (Mills et al., 2008), and a CPA-sensitive Ca2+ pump has been identified in both ER vesicles and the Golgi apparatus of Pisum sativum (Ordenes et al., 2002). Furthermore, vesicle accumulation independent of the ER was observed in the pollen tip of L. longiflorum (Parton et al., 2003; Bove et al., 2008). In addition, there is a possibility that a CPA-sensitive Ca2+ pump exists in vacuolar membrane. Therefore, the induction of regular [Ca2+]cyt oscillations by CPA may be related to Ca2+-ATPases not only in the ER but also in other intracellular compartments, such as Golgi vesicles and vacuoles.
In this study, we visualized cytoplasmic Ca2+ dynamics in pollen tubes growing under in vitro, in vivo, and semi-in vivo conditions in Arabidopsis and N. tabacum with a higher resolution, higher speed, and higher FRET efficiency compared with previously reported results from YC3.1-expressing Arabidopsis (Iwano et al., 2004). The tip-focused [Ca2+]cyt gradient was always observed in growing pollen tubes. Regular oscillations of the [Ca2+]cyt, however, were rarely identified in Arabidopsis or N. tabacum pollen tubes grown under the in vivo condition or in the semi-in vivo condition. On the other hand, regular oscillations were observed in vitro in both growing and nongrowing pollen tubes, although the oscillation amplitude was 5-fold greater in the nongrowing pollen tubes compared with growing pollen tubes. Although models that the growth rate and [Ca2+]cyt were correlated have been presented previously (Holdaway-Clarke et al., 1997), it was shown that [Ca2+]cyt oscillation was not always correlated with the growth rate. Our results suggested that a submicromolar [Ca2+]cyt in the tip region is essential for pollen tube growth, whereas a regular [Ca2+] oscillation is not. In addition, our results revealed that the ER acts as a Ca2+ store in pollen tubes and that CPA-sensitive Ca2+-ATPases in the ER function to maintain a high [Ca2+]ER. Furthermore, CPA-sensitive Ca2+-ATPases are likely required to maintain a narrow range of the [Ca2+]cyt in growing pollen tubes.
MATERIALS AND METHODS
Plant Materials and Growth Conditions
Arabidopsis (Arabidopsis thaliana) ecotype Columbia was used in all of the experiments. Arabidopsis plants were grown in mixed soil in a growth chamber. The light intensity was 120 to 150 μmol m−2 s−1 during the daily 12-h light period. The temperature was maintained at 22°C ± 2°C. Nicotiana tabacum cv SR1 was grown in mixed soil in a greenhouse, in which the temperature was maintained at 25°C ± 2°C.
Transgenic Constructs
A cassette containing the YC3.60-coding region followed by the nopaline synthase polyadenylation signal from pBIYC3.60 was constructed by replacing the GUS-coding sequence of pBI221 (CLONTECH) with the YC3.60-coding region. The 1.5-kb fragment upstream of the Act1 gene, which is highly expressed in reproductive tissues (An et al., 1996), was PCR amplified using the specific primers 5#-GAAGCTTTCTCTTTAAAAGTTAAGTTTTCTTTGTACATGTCTCTAAGC-3# and 5#-GTCTAGATTTCTTCTACCTTTATGCAAATCCAAACATTGTTTAAAGATC-3# (the underlined sequences show the incorporated HindIII and XbaI sites, respectively). The amplified fragments were subcloned into pBIYC3.60 to yield Act1 promoter-YC3.60. The chimeric gene comprising the 1.5-kb promoter region of the Act1 gene, the YC3.60 coding sequence, and the nopaline synthase transcription terminator were inserted into the binary vector pSLJ1006 (Jones et al., 1992) to create pAct1∷YC3.60.
To express YC4.60 in the pollen tube ER, the DNA fragment encoding YC3.60 in pSLG9-YC3.60 was replaced with that encoding YC4.60 in pcDNA-YC4.60, which yielded pSLG9-YC4.60. To construct a vector encoding ER-targeted YC4.60, a signal peptide and ER retention signal sequence were designed according to a previous report (Mitsuhashi et al., 2000). A double-strand oligonucleotide encoding the signal peptide (5#-GGCCGGATCCATGGCTAGATTGACTTCTATTATTGCTTTGTTTGCTGTTGCTTTGTTGGTTGCTGATGCTTATGCTTATCGTAC-3# as the sense strand and 5#-CATGGTACGATAAGCATAAGCATCAGCAACCAACAAAGCAACAGCAAACAAAGCAATAATAGAAGTCAATCTAGCCATGGATCC-3# as the antisense strand) was synthesized and ligated into the Eco52I and NcoI sites of pSLG9∷YC4.60, yielding pSLG9∷SP-YC4.60. To synthesize a DNA fragment encoding the C-terminal portion of YC4.60 with an ER retention signal, a PCR was performed using specific primers (5#-AAGAAGATCTCCAGCTCCGGGGCACTGGAGCTTAT-3# and 5#-AATAGAGCTCACAATTCATCATGATGATGATGATGATGTCCACCTCCCTCGATGTTGTGGCGGATCT-3#) and pSLG9∷YC4.60 as the template. The obtained fragment was digested with BglII and SacI, and ligated to the BglII and SacI sites of pSLG9∷SP-YC4.60, yielding pSLG9∷SP-YC4.60-ER.
A DNA fragment from pSLG9∷SP-YC4.60-ER encoding SP-YC4.60-ER was PCR amplified using specific primers (5#-ACGGTCTAGATGGCTAGATTGACTTCTATTATTG-3# and 5#-AATAGAGCTCACAATTCATCATGATGATGATGATGATGTCCACCTCCCTCGATGTTGTGGCGGATCT-3#). The obtained DNA fragment was digested with XbaI and SacI, and ligated into the XbaI and SacI sites of pBI121-pAct1∷YC3.60, resulting in pBI121-pAct1∷YC4.60(ER).
To express YC3.60 in the N. tabacum pollen tube cytoplasm, the 35S promoter and GUS reporter gene in pBI121 were replaced with the microspore-specific Lat52 promoter from pBI121-pLat52∷GUS (Twell et al., 1991) and the YC3.60-coding fragment from pSLG9-YC3.60, which yielded pLat52∷YC3.60.
Transformation
The pSLJAct1-YC3.60 and pSLJAct1-YC4.60 plasmids were electroporated into Agrobacterium tumefaciens strain EHA105 (Hood et al., 1993). For Arabidopsis, the Agrobacterium infiltration procedure was performed with unopened flower buds of Arabidopsis ecotype Columbia as previously described (Bechtold and Pelletier, 1998). The transformed seeds were selected on half-strength Murashige and Skoog plates containing kanamycin (50 μg/mL) and were analyzed using PCRs to test for the presence of the YC3.60 gene. For N. tabacum, the Agrobacterium infiltration procedure was performed with leaf discs from N. tabacum cv SR1 as previously described (Horsch et al., 1985).
Pollen Tube Growth, Ratiometric Imaging, and Image Analysis
For in vitro imaging, pollen grains from freshly dehisced anthers of YC3.60-expressing plants were mounted on modified germination medium containing 2 mm CaCl2, 0.01% boric acid, 1 mm MgSO4, 1% (w/v) agar (ultralow gelling temperature type IX-A; Sigma-Aldrich), and 17% (w/v) Suc (pH adjusted to 7.0 using KOH) in moistened glass-bottomed dishes (Palanivelu et al., 2003) for Arabidopsis or germination medium (Read et al., 1993) containing 0.5% (w/v) agar for N. tabacum. After 5 h at 20°C for Arabidopsis and at 25°C for N. tabacum, pollen tubes that were at least 200 μm in length were imaged with an Olympus IX81 inverted microscope equipped with a CSU-22 spinning Nipkow disc confocal unit, an EM-CCD C9100 camera (Hamamatsu), an image splitter (Dual-View; Optical Insights), and a diode-pumped solid-state 445-nm laser (iFLEX2000; Point Source). Imaging of the cameleon emission ratio was accomplished using two emission filters (480/30 for ECFP and 535/40 for Venus). After a background subtraction, the Venus/ECFP ratio was determined using MetaMorph software. An Olympus UPlanSApo 60×/1.35w immersion objective lens was used for imaging. In each experiment, the ratio in a region with a diameter of 6 μm was measured using the MetaMorph software and is shown as sequential line graphs. For analysis of the changes in the [Ca2+], the maximum and the minimum values in each periodicity were measured, allowing calculation of the amplitude in each periodicity. In each experiment, the mean maximum, minimum, and amplitude values were calculated using Excel software. Exposure times were typically 50 to 500 ms, and images were collected every 0.5 to 5 s.
To confirm that full-length cameleon was expressed in the pollen tube, elongated pollen tubes were monitored with excitation at 458 nm using a spectral imaging fluorescence microscope system (LSM510 META; Carl Zeiss). This system is capable of resolving the spectra of various fluorescence images; therefore, we were able to obtain images with no interference from the overlapping fluorescence emissions (Haraguchi et al., 2002; Iwano et al., 2004). A Zeiss 63× W Korr objective lens (numerical aperture of 1.2) was used to image the pollen tubes.
To examine the effects of a Ca2+ channel blocker, Gd3+ (Sigma-Aldrich) was dissolved in the germination medium. To examine the effects of a P-type IIA Ca2+-ATPase inhibitor, CPA was dissolved in dimethyl sulfoxide and added to the germination medium to a final concentration of 10 to 100 μm. Dimethyl sulfoxide alone had no discernible effects on germination or tube growth.
For in vivo imaging in Arabidopsis, a pistil was mounted on a coverslip prior to pollination, fixed with double-sided tape, and covered with 1% agar except for the stigma. After a pollen grain from a transgenic Arabidopsis was mounted on a wild-type Arabidopsis papilla cell using a micromanipulator, the [Ca2+]cyt in the pollen tube growing through the papilla cell wall was monitored under dry conditions using the microscope system described above. For N. tabacum, the pistil was mounted on a coverslip 3 h after pollination, fixed with double-sided tape, covered with 1% agar except for the stigma, and monitored. These experiments were carried out more than 10 times.
For imaging under the semi-in vivo condition, wild-type Arabidopsis flowers excised before they dehisced were attached to an agar plate after the anthers of a transgenic Arabidopsis were removed from the flowers. Pollen grains from freshly dehisced anthers of YC3.60- or YC4.60-expressing plants were attached to the wild-type stigma. Thirty minutes after pollination, the upper half of the pollinated pistil was excised and mounted in germination medium in a moistened glass-bottomed dish. After 2 h at 20°C, the [Ca2+]cyt in pollen tubes growing through the style was monitored using the microscope system described above. For N. tabacum, styles, excised before the flowers were dehisced, were attached to an agar plate and pollinated with pollen grains from freshly dehisced anthers of YC3.60-expressing plants. After 18 h at 25°C, the [Ca2+]cyt in pollen tubes growing through the style was monitored using the microscope system described above. These experiments were carried out more than 30 times.
Calibration of YC3.60 and YC4.60 Ratiometric Changes
Calibration of the [Ca2+]cyt was carried out as described previously (Allen et al., 1999). Serial dilutions of purified YC3.60 and YC4.60 were made in Ca2+ calibration buffer (Molecular Probes), in which the free [Ca2+] ranged from 0 μm to 1 mm. Dilutions of YC3.60 and YC4.60 that resulted in similar signal intensities to those seen in YC3.60- and YC4.60-expressing pollen tubes were used to determine Rmin and Rmax. Rmin and Rmax values were 2.95 and 8.33 for YC3.60, and 3.53 and 9.87 for YC4.60, respectively. These values were used to convert the YC3.60 and YC4.60 fluorescence ratios into a [Ca2+]cyt by fitting them to YC3.60 and YC4.60 calibration curves obtained in vitro.
Pollen Tube Growth Rate
The growth rate, calculated from the elongation length during a 3-min period, was obtained using Venus fluorescence in the growing pollen tube and MetaMorph software.
Statistical Analysis
Statistical analyses were performed using Student's t tests, when necessary.
Supplemental Data
The following materials are available in the online version of this article.
Supplemental Video S1. Irregular [Ca2+]cyt oscillations in a normally growing Arabidopsis pollen tube under the in vitro condition.
Supplemental Video S2. Regular [Ca2+]cyt oscillations in a slowly growing Arabidopsis pollen tube under the in vitro condition.
Supplemental Video S3. Regular oscillations followed by irregular oscillations in an elongated Arabidopsis pollen tube under the in vitro condition.
Supplemental Video S4. Irregular oscillations observed in an Arabidopsis pollen tube growing through a papilla cell wall (in vivo condition).
Supplemental Video S5. Irregular oscillations observed in an Arabidopsis pollen tube growing through a style and then on germination medium (semi-in vivo condition).
Supplemental Video S6. The effects of CPA and Gd3+ on the changes in the [Ca2+]cyt in the tip region of Arabidopsis pollen tubes growing in the semi-in vivo condition.
Supplemental Video S7. The effects of Gd3+ on the changes in the [Ca2+]cyt in the tip region of an Arabidopsis pollen tube growing in the semi-in vivo condition.
Supplemental Video S8. Imaging of the [Ca2+]ER in an Arabidopsis pollen tube growing in the semi-in vivo condition.
Supplemental Video S9. Regular [Ca2+]cyt oscillations observed in an elongated N. tabacum pollen tube.
Supplemental Video S10. Irregular [Ca2+]cyt oscillations observed in an elongated N. tabacum pollen tube.
Supplemental Video S11. Regular [Ca2+]cyt oscillations observed in a stopping N. tabacum pollen tube.
Supplemental Video S12. Irregular oscillations observed in a N. tabacum pollen tube growing on the stigma (in vivo condition).
Supplemental Video S13. Irregular oscillations observed in a N. tabacum pollen tube growing through a style and then on germination medium (semi-in vivo condition).
Supplementary Material
Acknowledgments
We thank Mrs. Onishi, Mrs. Yamamoto, Mrs. Matsumura, Mrs. Okamura, Mrs. Katsui, and Mrs. Ichikawa for their technical assistance and Dr. Pulla Nakayama for her critical reading.
This work was supported in part by Grants-in-Aid for Special Research on Priority Areas (nos. 16GS0316 and 18075008), Grants-in-Aid for Special Research (C) (no. 19570040), and Scientific Research for Plant Graduate Students from the Ministry of Education, Culture, Sports, Science and Technology of Japan.
The author responsible for distribution of materials integral to the findings presented in this article in accordance with the policy described in the Instructions for Authors (www.plantphysiol.org) is: Seiji Takayama (takayama@bs.naist.jp).
The online version of this article contains Web-only data.
References
- Allen GJ, Chu SP, Harrington CL, Schumacher K, Hoffman T, Tang YY, Grill E, Schroeder JI (2001) A defined range of guard cell calcium oscillation parameters encodes stomatal movements. Nature 411 1053–1057 [DOI] [PubMed] [Google Scholar]
- Allen GJ, Chu SP, Schumacher K, Shimazaki CT, Vafeados D, Kemper A, Hawke SD, Tallman G, Tsien RY, Harper JF, et al (2000) Alteration of stimulus-specific guard cell calcium oscillations and stomatal closing in Arabidopsis det3 mutant. Science 289 2338–2342 [DOI] [PubMed] [Google Scholar]
- Allen GJ, Kwak JM, Chu SP, Llopis J, Tsien RY, Harper JF, Schroeder JI (1999) Cameleon calcium indicator reports cytoplasmic calcium dynamics in Arabidopsis guard cells. Plant J 19 735–747 [DOI] [PubMed] [Google Scholar]
- An YQ, Huang S, McDowell JM, McKinney EC, Meagher RB (1996) Conserved expression of the Arabidopsis ACT1 and ACT3 actin subclass in organ primordia and mature pollen. Plant Cell 8 15–30 [DOI] [PMC free article] [PubMed] [Google Scholar]
- Bechtold N, Pelletier G (1998) In planta Agrobacterium-mediated transformation of adult Arabidopsis thaliana plants by vacuum infiltration. Methods Mol Biol 82 259–266 [DOI] [PubMed] [Google Scholar]
- Bove J, Vaillancourt B, Kroeger J, Hepler PK, Wiseman PW, Geitmann A (2008) Magnitude and direction of vesicle dynamics in growing pollen tubes using spatiotemporal image correlation spectroscopy and fluorescence recovery after photobleaching. Plant Physiol 147 1646–1658 [DOI] [PMC free article] [PubMed] [Google Scholar]
- Brewbaker JL, Kwack BH (1963) The essential role of calcium ion in pollen germination and pollen tube growth. Am J Bot 50 859–865 [Google Scholar]
- Cheung AY, Wang H, Wu HM (1995) A floral transmitting tissue-specific glycoprotein attracts pollen tubes and stimulates their growth. Cell 82 383–393 [DOI] [PubMed] [Google Scholar]
- Cheung AY, Wu HM (2008) Structural and signaling networks for the polar cell growth machinery in pollen tubes. Annu Rev Plant Biol 59 547–572 [DOI] [PubMed] [Google Scholar]
- Clapham DE (2007) Calcium signaling. Cell 131 1047–1058 [DOI] [PubMed] [Google Scholar]
- Dutta R, Robinson KR (2004) Identification and characterization of stretch-activated ion channels in pollen protoplasts. Plant Physiol 135 1398–1406 [DOI] [PMC free article] [PubMed] [Google Scholar]
- Feijó JA, Sainhas J, Holdaway-Clarke T, Cordeiro MS, Kunkel JG, Hepler PK (2001) Cellular oscillations and the regulation of growth: the pollen tube paradigm. Bioessays 23 86–94 [DOI] [PubMed] [Google Scholar]
- Franklin-Tong VE, Holdaway-Clarke TL, Straatman KR, Kunkel JG, Hepler PK (2002) Involvement of extracellular calcium influx in the self-incompatibility response of Papaver rhoeas. Plant J 29 333–345 [DOI] [PubMed] [Google Scholar]
- Frietsch S, Wang YF, Sladek C, Poulsen LR, Romanowsky SM, Schroeder JI (2007) A cyclic nucleotide-gated channel is essential for polarized tip growth of pollen. Proc Natl Acad Sci USA 104 14531–14536 [DOI] [PMC free article] [PubMed] [Google Scholar]
- Geisler M, Axelsen KB, Harper JF, Palmgren MG (2000) Molecular aspects of higher plant P-type Ca2+-ATPases. Biochim Biophys Acta 1465 52–78 [DOI] [PubMed] [Google Scholar]
- Geitmann A, Cresti M (1998) Ca2+ channels control the rapid expansions in pulsating growth of Petunia hybrida pollen tubes. J Plant Physiol 152 439–447 [Google Scholar]
- Haraguchi T, Shimi T, Koujin T, Hashiguchi N, Hiraoka Y (2002) Spectral imaging fluorescence microscopy. Genes Cells 7 881–887 [DOI] [PubMed] [Google Scholar]
- Harper JF, Hong B, Hwang I, Guo HQ, Stoddard R, Huang JF, Palmgren MG, Sze H (1998) A novel calmodulin-regulated Ca2+-ATPase (ACA2) from Arabidopsis with an N-terminal autoinhibitory domain. J Biol Chem 273 1099–1106 [DOI] [PubMed] [Google Scholar]
- Holdaway-Clarke TL, Feijo JA, Hackett GR, Kunkel JG, Hepler PK (1997) Pollen tube growth and the intracellular cytosolic calcium gradient oscillate in phase while extracellular calcium influx is delayed. Plant Cell 9 1999–2010 [DOI] [PMC free article] [PubMed] [Google Scholar]
- Holdaway-Clarke T, Hepler P (2003) Control of pollen tube growth: role of ion gradients and fluxes. New Phytol 159 539–563 [DOI] [PubMed] [Google Scholar]
- Hood EE, Gelvin SB, Melchers LS, Hoekema A (1993) New agrobacterium helper plasmids for gene transfer to plants. Transgenic Res 2 208–218 [Google Scholar]
- Horsch RB, Fry JE, Hoffmann NL, Eichholtz D, Rogers SG, Fraley RT (1985) A simple and general method for transferring genes into plants. Science 227 1229–1231 [DOI] [PubMed] [Google Scholar]
- Hwang I, Sze H, Harper JF (2000) A calcium-dependent protein kinase can inhibit a calmodulin-stimulated Ca2+ pump (ACA2) located in the endoplasmic reticulum of Arabidopsis. Proc Natl Acad Sci USA 97 6224–6229 [DOI] [PMC free article] [PubMed] [Google Scholar]
- Hwang JU, Gu Y, Lee YJ, Yang Z (2005) Oscillatory ROP GTPase activation leads the oscillatory polarized growth of pollen tubes. Mol Biol Cell 16 5385–5399 [DOI] [PMC free article] [PubMed] [Google Scholar]
- Inesi G, Sagara Y (1994) Specific inhibitors of intracellular Ca2+ transport ATPases. J Membr Biol 141 1–6 [DOI] [PubMed] [Google Scholar]
- Iwano M, Shiba H, Miwa T, Che FS, Takayama S, Nagai T, Miyawaki A, Isogai A (2004) Ca2+ dynamics in a pollen grain and papilla cell during pollination of Arabidopsis. Plant Physiol 136 3562–3571 [DOI] [PMC free article] [PubMed] [Google Scholar]
- Jones JDG, Shlumukov L, Carland F, English J, Scofield SR, Bishop GJ, Harrison K (1992) Effective vectors for transformation, expression of heterologous genes, and assaying transposon excision in transgenic plants. Transgenic Res 1 285–297 [DOI] [PubMed] [Google Scholar]
- Kuhtreiber WM, Jaffe LF (1990) Detection of extracellular calcium gradients with a calcium-specific vibrating electrode. J Cell Biol 110 1565–1573 [DOI] [PMC free article] [PubMed] [Google Scholar]
- Li H, Lin Y, Heath RM, Zhu MX, Yang Z (1999) Control of pollen tube tip growth by a Rop GTPase-dependent pathway that leads to tip-localized calcium influx. Plant Cell 11 1731–1742 [DOI] [PMC free article] [PubMed] [Google Scholar]
- Liang F, Cunningham KW, Harper JF, Sze H (1997) ECA1 complements yeast mutants defective in Ca2+ pumps and encodes an endoplasmic reticulum-type Ca2+-ATPase in Arabidopsis thaliana. Proc Natl Acad Sci USA 94 8579–8584 [DOI] [PMC free article] [PubMed] [Google Scholar]
- Liang F, Sze H (1998) A high-affinity Ca2+ pump, ECA1, from the endoplasmic reticulum is inhibited by cyclopiazonic acid but not by thapsigargin. Plant Physiol 118 817–825 [DOI] [PMC free article] [PubMed] [Google Scholar]
- Malhó R, Read ND, Pais MS, Trewavas AJ (1994) Role of cytosolic free alcium in the reorientation of pollen tube growth. Plant J 5 331–341 [Google Scholar]
- Messerli MA, Creton R, Jaffe LF, Robinson KR (2000) Periodic increases in elongation rate precede increases in cytosolic Ca2+ during pollen tube growth. Dev Cell 222 84–98 [DOI] [PubMed] [Google Scholar]
- Messerli M, Robinson KR (1997) Tip localized Ca2+ pulses are coincident with peak pulsatile growth rates in pollen tubes of Lilium longiflorum. J Cell Sci 110 1269–1278 [DOI] [PubMed] [Google Scholar]
- Messerli MA, Robinson KR (2003) Ionic and osmotic disruptions of the lily pollen tube oscillator: testing proposed models. Planta 217 147–157 [DOI] [PubMed] [Google Scholar]
- Mills RF, Doherty ML, Lopez-Marques RL, Weimar T, Dupree P, Palmgren MG, Pittman JK, Williams LE (2008) ECA3, a Golgi-localized P2A-type ATPase, plays a crucial role in manganese nutrition in Arabidopsis. Plant Physiol 146 116–128 [DOI] [PMC free article] [PubMed] [Google Scholar]
- Mitsuhashi N, Shimada T, Mano S, Nishimura M, Hara-Nishimura I (2000) Characterization of organelles in the vacuolar-sorting pathway by visualization with GFP in tobacco BY-2 cells. Plant Cell Physiol 41 993–1001 [DOI] [PubMed] [Google Scholar]
- Miyawaki A, Llopis J, Heim R, McCaffery JM, Adams JA, Ikura M, Tsien RY (1997) Fluorescent indicators for Ca2+ based on green fluorescent proteins and calmodulin. Nature 388 834–835 [DOI] [PubMed] [Google Scholar]
- Miwa H, Sun J, Oldroyd GE, Downie JA (2006) Analysis of calcium spiking using a cameleon calcium sensor reveals that nodulation gene expression is regulated by calcium spike number and the developmental status of the cell. Plant J 48 883–894 [DOI] [PubMed] [Google Scholar]
- Nagai T, Ibata K, Park ES, Kubota M, Mikoshiba K, Miyawaki A (2002) A variant of yellow fluorescent protein with fast and efficient maturation for cell-biological applications. Nat Biotechnol 20 87–90 [DOI] [PubMed] [Google Scholar]
- Nagai T, Yamada S, Tominaga T, Ichikawa M, Miyawaki A (2004) Expanded dynamic range of fluorescent indicators for Ca2+ by circularly permuted yellow fluorescent proteins. Proc Natl Acad Sci USA 101 10554–10559 [DOI] [PMC free article] [PubMed] [Google Scholar]
- Ordenes VR, Reyes FC, Wolff D, Orellana A (2002) A thapsigargin-sensitive Ca2+ pump is present in the pea Golgi apparatus membrane. Plant Physiol 129 1820–1828 [DOI] [PMC free article] [PubMed] [Google Scholar]
- Palanivelu R, Brass L, Edlund AF, Preuss D (2003) Pollen tube growth and guidance is regulated by POP2, an Arabidopsis gene that controls GABA levels. Cell 114 47–59 [DOI] [PubMed] [Google Scholar]
- Parton RM, Fischer-Parton S, Trewavas AJ, Watahiki MK (2003) Pollen tubes exhibit regular periodic membrane trafficking events in the absence of apical extension. J Cell Sci 116 2707–2719 [DOI] [PubMed] [Google Scholar]
- Petersen OH, Michalak M, Verkhratsky A (2005) Calcium signaling: past, present and future. Cell Calcium 38 161–169 [DOI] [PubMed] [Google Scholar]
- Pierson ES, Miller DD, Callaham DA, Shipley AM, Rivers BA, Cresti M, Hepler PK (1994) Pollen tube growth is coupled to the extracellular calcium ion flux and the intracellular calcium gradient: effect of BAPTA-type buffers and hypertonic media. Plant Cell 6 1815–1828 [DOI] [PMC free article] [PubMed] [Google Scholar]
- Pierson ES, Miller DD, Callaham DA, van Aken J, Hackett G, Hepler PK (1996) Tip-localized calcium entry fluctuates during pollen tube growth. Dev Biol 174 160–173 [DOI] [PubMed] [Google Scholar]
- Read SM, Clarke AE, Bacic A (1993) Stimulation of growth of cultured Nicotiana tabacum W 38 pollen tubes by poly(ethylene glycol) and Cu(II) salts. Protoplasma 177 1–14 [Google Scholar]
- Sze H, Liang F, Hwang I (2000) Diversity and regulation of plant Ca2+ pumps: insights from expression in yeast. Annu Rev Plant Physiol Plant Mol Biol 51 433–462 [DOI] [PubMed] [Google Scholar]
- Twell D, Yamaguchi J, Wing RA, Ushiba J, Mccormick S (1991) Promoter analysis of genes that are coordinately expressed during pollen development reveals pollen-specific enhancer sequences and shared regulatory elements. Genes Dev 5 496–507 [DOI] [PubMed] [Google Scholar]
- Watahiki MK, Trewavas AJ, Parton RM (2004) Fluctuations in the pollen tube tip-focused calcium gradient are not reflected in nuclear calcium level: a comparative analysis using recombinant yellow cameleon calcium reporter. Sex Plant Reprod 17 125–130 [Google Scholar]
Associated Data
This section collects any data citations, data availability statements, or supplementary materials included in this article.


