Abstract
The objective of this study was to describe the kinetics of orally administered sugar probes in serum for the assessment of gastrointestinal permeability and intestinal absorptive capacity in dogs. Eight healthy dogs received lactulose (L), rhamnose (R), methylglucose (M), xylose (X), and sucrose (S) by orogastric intubation. Baseline blood samples and subsequently timed blood samples were taken during 24 hours. Sugars were analyzed by gas chromatography-mass spectrometry (GC-MS). Statistical analysis was performed using a Friedman test with Dunn’s multiple comparison post test and a Kruskal-Wallis test. Statistical significance was set at a P-value < 0.05. Sugars in serum were detected after orogastric administration. Concentrations of L and R were significantly different from the baseline from 90 to 240 and 60 to 300 min, respectively, and those of X, M, and S were different from 30 to 240 min post-dosing (P < 0.05 for all 5 probes). Maximum concentrations of L and R were obtained at 180 min, while X, M, and S reached their maximum concentrations at 90 min post-dosing. For all sugars, no statistically significant differences were found between concentrations at 90, 120, and 180 min or between the coefficients of variation (CV%) of those mean concentrations for these 3 time points. Based on these data, the collection of 2 blood samples, one taken at baseline and the other obtained between 90 and 180 minutes after dosing, might be sufficient for the determination of gastrointestinal permeability and mucosal absorptive capacity using these 5 sugar probes in canine serum.
Résumé
L’objectif de la présente étude était de décrire la cinétique sérique de sucres sondes administrés oralement pour l’évaluation de la perméabilité gasto-intestinale et de la capacité d’absorption chez le chien. Huit chiens en santé ont reçu du lactulose (L), du rhamnose (R), du méthyl-glucose (M), du xylose (X) et du sucrose (S) par intubation orogastrique. Des échantillons sanguins pour les valeurs de base et des échantillons subséquents chronométrés ont été prélevés sur une période de 24 heures. Les sucres ont été analysés par chromatographie gazeuse-spectre de masse (GC-MS). Une analyse statistique a été effectuée en utilisant le test de Friedman avec une comparaison post-test multiple de Dunn et un test de Kruskal-Wallis. Le seuil de signification a été fixé à une valeur de P < 0,05. Les sucres dans le sérum ont été détectés après administration orogastrique. Les concentrations de L et R étaient significativement différentes des valeurs de base, respectivement, entre 90 et 240 et 60 et 300 min, et celles de X, M et S étaient différentes entre 30 et 240 min post-administration (P < 0,05 pour les 5 sondes). Les concentrations maximales de L et R ont été obtenues à 180 min, alors que celles de X, M et S ont atteint leur maximum 90 min post-administration. Pour tous les sucres, aucune différence significative n’a été trouvée entre les concentrations à 90, 120 et 180 min ou entre les coefficients de variation (%CV) des concentrations moyennes pour ces 3 coordonnées temporelles. Sur la base de ces données, le dosage de ces 5 sucres sondes dans 2 prélèvement sanguins, le premier au temps 0 et le second 90 à 180 min après l’administration du sucre, pourrait être suffisant pour déterminer la perméabilité et la capacité d’absorption de la muqueuse gastro-intestinale.
(Traduit par Docteur Serge Messier)
Introduction
The gastrointestinal tract (GIT) provides barrier and transport functions, preventing the passage of pathogens, toxins, and other luminal contents to extra-intestinal tissues, while selectively absorbing essential nutrients. These functions can be assessed via the intestinal permeability and absorption of macromolecules, which passively diffuse through or are absorbed via carrier-mediated transport (1). Permeation and absorption of solutes through the gastrointestinal epithelium is dependent on the structure of the membrane, the physicochemical properties of the solute, and its interaction with the media or solvent (2).
Approximately 90% of the absorption in the GIT occurs in the small intestine, while the remainder occurs in the colon and cecum. This large capacity is in part related to the large surface area provided by the gastrointestinal epithelial cells. The enterocyte is the most abundant cell type with a surface area of approximately 2 × 106 cm2, due to surface-amplification through villi and microvilli (3,4).
The route by which a compound crosses the intestinal epithelium can be transcellular (small pores) or paracellular (large pores). Transcellular absorption from the gastrointestinal lumen and into the blood requires carrier-mediated transport. The paracellular permeability depends on the regulation of intercellular tight junctions, which consist of channels formed by adjacent enterocytes. Only a small number of compounds can cross the paracellular space due to the fact that the surface area available for these channels is estimated to only be about 0.01% of the total surface area of the small intestine (5,6).
Three distinct pores are present along the crypt-villus axis, which affects GIT permeability based on molecular size restriction (7). At the tips of the villi, there is an abundance of small pores (radius < 6 Å; < 0.6 nm), while in the crypts much larger pores (50–60 Å; 5–6 nm) are found in low density. Intermediate sized (10–15 Å; 1–1.5 nm) channels, which are not exposed to luminal content, can be found at the base of the villi. Thus, tight junctions of the villus tip are more restrictive than those that make up the epithelium of the crypts (5). This prevents molecules the size of disaccharides (lactulose, for example) from moving across the villus tip; whereas, monosaccharides such as mannitol can cross with relative freedom (8). The epithelial junctions become progressively tighter from the small intestine to the colon, decreasing the permeability to polar compounds along the intestinal tract (9).
Disorders of the intestinal barrier tend to decrease the transcellular permeability, reflecting a diminished number of mucosal cells; whereas, paracellular permeability tends to increase, reflecting damage to the tight junctions (7,10). According to a review by Cave et al (11), an increased intestinal permeability has been reported in several intestinal diseases in dogs and cats, including gluten sensitive enteropathy, small intestinal bacterial overgrowth, intestinal ischemia-reperfusion injury, and nonsteroidal anti-inflammatory drug-induced injury.
Intestinal permeability is traditionally assessed by measuring urinary excretion of orally administered water-soluble, nondegradable test molecules. The test compares the intestinal permeation of larger molecules, which occurs only between cells at or near the crypts with that of smaller molecules, which normally permeate along the entire crypt-villus axis (1). Calculation of a ratio of permeation of the large to the small marker molecule reduces the potential influence of pre-mucosal, mucosal, and post-mucosal factors (1,12). An increased ratio could reflect an increase in the paracellular permeability due to factors such as loss of villus height, which would allow an amplified permeation through the larger pores formed by adjacent crypt cells (13). The most commonly used markers for permeability testing are mono- and disaccharides, 51Cr-EDTA, polyethylene glycols (PEGs), and dextran. Inert sugars, such as lactulose and L-rhamnose, are commonly used as markers of small intestinal permeability. While lactulose permeates through paracellular pores of low frequency, L-rhamnose crosses the intestinal epithelium mainly by transcellular passive diffusion through aqueous pores at a much higher rate, but neither lactulose nor rhamnose undergoes carrier-mediated transport (1,14). D-xylose and 3-O-methyl-D-glucose are nonmetabolizable monosaccharides that are absorbed by the intestinal epithelial cells via carrier-mediated transport and they are commonly used as markers of intestinal absorptive capacity. D-xylose undergoes passive carrier mediated transport, principally in the jejunum; whereas 3-O-methyl-D-glucose is absorbed by active carrier transport throughout the small intestine (15). Finally, sucrose has been introduced as a probe to assess gastric mucosal permeability. Sucrose is hydrolyzed in the very proximal small intestine, and thus the presence of intact sucrose in serum or urine implies pre-duodenal permeation due to gastric mucosal damage (16).
Several methods for the assessment of intestinal permeability and mucosal absorptive capacity have been developed (1,14). To date, protocols utilizing permeability markers excreted and recovered in urine are the most widely used (17,18). However, these protocols require complete urine collection over a period of at least 4 h and sometimes up to 24 h. These methods are laborious and often impractical. Also, errors may be introduced through incomplete urine collection, which may affect the test results (19,20).
The measurement of carbohydrates in serum would simplify the assessment of intestinal permeability and absorptive function under clinical conditions. Some GI permeability studies using different sugar markers in serum have been reported. For instance, sucrose has been measured in serum by an enzymatic method for the detection of gastric damage in humans (21), and has also been used for the assessment of gastric permeability in horses with gastric ulceration using a high performance liquid chromatography-mass spectrometry (HPLC-MS) method (22). Determination of 3-O-methyl-D-glucose in serum has been performed as a measure of gastric emptying time using thin layer chromatography and densitometry (23). Lactulose and mannitol have been measured in serum for the assessment of intestinal permeability in humans (19). Finally, a recent study has described assessment of intestinal permeability and absorptive capacity in dogs using an HPLC-based method for the measurement of lactulose, rhamnose, 3-O-methyl-D-glucose, and xylose in serum (20). However, there is limited experience using these assays in serum with gas chromatography-mass spectrometry (GC-MS) for the assessment of intestinal permeability and absorptive function. An essential advantage of using GC-MS would be an improved sensitivity when compared with HPLC-MS methods. We have recently analytically validated a GC-MS method for sugar analysis in serum (24). Due to the improved sensitivity and specificity obtained through this GC-MS method relative to previously mentioned assays, this method appears to be superior to previous methods used for carbohydrate analysis for gastrointestinal permeability and mucosal function testing (25). However, analysis of any polar, nonvolatile substance, such as sugars, by GC-MS requires derivatization prior to analysis.
The aim of this study was to analyze the kinetics of D-(+)-xylose, L-rhamnose, 3-O-methyl-D-glucopyranose, sucrose, and lactulose in serum from healthy dogs after orogastric administration.
Materials and methods
This study was approved by the University Animal Care and Use Committee (ULAC) at the College of Veterinary Medicine and Biomedical Sciences at Texas A&M University. Gastrointestinal permeability and absorption tests were performed in 8 healthy research dogs. All animals were adults between 2 and 7 years of age. All dogs were monitored daily, and none showed any history related to gastrointestinal tract disease. The overall health status of the dogs was assessed by a baseline complete blood (cell) count (CBC) and serum biochemistry analysis. The permeability and absorption test protocol required a 48 h period before the test in which the dogs did not receive any agent that could alter small bowel permeability. Dogs were kenneled in individual cages 5 d before the experiment. To ensure that no dietary sugars would be present in the serum, food was withheld for at least 18 h prior to the gastrointestinal permeability and absorption tests.
Hyperosmolar solutions may cause gastrointestinal side effects, such as diarrhea (26). In addition, gastrointestinal permeability has been shown to be altered by either hypo- or hyperosmolar solutions (27,28). Therefore, all dogs received an approximately isoosmolar (osm) sugar solution (318.3 mosm/L). To ensure that the dogs received similar amounts of sugar per body weight (BW), the volume of the sugar solutions used was roughly modified based on body weight. Thus, dogs received either 100 mL (dogs < 10 kg BW), 200 mL (dogs 10 to 20 kg BW), or 400 mL (dogs > 20 kg BW) of a solution containing sterile water, 10 g/L of lactulose (L-7877; Sigma Chemical Company, St. Louis, Missouri, USA), 10 g/L of L-rhamnose (R-3875; Sigma Chemical Company) (rhamnose), 10 g/L of D(+) xylose (X-1500; Sigma Chemical Company) (xylose), 5 g/L of 3-O-methyl-D-glucopyranose (M-4879; Sigma Chemical Company) (methylglucose), and 40 g/L sucrose (S-9378; Sigma Chemical Company) by orogastric intubation. A baseline blood sample was obtained from each dog. After the sugar solution was administered, further blood samples were taken from the jugular vein at 30, 60, 90, 120, 180, 240, 300, 360, 420, 480, 720, and 1440 min post-administration. Serum was separated immediately by centrifugation at 3000 × g for 10 min. Serum samples were then transferred to collection tubes and stored at −80°C.
Sample preparation
Stock solutions of carbohydrate standards (1 mg/mL) were prepared in serum and stored at −20°C. Mannitol (m) (M-9546; Sigma Chemical Company) was used as an internal standard and was added at a concentration of 100 mg/L to serum samples, blank samples, and to serial 1:2 dilutions of standard solutions containing each sugar at concentrations ranging from 0.5 to 500 mg/L. Sets containing blanks, unknown samples, and standard solutions were extracted, derivatized, and analyzed in a GC-MS session as described in the following protocol.
Serum aliquots of 200 μL each were thawed and pipetted into 2-ml plastic vials. Deproteinization was achieved by adding 600 μL of methanol (EDM Chemicals, Gibbstown, New Jersey, USA) to each serum sample and mixing the sample for 20 s using a vortex mixer. Samples were then centrifuged (Centrifuge 5417C, Eppendorf, Brinkmann Instruments, Westbury, New York, USA) at 2654 × g at room temperature for 7 min, and the supernatant was transferred to a 4-mL molded screw cap glass vial (VWR International, West Chester, Pennsylvania, USA). Samples were evaporated to dryness under a stream of nitrogen in a heating module (Reacti-Therm III; Pierce, Rockford, Illinois, USA) at 64°C for 30 min. Once the tubes were cooled, the dried residue was derivatized in a two-step procedure. First, 50 μL of Mox reagent (2% of methoxyamine-HCl in pyridine) (Pierce) and 70 μL of pure pyridine (Pierce) were added to each tube. Tubes were capped, vortexed for 20 s, and subsequently heated in a microwave oven at 100% energy level (800 W) for 2 min to promote the oximation reaction (29). Then, samples were allowed to cool for 5 min and 100 μL of N,O-bis[trimethylsilyl]trifluoroacetamide (BSTFA) (Pierce) containing 1% TMCS were added to each tube. The tubes were capped, vortexed for 20 s and placed in a microwave oven at 100% energy level (800 W) for an additional 5 min to develop the silylation reaction according to the procedure described by Silva et al (29). Once the samples were cooled at room temperature, the derivatized extracts were evaporated to dryness under a nitrogen stream at 64°C for 8 min and then, the residues were dissolved in 250 μL of hexane (EDM Chemicals). GC-MS analysis was performed with 1 μL of this solution.
Gas chromatography analysis
Derivatized samples were analyzed using gas chromatography (Gas chromatograph 6890N GC; Agilent Technologies, Headquarters, Santa Clara, California, USA) coupled with a mass spectrometer (5975C MSD; Agilent Technologies). Sugars were separated using a DB-1MS capillary column (30 m length, 250 μm inner diameter, and 0.25 μm film thickness) (Agilent Technologies). The following GC column temperature program was used: the initial oven temperature was set at 100°C and held for 5 min. The temperature was then increased from 100°C to 325°C by a constant gradient of 15°C/min and held at 325°C for 5 min, resulting in a total run time of 23.33 min per sample. Helium was used as a carrier gas at a constant flow rate of 1.5 mL/min and at a velocity of 33 cm/s. Sugar identification and characterization was performed under full-scan acquisition mode within the m/z 50 to m/z 1050 range. Sugar analysis and quantification were performed in selected ion monitoring (SIM) mode using m/z 204 for lactulose (L), m/z 117 for rhamnose (R), m/z 147 for methylglucose (M), and m/z 217 for sucrose (S), xylose (X), and mannitol (m).
Kinetic analysis
Calibration curves were established by plotting the ratios of the area under the curve of the peaks of the sugars of interest to that of the internal standard for each of the different standard solutions using a polynomial curvilinear regression (y = ax2 + bx + c). Calibration curves ranged from 0.5 to 500 mg/L for each sugar with a mean r2 = 0.997. The sugar peak area ratios of unknown serum samples were then extrapolated from the calibration curves. Statistical analysis was carried out using a commercial software program (GraphPad Prism 5). Sugar concentrations at all time points were analyzed for each sugar using a Friedman test with Dunn’s multiple comparison post-test. Variation of the mean sugar concentrations of all dogs at 90, 120, and 180 min was analyzed using a Kruskal-Wallis test. Statistical significance was set at a P < 0.05.
Results
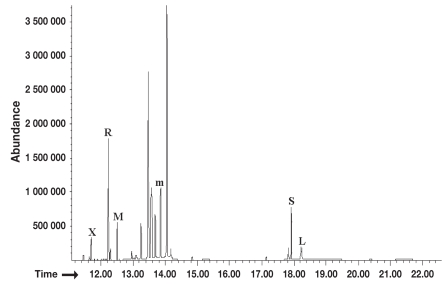
The GC-MS analysis showed good peak resolution for all sugar probes. Figure 1 depicts a representative ion chromatogram for the 5 target sugar probes spiked in pooled canine serum samples at a concentration of 125 mg/L. No overlapping peaks were observed among the 5 sugar standards (L, R, M, X, and S) and the internal standard (mannitol).
Figure 1.
Representative total ion chromatogram. This figure shows a representative ion chromatogram for the 5 target sugar probes spiked in pooled canine serum samples at a concentration of 125 mg/L. Labeled peaks indicate major peaks of xylose (X), rhamnose (R), methylglucose (M), sucrose (S), lactulose (L), and the internal standard mannitol (m).
Permeation profiles
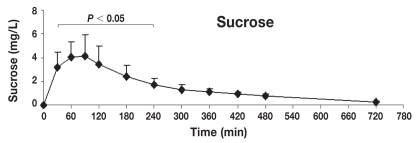
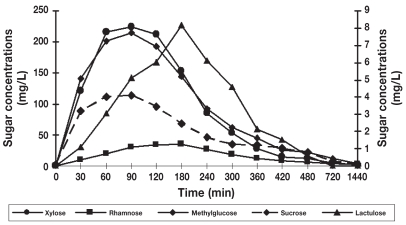
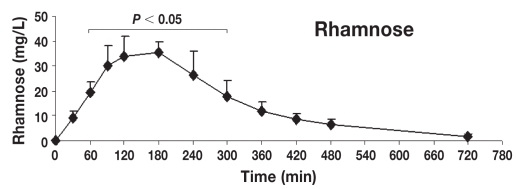
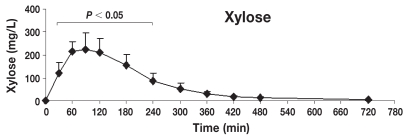
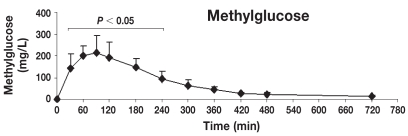
Table 1 shows the mean ± standard deviation (s) concentrations (mg/L) of lactulose, rhamnose, methylglucose, xylose, and sucrose in serum at individual time points after oral administration of the 5-sugar solution. The serum of each dog showed significant concentrations of all 5 sugars at 30 min post administration (the first sampling time). Monosaccharides (X, R, and M) reached the serum rapidly, while disaccharides (L and S) reached the serum more slowly. Quantifiable concentrations for all sugar markers were reached until the last sampling time point. Figures 2 to 6 show the mean ± s concentration profiles for each sugar in serum, while the profiles for all 5 sugars are shown in Figure 7. Significant changes in the serum concentrations of all 5 sugars were detected after administration of the test dose (P < 0.0001 for all 5 probes). Serum concentrations of lactulose and rhamnose were significantly different from the baseline at 90, 120, 180, 240 min, and at 60, 90, 120, 180, 240, and 300 min post-dosing, respectively; those of xylose, methylglucose, and sucrose were significantly different from the baseline at 30, 60, 90, 120, 180, and 240 min post-dosing (P < 0.05 for all 5 probes). Maximum concentrations of lactulose (Figure 2) and rhamnose (Figure 3) were obtained at 180 min (mean ± s: 8.2 ± 4.9 and 35.6 ± 4.0 mg/L, respectively) followed by a gradual decline, while xylose (Figure 4), methylglucose (Figure 5), and sucrose (Figure 6) reached their peak concentrations at 90 min post-dosing (means ± s: 224.0 ± 72.6, 214.8 ± 80.7, and 4.1 ± 1.7 mg/L, respectively) followed by a gradual decline. For all of the 5 sugar probes, no statistically significant differences were found between concentrations measured at the 90, 120, and 180 min time points or between the coefficients of variation (CV%) of the mean concentrations for those 3 time points.
Table 1.
Mean ± standard deviation (s) concentrations (mg/L) and coefficient of variation (CV) of sugar probes in serum for each time period from dogs after orogastric administration of a 5-sugar solution
| Time minutes | Xylose
|
Methylglucose
|
Rhamnose
|
Sucrose
|
Lactulose
|
||||||||||
|---|---|---|---|---|---|---|---|---|---|---|---|---|---|---|---|
| mean | s | CV% | mean | s | CV% | mean | s | CV% | mean | s | CV% | mean | s | CV% | |
| 0 | 0.0 | 0.0 | 0.0 | 0.0 | 0.0 | 0.0 | 0.0 | 0.0 | 0.0 | 0.0 | 0.0 | 0.0 | 0.0 | 0.0 | 0.0 |
| 30 | 121.4 | 51.1 | 42.1 | 140.4 | 74.1 | 52.8 | 9.1 | 2.6 | 28.7 | 3.2 | 1.3 | 40.7 | 1.1 | 0.9 | 83.1 |
| 60 | 216.1 | 43.3 | 20.1 | 201.7 | 47.5 | 23.6 | 19.5 | 4.4 | 22.7 | 4.0 | 1.3 | 33.4 | 3.1 | 1.9 | 61.6 |
| 90 | 224.0 | 77.6 | 34.7 | 214.8 | 86.2 | 40.1 | 29.9 | 8.8 | 29.5 | 4.1 | 1.8 | 44.1 | 5.1 | 3.2 | 62.0 |
| 120 | 212.4 | 62.3 | 29.3 | 193.1 | 73.1 | 37.9 | 33.9 | 8.6 | 25.2 | 3.5 | 1.6 | 45.2 | 6.0 | 3.7 | 62.0 |
| 180 | 153.2 | 50.2 | 32.8 | 144.8 | 44.2 | 30.6 | 35.6 | 4.3 | 12.0 | 2.5 | 0.9 | 38.1 | 8.2 | 4.9 | 60.0 |
| 240 | 85.5 | 35.1 | 41.1 | 91.9 | 39.9 | 43.5 | 26.5 | 10.1 | 38.3 | 1.7 | 0.5 | 31.5 | 6.1 | 3.8 | 61.8 |
| 300 | 53.7 | 26.4 | 49.2 | 61.8 | 28.1 | 45.5 | 18.0 | 6.8 | 38.0 | 1.3 | 0.5 | 36.2 | 4.6 | 3.7 | 80.8 |
| 360 | 28.4 | 12.1 | 42.5 | 44.4 | 16.1 | 36.3 | 11.9 | 4.0 | 33.5 | 1.1 | 0.3 | 29.1 | 2.1 | 3.0 | 138.6 |
| 420 | 15.1 | 8.6 | 57.1 | 26.0 | 6.6 | 25.5 | 8.5 | 2.5 | 29.3 | 0.9 | 0.2 | 20.0 | 1.5 | 2.7 | 175.1 |
| 480 | 11.5 | 5.1 | 44.6 | 22.0 | 8.5 | 38.8 | 6.6 | 2.5 | 37.5 | 0.8 | 0.2 | 22.2 | 0.6 | 1.2 | 220.3 |
| 720 | 4.3 | 1.2 | 28.0 | 12.4 | 5.7 | 45.7 | 3.7 | 1.2 | 34.0 | 0.2 | 0.1 | 36.7 | 0.0 | 0.0 | 0.0 |
| 1440 | 2.9 | 0.7 | 23.5 | 3.8 | 1.4 | 37.4 | 2.1 | 0.2 | 10.7 | 0.1 | 0.0 | 37.9 | 0.0 | 0.0 | 0.0 |
Figure 2.
Concentration-time profile of lactulose [mean ± standard deviation (s)]. This figure shows the changes of lactulose concentrations in serum after orogastric administration in healthy dogs (n = 8). Serum concentrations of lactulose were significantly different from baseline at 90, 120, 180, 240 min post-dosing (P < 0.05), reaching the maximum peak concentration at 180 min post-dosing (mean ± s: 8.2 ± 4.9 mg/L).
Figure 6.
Concentration-time profile of sucrose [mean ± standard deviation (s)]. This figure shows the changes of sucrose concentrations in serum after orogastric administration in healthy dogs (n = 8). Serum concentrations of sucrose were significantly different from baseline at 30, 60, 90, 120, 180, and 240 min post-dosing (P < 0.05), reaching the maximum peak concentration at 90 min post-dosing (means ± s: 4.1 ± 1.7 mg/L).
Figure 7.
Serum concentration-time curves of the 5 sugars after orogastric administration. Serum concentrations of xylose, rhamnose, and methylglucose are displayed on the y-axis on the left. Serum concentrations of lactulose and sucrose are displayed on the y-axis on the right. For all 5 sugars, no significant differences were found between concentrations measured at 90, 120, and 180 min time points or between the coefficients of variation (CV%) of the mean concentrations of these 3 points.
Figure 3.
Concentration-time profile of rhamnose [mean ± standard deviation (s)]. This figure shows the changes of rhamnose concentrations in serum after orogastric administration in healthy dogs (n = 8). Serum concentrations of rhamnose were significantly different from baseline at 60, 90, 120, 180, 240, and 300 min post-dosing (P < 0.05), reaching the maximum peak concentration at 180 min post-dosing (means ± s: 35.6 ± 4.4 mg/L).
Figure 4.
Concentration-time profile of xylose [mean ± standard deviation (s)]. This figure shows the changes of xylose concentrations in serum after orogastric administration in healthy dogs (n = 8). Serum concentrations of xylose were significantly different from baseline at 30, 60, 90, 180, and 240 min post-dosing (P < 0.05), reaching the maximum peak concentration at 90 min post-dosing (means ± s: 224.0 ± 72.6 mg/L).
Figure 5.
Concentration-time profile of methylglucose [mean ± standard deviation (s)]. This figure shows the changes of methylglucose concentrations in serum after orogastric administration in healthy dogs (n = 8). Serum concentrations of methylglucose were significantly different from baseline at 30, 60, 90, 120, 180, and 240 min post-dosing (P < 0.05), reaching the maximum peak concentration at 90 min post-dosing (means ± s: 214.8 ± 80.7 mg/L).
Discussion
The serum kinetics for 5 sugar probes commonly used for gastrointestinal permeability and intestinal absorptive capacity testing were assessed in this study. In general, sugar profiles in serum reflected a permeation and absorption pattern based on their physical and chemical characteristics. Taking into account the molecular dimensions, the monosaccharides xylose, methyl-glucose, and rhamnose were absorbed or permeated faster, respectively, and in higher amounts than the disaccharides. Therefore, the permeation pattern of lactulose and sucrose reflected their selective size range and interaction with the gastrointestinal mucosa.
Kinetic profiles for xylose and methylglucose in serum were consistent throughout the experiment. Both sugars showed identical appearance and clearance patterns in serum after the ingestion of the sugar solution. These findings compare well with results of kinetic studies of intestinal permeability in humans using xylose and methylglucose, which showed similar kinetic characteristics in plasma (30). In the present study, the maximum serum concentrations for these sugars were reached at 90 min, and the X:M ratio with a mean ± s of 1 ± 0.09 was consistent from 30 to 240 min.
The absorption of both monosaccharides occurs by mediated transport. Xylose is actively absorbed from the proximal small intestine (duodenum and jejunum), whereas methylglucose is absorbed throughout the entire length of the small intestine. Thus, a considerable reserve capacity exists for absorption of methylglucose, but not for xylose (15). Therefore, a decrease in the X:M ratio is a more reliable indicator of decreased absorptive capacity than xylose alone (31). Xylose is impaired to a greater extent than methylglucose in cases of mucosal damage, resulting in a subsequent decrease of the plasma X:M ratio (30).
Lactulose and rhamnose permeation showed a similar kinetic pattern throughout the study. Concentrations of these sugars showed a constant increase in serum until 180 min after oral administration. Serum concentrations of both sugars showed a ratio of 0.27 ± 0.06 (mean ± s) at this sampling time point where their concentrations were significantly different from baseline.
The kinetic profiles of lactulose and rhamnose from the present study were similar to those reported in plasma from healthy dogs as previously measured by HPLC (20). These profiles suggest that both sugars diffuse through the intestinal mucosa by 2 distinct pathways with lactulose passing the intestinal mucosa through relatively large pores present at low abundance that is associated with the paracellular tight junction. Rhamnose crosses mainly through the small aqueous pores present at high abundance at the epithelial cell membrane. Intestinal disease leading to injury of the small intestinal mucosa leads to an abnormal mucosal permeability that is characterized by an increased L:R ratio (30).
Many diseases affecting the small intestinal mucosa are characterized by villous atrophy, which may lead to a reduced mucosal surface area for the diffusion of rhamnose, allowing an increased diffusion of lactulose in the crypt region due to a wide availability of large pores accompanying the mucosal damage. Serum L:R ratios were used to distinguish between subjects with villous atrophy and those with normal biopsies at 60, 90, and 120 min post-ingestion in humans (32).
In regard to sucrose, this sugar was observed in small concentrations in serum. Under normal circumstances, ingested sucrose is rapidly hydrolyzed in the proximal small intestine by the enzyme sucrase into glucose and fructose. The normal gastric mucosa only allows a small quantity of sucrose to be absorbed before it is exposed to sucrase activity in the small intestine. During studies in animal models to identify site specific gastrointestinal permeability, sucrose could never be found beyond the stomach after rats received a gavage of mixed sugar solutions containing sucrose (33). An increase in gastric mucosal permeability to sucrose in NSAID gastropathy has been shown in humans (34).
Reports of gut permeability to inert sugars in animal models (rabbits and mice) have shown an appropriate timepoint for measurement of lactulose to be at 180 min post-dosing, whereas, an appropriate timepoint for rhamnose was shown to be at 120 min in serum post-dosing (35). These values fall into the range obtained from dogs in this study. The sucrose kinetic pattern observed in the present study showed a significant statistical difference of serum sucrose concentrations from the baseline at 30, 60, 90, 120, 180, and 240 min post-administration. This kinetic pattern closely resembles that reported for serum sucrose in human beings. Those studies showed that, in humans, gastroduodenal injury can be detected using serum at any determined point between 30 and 300 min (36).
In conclusion, after orogastric administration of a sugar solution containing lactulose, rhamnose, xylose, methylglucose, and sucrose, serum concentrations could be detected in all dogs 30 min after administration. While the peaks of serum concentrations differed for the 5 sugar probes, there was no significant difference in serum concentrations between the 90 to 180 min timed blood sampling periods. Thus, it may be feasible to detect gastrointestinal injury (reflected by alterations in permeability and absorptive capacity) by collecting a baseline sample and a 90 to 180 min post-administration sample.
Footnotes
Presented, in part, at the 25th Annual Forum of the American College of Veterinary Internal Medicine, Seattle, Washington, USA in June 2007.
References
- 1.Bjarnason I, MacPherson A, Hollander D. Intestinal permeability: An overview. Gastroenterology. 1995;108:1566–1581. doi: 10.1016/0016-5085(95)90708-4. [DOI] [PubMed] [Google Scholar]
- 2.Tibble JA, Bjarnason I. Non-invasive investigation of inflammatory bowel disease. World J Gastroenterol. 2001;7:460–465. doi: 10.3748/wjg.v7.i4.460. [DOI] [PMC free article] [PubMed] [Google Scholar]
- 3.Daugherty AL, Mrsny R. Transcellular uptake mechanisms of the intestinal epithelial barrier: Part one. Pharm Sci Technol Today. 1999;4:144–151. doi: 10.1016/s1461-5347(99)00142-x. [DOI] [PubMed] [Google Scholar]
- 4.Kararli TT. Comparison of the gastrointestinal anatomy, physiology, and biochemistry of humans and commonly used laboratory animals. Biopharm Drug Dispos. 1995;16:351–380. doi: 10.1002/bdd.2510160502. [DOI] [PubMed] [Google Scholar]
- 5.Unno N, Fink MP. Intestinal epithelial hyperpermeability. Mechanisms and relevance to disease. Gastro Clin N Am. 1998;27:289–307. doi: 10.1016/s0889-8553(05)70004-2. [DOI] [PubMed] [Google Scholar]
- 6.Madara JL, Pappenhaimer JR. Structural basis for physiological regulation of paracellular pathways in intestinal epithelia. J Membr Biol. 1987;100:149–164. doi: 10.1007/BF02209147. [DOI] [PubMed] [Google Scholar]
- 7.Melichar B, Dvoøák J, Hyšpler R, et al. Intestinal permeability in the assessment of intestinal toxicity of cytotoxic agents. Chemotheraphy. 2005;51:336–338. doi: 10.1159/000088957. [DOI] [PubMed] [Google Scholar]
- 8.Arrieta MC, Bistritz L, Meddings JB. Alterations in intestinal permeability. Gut. 2006;55:1512–1520. doi: 10.1136/gut.2005.085373. [DOI] [PMC free article] [PubMed] [Google Scholar]
- 9.Rouge N, Buri P, Doelker E. Drug absorption sites in the gastrointestinal tract and dosage forms for site specific delivery. Int J Pharm. 1996;136:117–139. [Google Scholar]
- 10.Celli M, D’Eufemia P, Dommarco R, et al. Rapid gas-chromatographic assay of lactulose and mannitol for estimating intestinal permeability. Clin Chem. 1995;41:752–756. [PubMed] [Google Scholar]
- 11.Cave NJ. Chronic inflammatory disorders of the gastrointestinal tract of companion animals. NZ Vet Journal. 2003;51:262–274. doi: 10.1080/00480169.2003.36380. [DOI] [PubMed] [Google Scholar]
- 12.Bjarnason I. Intestinal permeability. Gut. 1994;35 (Suppl 1):S18–S22. doi: 10.1136/gut.35.1_suppl.s18. [DOI] [PMC free article] [PubMed] [Google Scholar]
- 13.Fink MP. Interpreting dual-sugar absorption studies in critically ill patients: What are the implications of apparent increases in intestinal permeability to hydrophilic solutes? [editorial; comment] Intens Care Med. 1997;23:489–492. doi: 10.1007/s001340050363. [DOI] [PubMed] [Google Scholar]
- 14.Travis S, Menzies I. Intestinal permeability: Functional assessment and significance. Clin Sci. 1992;82:471–488. doi: 10.1042/cs0820471. [DOI] [PubMed] [Google Scholar]
- 15.Johnston JD, Harvey CJ, Menzies IS, et al. Gastrointestinal permeability and absorptive capacity in sepsis. Crit Care Med. 1996;24:1144–1149. doi: 10.1097/00003246-199607000-00013. [DOI] [PubMed] [Google Scholar]
- 16.Meddings JB, Sutherland LR, Byles NI, et al. Sucrose: A novel permeability marker for gastroduodenal disease. Gastroenterology. 1993;104:1619–1626. doi: 10.1016/0016-5085(93)90637-r. [DOI] [PubMed] [Google Scholar]
- 17.Steiner JM, Williams DA, Moeller EM. Kinetics of urinary recovery of five sugars after orogastric administration in healthy dogs. Am J Vet Res. 2002;63:845–848. doi: 10.2460/ajvr.2002.63.845. [DOI] [PubMed] [Google Scholar]
- 18.Steiner JM, Williams DA, Moeller EM. Development and validation of a method for simultaneous separation and quantification of 5 different sugars in canine urine. Can J Vet Res. 2000;64:164–170. [PMC free article] [PubMed] [Google Scholar]
- 19.Cox MA, Iqbal TH, Cooper BT, et al. An analytical method for the quantitation of mannitol and disaccharides in serum: A potentially useful technique in measuring small intestinal permeability in vivo. Clin Chim Acta. 1997;263:179–205. doi: 10.1016/s0009-8981(97)00058-2. [DOI] [PubMed] [Google Scholar]
- 20.Sørensen SH, Proud FJ, Rutgers HC, et al. A blood test for intestinal permeability and function: A new tool for the diagnosis of chronic intestinal disease in dogs. Clin Chim Acta. 1997;264:103–115. doi: 10.1016/s0009-8981(97)00077-6. [DOI] [PubMed] [Google Scholar]
- 21.Vinet B, Panzini B, Boucher M, et al. Automated enzymatic assay for the determination of sucrose in serum and urine and its use as a marker of gastric damage. Clin Chem. 1998;44:2369–2371. [PubMed] [Google Scholar]
- 22.Hewetson M, Cohen ND, Love S, et al. Sucrose concentration in blood: A new method for assessment of gastric permeability in horses with gastric ulceration. J Vet Int Med. 2006;20:388–394. doi: 10.1892/0891-6640(2006)20[388:sciban]2.0.co;2. [DOI] [PubMed] [Google Scholar]
- 23.Sharpstone D, Neild P, Crane R, et al. Small intestinal transit, absorption, and permeability in patients with AIDS with and without diarrhoea. Gut. 1999;45:70–76. doi: 10.1136/gut.45.1.70. [DOI] [PMC free article] [PubMed] [Google Scholar]
- 24.Rodríguez H, Suchodolski J, Berghoff N, et al. Development and analytic validation of a gas chromatography-mass spectrometry method for the measurement of sugar probes in canine serum. Am J Vet Res. 2009;70:320–329. doi: 10.2460/ajvr.70.3.320. [DOI] [PubMed] [Google Scholar]
- 25.Elwood P, Reid W, Marcell PD, et al. Determination of the carbohydrates composition of mammalian glycoproteins by capillary gas chromatography/mass spectrum. Anal Biochem. 1988;75:202–211. doi: 10.1016/0003-2697(88)90379-x. [DOI] [PubMed] [Google Scholar]
- 26.Feigenberg Z, Levavi H, Abramovici A. Effect of a hyperosmolar solution on the small intestine of a newborn rats: Irreversible damage and overgrowth of bacteria. Pediatr Surg Int. 1993;8:488–490. [Google Scholar]
- 27.Uil JJ, van Elburg RM, Janssens PMW, et al. Sensitivity of a hyperosmolar or “low”-osmolar test solution for sugar absorption in recognizing small intestinal mucosal damage in coeliac disease. Digest Liver Dis. 2000;32:195–200. doi: 10.1016/s1590-8658(00)80820-8. [DOI] [PubMed] [Google Scholar]
- 28.Sigthorsson G, Tibble J, Hayllar J, et al. Intestinal permeability and inflammation in patients on NSAIDs. Gut. 1998;43:506–511. doi: 10.1136/gut.43.4.506. [DOI] [PMC free article] [PubMed] [Google Scholar]
- 29.Silva FO, Ferraz V. Microwave-assisted preparation of sugars and organic acids for simultaneous determination in citric fruits by gas chromatography. Food Chem. 2004;88:609–612. [Google Scholar]
- 30.Griffiths CEM, Menzies IS, Barrison IG, et al. Intestinal permeability in dermatitis herpertiformis. J Invest Dermatol. 1988;91:147–149. doi: 10.1111/1523-1747.ep12464390. [DOI] [PubMed] [Google Scholar]
- 31.Craven M, Chandler ML, Steiner JM, et al. Acute effects of carprofen and meloxicam on canine gastrointestinal permeability and mucosal absorptive capacity. J Vet Int Med. 2007;21:917–923. doi: 10.1892/0891-6640(2007)21[917:aeocam]2.0.co;2. [DOI] [PubMed] [Google Scholar]
- 32.Fleming SC, Duncan A, Russell RI, et al. Measurement of sugar probes in serum: An alternative to urine measurement in intestinal permeability testing. Clin Chem. 1996;42:445–448. [PubMed] [Google Scholar]
- 33.Meddings JB, Gibbons I. Discrimination of site-specific alterations in gastrointestinal permeability in the rat. Gastroenterology. 1998;114:83–92. doi: 10.1016/s0016-5085(98)70636-5. [DOI] [PubMed] [Google Scholar]
- 34.Smecuol E, Bai JC, Sugai E, et al. Acute gastrointestinal permeability responses to different non-steroidal anti-inflammatory drugs. Gut. 2001;49:650–655. doi: 10.1136/gut.49.5.650. [DOI] [PMC free article] [PubMed] [Google Scholar]
- 35.Katousian F, Sblattero D, Not T, et al. Dual sugar-permeability testing in blood drop in animal models. Clin Chim Acta. 2005;352:191–197. doi: 10.1016/j.cccn.2004.09.023. [DOI] [PubMed] [Google Scholar]
- 36.Shishido T, Yamaguchi T, Odaka T, et al. Significance of a novel sucrose permeability test using serum in the diagnosis of early gastric cancer. World J Gastroenterol. 2005;11:6905–6909. doi: 10.3748/wjg.v11.i44.6905. [DOI] [PMC free article] [PubMed] [Google Scholar]


