Abstract
Purpose
To develop a method for automatically triggering centric data acquisition during contrast-enhanced whole-heart coronary MRA.
Materials and Methods
The hypothesis of this work is that the blood signal changes during contrast infusion can be estimated by obtaining a projection of the heart during inversion-recovery prepared data acquisition. A validation study was performed on 7 healthy volunteers to test this hypothesis. The peak blood signal enhancement detected from the projection was then used to automatically trigger the start of central k-space data acquisition. Simulations were performed to compare the SNR of the proposed self-triggering method with the fixed delay method. 6 healthy volunteers were scanned on a 3T MR system using the proposed self-triggered method to test its effectiveness on coronary artery visualization.
Results
Based on the validation study, the self-triggering method provides an accurate representation of the contrast enhancement. Based on the simulations, self-triggering with centric ordering is expected to give a 27% higher SNR than linear ordering with a fixed imaging delay. Self-triggering was successfully used in all volunteers and showed excellent depiction of the major coronary arteries.
Conclusion
The self-triggering method can be used to automatically determine the optimal delay time for central k-space acquisition, for each individual subject, without the need of any extra setup or user interaction.
Keywords: magnetic resonance angiography, coronary arteries, automatic triggering, slow infusion, contrast agent
INTRODUCTION
Contrast-enhanced whole-heart coronary magnetic resonance angiography (MRA) at 3T with slow infusion of contrast agent has recently been proposed (1). An inversion-recovery prepared spoiled gradient-echo sequence, which is relatively insensitive to the increased field inhomogeneities at 3T, was employed. A recent comparison study has shown that contrast-enhanced coronary MRA at 3T provides higher coronary artery contrast-to-noise ratio (CNR), better vessel depiction, and shorter imaging time than the steady-state free precession (SSFP) approach at 1.5T (2). A preliminary clinical study has shown that 3T contrast-enhanced coronary MRA is a promising method for detecting coronary artery disease in patients (3). All of these studies used slow infusion (0.3 cc/sec) of a high relaxivity contrast agent, gadobenate dimeglumine ([Gd-BOPTA]2−, Multihance, Bracco Diagnostics Inc., Princeton, NJ, USA) to provide prolonged signal enhancement to accommodate the long imaging time associated with free breathing whole-heart acquisition. An empirical delay time between contrast injection and data acquisition and a linear ordering scheme, in which the central partition encoding plane of the 3D k-space is acquired in the middle of the data acquisition period, were employed. To maximize coronary artery signal-to-noise ratio (SNR), central k-space data acquisition needs to occur during peak blood signal enhancement. However, contrast dynamics are patient dependent due to parameters such as cardiac output, age, heart rate, and severity of the vascular disease(4), which could result in sub-optimal SNR if the central k-space region is not acquired during peak blood signal enhancement.
MR Smartprep (4) and fluoroscopic triggering (5) have been proposed for real-time tracking and detection of contrast agent arrival in the anatomy of interest. These methods were primarily developed for first-pass MRA and require a separate tracking pulse sequence prior to the high-resolution imaging sequence. The contrast agent arrival is detected by the tracking sequence, which is used to trigger the start of the high-resolution imaging sequence. Due to the slow blood signal change during slow contrast infusion, for fluoroscopic triggering, it is difficult to visually determine the peak enhancement. MR Smartprep requires placing a region of interest for blood signal detection, complicating the imaging procedure.
In this work, we propose a new method for real-time triggering of data acquisition during slow infusion of contrast agent. The triggering signal is embedded in the high-resolution coronary MRA sequence and is obtained by acquiring a single central k-space line in each heartbeat. A validation study was first performed to confirm whether the proposed self-triggering method matches the true contrast dynamics. Computer simulations were performed to compare image SNR between the proposed self-triggering approach and the fixed-delay method (1,2). Healthy volunteers were imaged using the proposed self-triggered contrast-enhanced whole-heart coronary MRA sequence. A conventional contrast agent, gadopentetate dimeglumine (Gd-DTPA, Magnevist, Schering AG, Berlin, Germany) was used to demonstrate the effectiveness of the self-triggering approach.
MATERIALS AND METHODS
All studies were performed on a 3T Trio scanner (Siemens Medical Solutions, Erlangen, Germany). A twelve-element matrix coil (six anterior and six posterior) was used for data acquisition. Written consent was obtained from volunteers in compliance with the Institutional Review Board of our institution. All computer simulations were performed in the Matlab environment (Mathworks, Natick, MA, USA).
Self-Tracking of Contrast Dynamics Using a Single Central k-space Line
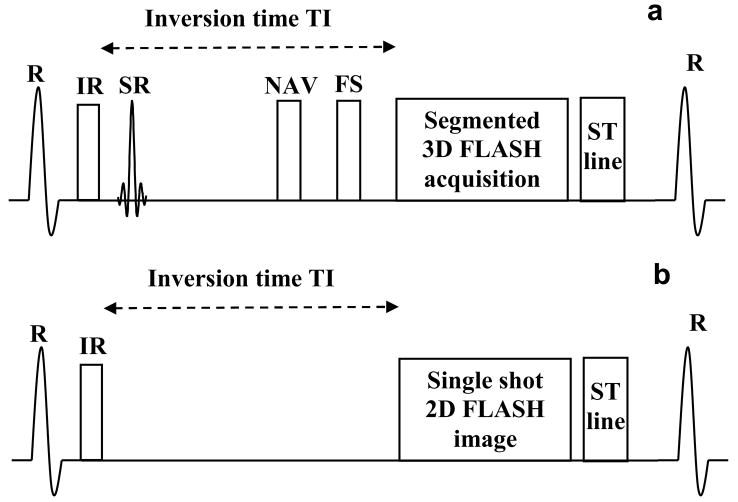
A schematic of the proposed pulse sequence for self-triggered contrast-enhanced wholeheart coronary MRA is shown in Fig 1a. It is an inversion-recovery (IR) prepared, fat saturated (FS), ECG-triggered, navigator-gated, and segmented (along the phase-encoding direction), Fast Low Angle SHot (FLASH) sequence. The 3D k-space data was collected with centric ordering in both the phase- and partition-encoding directions.
Figure 1.
Schematic of the pulse sequences used. 1a: Inversion Recovery (IR) prepared, fat saturated (FS), ECG triggered, navigator (NAV) gated, segmented 3D FLASH sequence, followed by the self–triggering signal, used for real-time triggered contrast-enhanced whole-heart coronary MRA. SR stands for the selective reinversion pulse which is used to restore the magnetization for the navigator echo. 1b: Inversion Recovery (IR) prepared, single-shot 2D FLASH sequence followed by the self-triggering signal, used for the validation study.
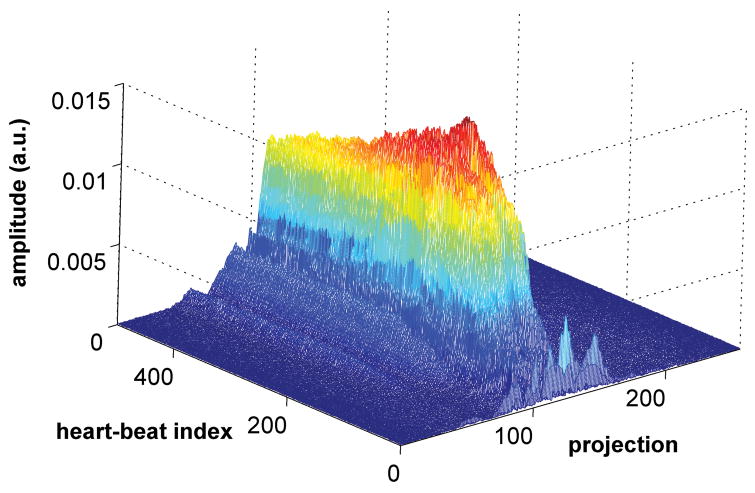
Due to the low contrast injection rate (0.3 cc/sec), the blood signal changes relatively slowly and the blood signal dynamics in the 4 heart chambers are similar. As a result, the blood signal dynamics can be estimated by the average signal in the heart, measured by collecting a central k-space line (phase and partition encoding gradients turned off) and Fourier-transforming it to obtain a one-dimensional projection of the heart. Since the sequence is inversion recovery prepared, the background is mostly suppressed, and the projection mainly contains signal from the blood in the heart. Fig. 2 shows the changes in the projection during slow infusion of contrast agent over a period of 500 heart-beats. The magnitude of the projection increases, reaches a peak and then decays, similar to the expected contrast dynamics. The hypothesis of this work is that the projection can be used to estimate the true contrast dynamics. The projection is called the self-triggering (ST) signal, similar to the self gating signal proposed for motion correction (6).
Figure 2.
Magnitude of the projection during slow infusion of contrast agent over a period of 500 heart-beats. The magnitude increases, reaches a peak and then decays, similar to the expected contrast dynamics.
Contrast Dynamics Validation
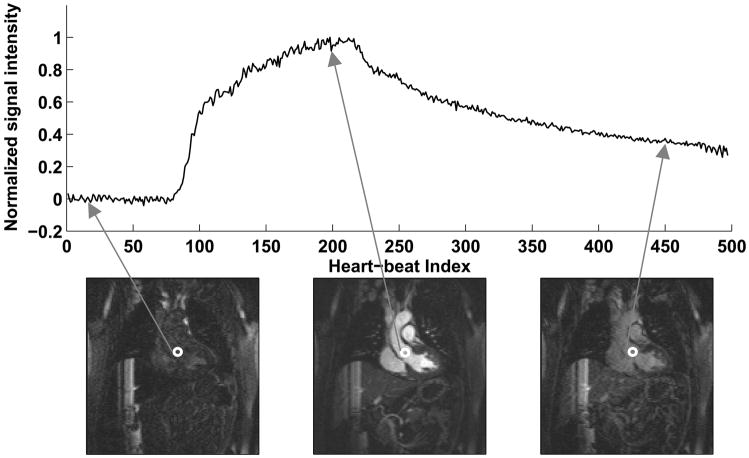
A validation study was performed on 7 healthy volunteers (6 male and 1 female, average age 43 ± 14 years) to test whether the contrast enhancement curve predicted by the ST signal matched the true blood signal changes. The pulse sequence used for the validation is shown in Fig. 1b. A single-shot 2D FLASH image in the coronal plane was acquired in each heart-beat using ECG triggering and inversion recovery preparation. Parameters for the sequence were: TR = 3.5 msec, TE = 1.7 msec, matrix = 90 × 128, Generalized Autocalibrating Partially Parallel Acquisition (GRAPPA) (7) acceleration factor = 3, flip angle = 20°, slice thickness = 5 mm, inversion time (TI) = 200 msec. To minimize the effects of cardiac and respiratory motion, data was acquired in mid-diastole in a window of 161 msec. The trigger delay was set up using a 4-chamber cine scan to identify the window of minimal cardiac motion. The imaging parameters were chosen to closely match those of the 3D acquisition, so that the contrast dynamics would be similar in both the cases. The single-shot coronal image was followed by the ST signal. The above sequence structure (Fig. 1b) was repeated for 500 heart-beats during contrast injection at a rate of 0.3 cc/sec. In the coronal image, an ROI was placed in the aorta, near the root of the coronary arteries and the signal intensity was measured in each of the 500 images to get the true contrast enhancement curve. Fig. 3 shows representative single-shot images and the true contrast curve obtained from a healthy volunteer. The three images shown are during no enhancement, peak enhancement and post peak enhancement stages. The hypothesis of this work was that the contrast enhancement curve obtained from the self-triggering signal is a good approximation to the true contrast enhancement curve.
Figure 3.
Representative single-shot images and the true contrast curve obtained in a healthy volunteer. The three images shown are during no enhancement, peak enhancement and post peak enhancement stages.
Self-Triggering of Data Acquisition
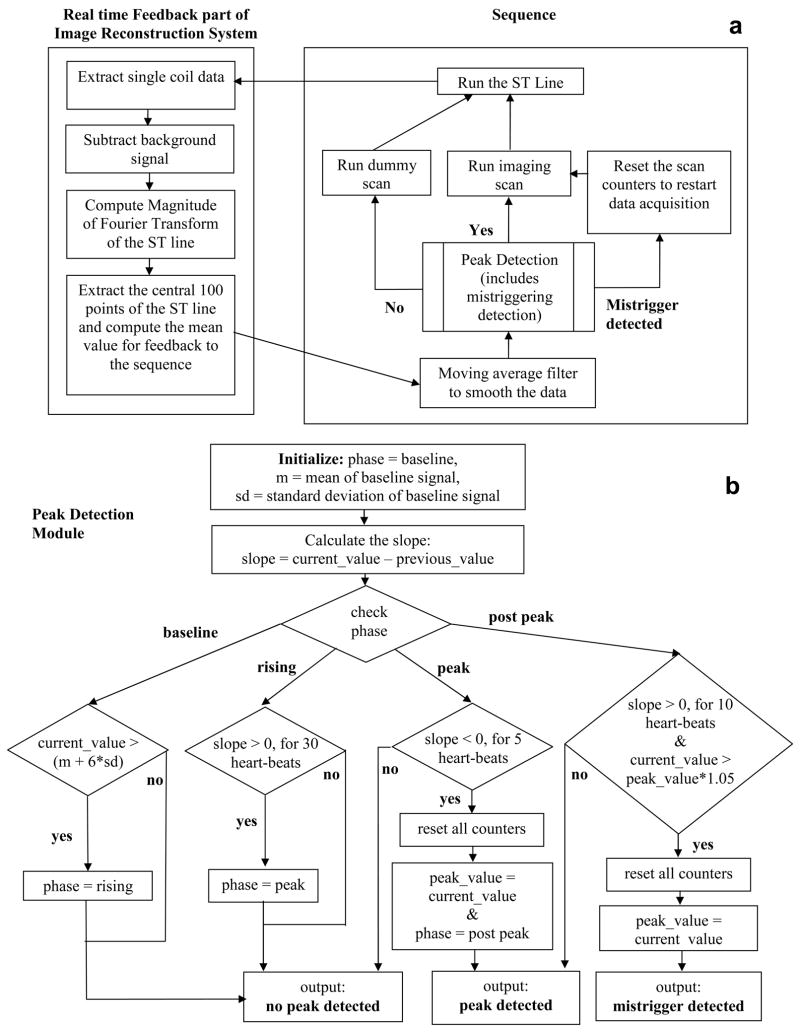
As shown in Fig. 1, the sequence was modified to acquire the ST signal in each heart-beat after all the segments were acquired. The ST signal was acquired after the segments in order to minimize signal variations due to heart-rate changes, since at the end of the data acquisition window the magnetization is close to its steady-state value. A schematic of the pulse sequence and real-time feedback part of the image reconstruction system is shown in Fig 4a. After the ST signal is played out by the sequence, the image reconstruction system extracts data from a single anterior coil closest to the heart. This is followed by complex subtraction of the background signal, which is estimated as the mean of the signal in the first 20 heart-beats (the first 3 heartbeats are ignored for reaching steady state). The magnitude of the Fourier transform is then computed and the central 100 points (representing the region of the heart) are averaged for feedback to the sequence.
Figure 4.
Flowchart showing the self-triggered, contrast-enhanced, whole-heart coronary MRA sequence. 4a: pulse sequence and real-time feedback part of the image reconstruction system, 4b: peak detection module.
The sequence part starts with a moving average filter, which averages the current data point with the previous 19 data points in order to filter out noise from the ST signal. This is followed by the peak detection module, whose parameters were empirically determined based on the contrast enhancement curves obtained from the validation studies. The peak detection module can have three outputs: no peak detected, peak detected or mistrigger detected. When no peak is detected, the sequence plays dummy cycles and continues to track the signal. When the peak is detected, the sequence plays the actual imaging scans. After the peak is detected, signal tracking continues. At a later point if the triggering point is detected to be false trigger (due to noise, respiratory motion or any other reason) then the mistrigger detected output is given. This resets the scan counters and restarts image acquisition. In this manner the central k-space region is acquired during the true peak signal enhancement.
A schematic of the peak detection module is shown in Fig. 4b. Peak detection is based on the slope of the contrast curve, which is computed as the difference between current and previous signal values. The first 20 heart-beats are used to compute the mean and standard deviation of the ST signal. The peak detection is divided into 4 phases: baseline, rising, peak and post peak. The initial phase is the baseline phase. The baseline phase changes to the rising phase when the current signal exceeds the mean plus 6 times the standard deviation of the background, implying that the signal has started increasing as the contrast agent arrives in the heart. The rising phase changes to the peak phase after the slope increases for 30 heart-beats. The peak phase lasts till the slope decreases for 5 heart-beats. At this point the peak is assumed to be reached. The phase changes to the post peak phase and the peak detected output is given. In the post peak stage, if the slope again increases for 10 heart-beats and the current signal value is 5% greater than the signal value at the previous triggering point, a mistrigger detected output is given and the image acquisition is restarted.
Simulations
Simulations were performed to compare the proposed self-triggering method and the fixed delay approach. The two techniques were compared in terms of image SNR. The true contrast enhancement curves obtained from the single-shot images were used for the simulations. A fixed delay of 1 minute prior to the acquisition was used for the linear ordering approach (2). The self-triggering approach was assumed to start acquisition at peak signal enhancement. Analysis was separately performed for each of the 7 true contrast enhancement curves measured in the healthy volunteers. For each case the total imaging time was varied between 5 and 10 minutes to cover a range of practically observed imaging times. A simulated image consisting of a rectangle of width 3 pixels was used to represent a normal human coronary artery with a diameter of approximately 3 mm (8,9). The image was first Fourier transformed to get the k-space representation. The contrast modulation curve was then applied along the direction of the width of the rectangle. The result was transformed back to the image domain and Gaussian noise was added. SNR was computed as the ratio of mean value of signal (measured in the rectangle) to the standard deviation of noise (measured in the background).
Volunteer Studies
6 healthy volunteers (4 male and 2 female, average age 30.8 ± 11.5 years) were scanned using the self-triggered coronary MRA sequence shown in Figs. 1 and 2. A four chamber cine scan was used to determine the quiescent period for coronary artery imaging (10). Navigator pulses were placed on the dome of the right hemidiaphragm with a ± 3 mm acceptance window. Prospective real-time adaptive motion correction was applied with a correction factor of 0.6 in the superior–inferior direction (11). Sequence parameters were: TR = 3.2 msec, TE = 1.6 msec, flip angle = 20°, lines per heartbeat = 26–37 (data acquisition window of 83–118 msec), readout bandwidth = 698 Hz/pixel, GRAPPA acceleration factor in phase encoding direction = 2. An inversion time (TI) of 200 msec was selected based on simulations which showed that it gave the highest and most prolonged blood-myocardium contrast within 10 minutes after contrast injection. The blood and myocardial T1 values used for the simulations were measured during slow infusion of 0.2 mmol/kg of Gd-DTPA. This TI value has also been used in previous slow infusion studies (1,2) and consistently resulted in excellent blood-myocardium CNR and blood SNR. 56 to 60 slices were acquired and interpolated to 112 to 120 slices of 1 mm thickness. The voxel size was 1.0 × (1.1 – 1.2) × 2.0 mm3, interpolated to 0.5 × (0.55 – 0.6) × 1 mm3. 0.2 mmol/kg body weight of Gd-DTPA was injected at a rate of 0.3 cc/sec followed by 20 cc saline at the same rate. The injection was started after the first 23 heat-beats, 3 to reach steady state and 20 to calculate the background signal statistics. One of the volunteers was rescanned in a separate session using the linear ordering approach with a fixed delay of 60 seconds (2). Whole-heart coronary MR images were reformatted using the CoronaViz software (Siemens Corporate Research, Princeton, NJ, USA) to project multiple vessel branches onto a single image (12).
RESULTS
Validation
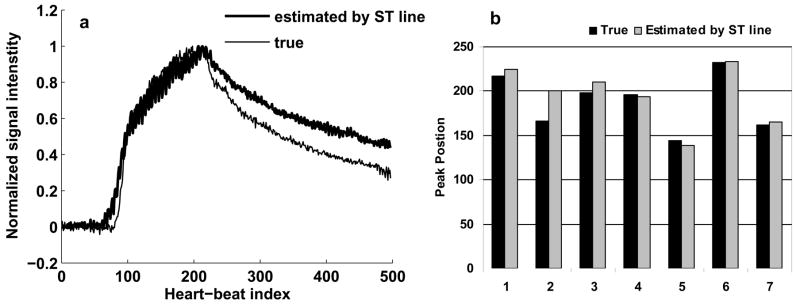
Fig. 5a shows the true contrast curve obtained from the single-shot images (thin) and the contrast curve estimated by the ST signal (thick) for a volunteer. The 2 curves are well matched during the rising phase and at the peak. After the peak, the 2 curves tend to deviate, with the estimated curve slightly overestimating the true curve. This trend was observed in all the validation studies and could possibly be explained by the fact that the contrast agent leaks out of the vasculature. As a result, the projection, in addition to the signal from the blood chambers of the heart, starts seeing signal from the myocardium. This is not a problem for triggering since the peak positions are still closely matched. Fig. 5b shows the peak positions for the true and estimated contrast curves in the 7 volunteers. The peak positions are close to each other and there was no statistically significant difference between them (p value > 0.01 based on a paired t-test). The mean correlation between the true and estimated curves was 0.9 ± 0.07 and the normalized error between them was 13.1 ± 7.9 %. Based on these results, the ST signal provides an accurate representation of the contrast enhancement during slow infusion of contrast agent and can reliably be used for triggering a centric ordered coronary MRA sequence based on peak contrast enhancement.
Figure 5.
Results of the validation study. 5a: true contrast curve from the single-shot images (thin) and the contrast curve estimated by the ST signal (thick) for a volunteer, 5b: peak positions for the true and estimated contrast curves in the 7 volunteers. The two curves are well matched and differences between the peak positions were not statistically significant.
Simulations
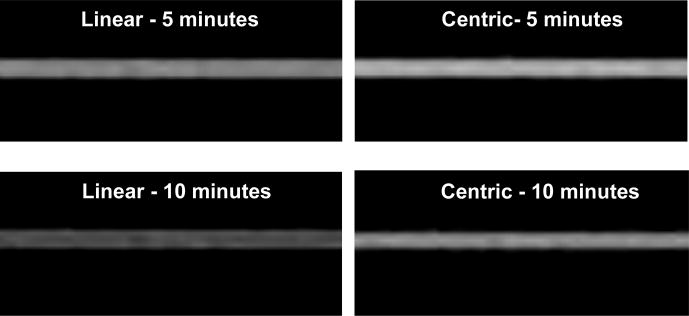
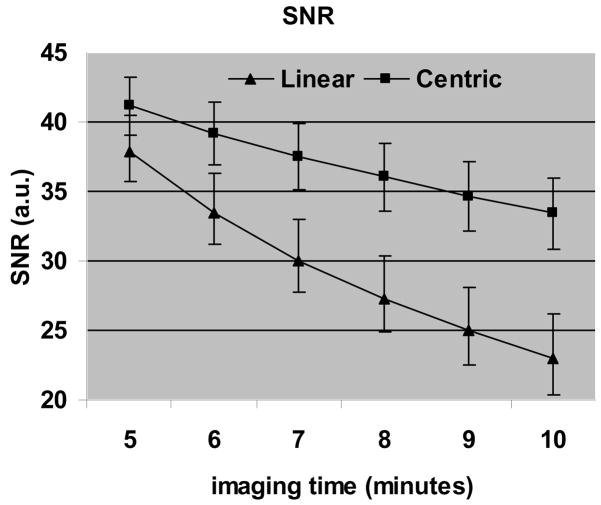
Fig. 6 shows the simulated images using the true contrast curve measured in a volunteer using both centric and linear ordering. For imaging time of 10 minutes centric ordering results in a significant increase in SNR. Fig. 7 shows a plot of SNR vs imaging time, averaged over all the volunteers. SNR for centric ordering is always higher than that for linear ordering. For both techniques the SNR reduces as the imaging time increases, but the drop is more severe for linear ordering. The SNR for centric ordering is 9% higher for an imaging time of 5 minutes, but this difference increases to 45% as the imaging time increases to 10 minutes. The mean SNR for centric ordering was 37 ± 5, compared to 29 ± 6 for linear ordering. The difference between the SNR’s was statistically significant (p value < 0.01 based on a paired t-test). On an average, the centric ordering approach is expected to give a 27% higher SNR than the linear ordering approach.
Figure 6.
Simulated images using the true contrast curve measured in a volunteer using both, centric and linear ordering. For imaging time of 10 minutes centric ordering results in a significant increase in SNR.
Figure 7.
Results of the simulation study showing SNR vs imaging time averaged over all the volunteers. The difference between the SNR’s was statistically significant, and, on an average, the centric ordering approach is expected to give a 27% higher SNR than the linear ordering approach.
Based on these simulations, centric ordering is expected to give a significantly higher SNR than linear ordering. Also, for both approaches, in order to maximize SNR, it is beneficial to keep the imaging time as short as possible.
Volunteer Studies
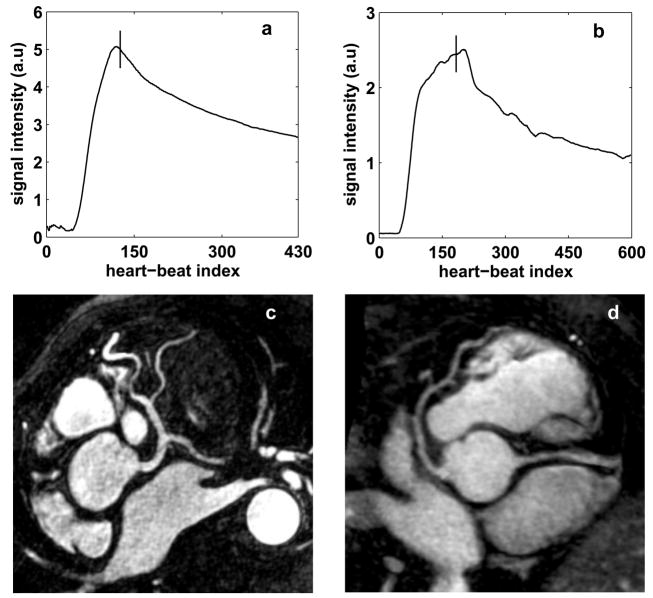
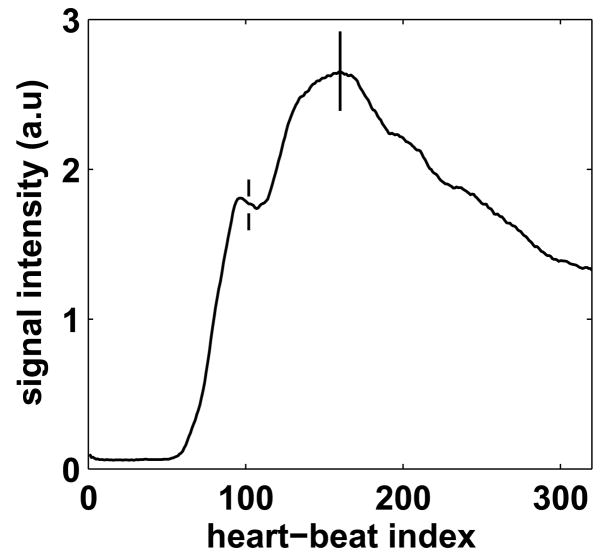
Self-triggering was successful in all 6 volunteers. The mean imaging time was 7 ± 2.7 minutes with a mean navigator efficiency of 46.7 ± 10.9 %. Fig 8 shows the contrast curve estimated by the ST signal (8a and 8b) and the corresponding coronary artery images (8c and 8d) for 2 of the volunteers. The trigger point is shown as the vertical solid line in Figs. 8a and 8b. For both the cases, the sequence was triggered during peak blood signal enhancement. Fig. 8c shows the left coronary system of a volunteer. The left main, left anterior descending (LAD), circumflex and diagonal branches are clearly visualized. Fig. 8d shows the LAD and the proximal right coronary artery (RCA) for another volunteer. Excellent depiction of the coronary arteries is seen in both images. Fig. 9 shows the effect of mistrigger correction in a volunteer. The false trigger point is shown as the dotted line and true trigger point is shown as the solid line. Mistrigger correction ensures that the central k-space region is acquired during true peak signal enhancement.
Figure 8.
Results of the volunteer studies. Self-triggering signal with trigger point (8a and 8b) and reformatted images showing the left coronary system (8c) and the LAD and proximal RCA (8d) for 2 volunteers. For both the cases, the sequence was triggered during peak blood signal enhancement.
Figure 9.
Effect of mistrigger correction: dotted line is the false trigger point and solid line is the true trigger point. Mistrigger correction ensures that the central k-space region is acquired during the true peak blood signal enhancement.
Fig. 10 shows the LAD (10a and 10b) and distal RCA (10c and 10d), in another volunteer using linear ordering (10a and 10c) and centric ordering with self-triggering (10b and 10d). The improved coronary delineation in the triggered images is easily appreciable.
Figure 10.
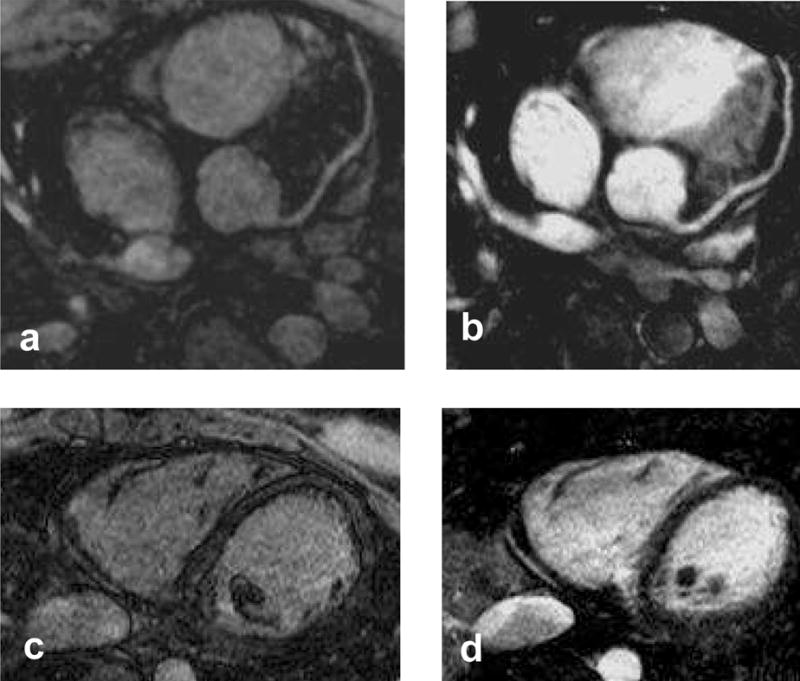
Comparison between linear (10a and 10c) and centric (10b and 10d) ordering for a volunteer, showing the LAD (10a and 10b) and the distal RCA (10c and 10d). Markedly improved coronary artery delineation is seen in the triggered images with centric ordering.
DISCUSSION
In this work, a new method of self-triggering contrast-enhanced whole-heart coronary MRA during slow contrast infusion is described and validated. Methods such as MR Smartprep (4) and fluoroscopic triggering (5) have been proposed for real-time triggering of contrast-enhanced MRA. The fluoroscopy method pre-loads the high resolution 3D imaging sequence on the scanner and acquires 2D real-time images with a temporal resolution of approximately one image per second to monitor the blood signal changes. When the operator sees the contrast agent arriving in the real-time images, the high resolution imaging sequence is manually started. For slow infusion coronary MRA, however, the blood signal changes slowly and it is difficult to visually determine the peak enhancement based on the 2D images. MR Smartprep requires placing a region of interest for blood signal detection, complicating the imaging procedure. As opposed to these approaches, the self-triggering method estimates the contrast enhancement by acquiring a projection of the heart in every heartbeat, after all the segments have been acquired and automatically triggers the scan based on the peak signal enhancement. The tracking and triggering are embedded in the high resolution imaging sequence and do not require user interference or setup of any separate scans.
The self-triggering approach acquires the central k-space views during peak contrast enhancement, independent of factors such as contrast dose, heart rate, total imaging time etc. Also, this technique does not require empirical determination of imaging delay time (1–3). A direct comparison between the centric and linear ordering approaches is complicated by heart rate and breathing pattern variability between different imaging sessions. Nevertheless, an anecdotal study demonstrates improved SNR and coronary artery visualization with the self-triggering scheme as compared to the fixed delay method. Simulations also show an SNR gain of 27% by using the centric encoding scheme with self-triggering.
As previously described (13), centric ordering results in severe vessel distortion (including vessel widening and ringing) if the central k-space region is acquired before the contrast peak. Also, delayed acquisition of the central k-space region leads to reduced SNR. Both these factors make the timing critical. The self-triggering approach corrects for false triggering due to respiratory motion, cardiac motion, noise or any other reason and results in minimal artifacts with high SNR.
Imaging during time-varying signal intensity leads to a filtering effect in k-space. Shorter scan time results in decreased filtering and more accurate representation of the vessel (13). Based on the simulations, the SNR also decreases with increasing scan time. Thus, reducing the scan time should lead to both higher SNR and lesser filtering effects. As recently shown, shorter imaging time can be facilitated by using higher acceleration factors in conjunction with high density receive coil arrays (14–16).
Another approach to reduce the k-space filtering effect would be to design an optimal contrast injection scheme, in which the signal intensity is approximately constant during the scan. Such an approach has previously been developed for computed tomography angiography (17), using a two-phase injection protocol. The first phase uses a higher injection rate to build up the contrast agent concentration and the second phase uses a lower injection rate to maintain the concentration during the scan. Such an approach would also reduce the rising phase of the contrast enhancement curve and minimize the time spent in waiting for the contrast peak in the current protocol.
This study used a traditional contrast agent Gd-DTPA instead of the newer, higher relaxivity contrast agent Gd-BOPTA, which was used in the previous studies (1–3). Our study shows that self-triggering facilitates excellent image quality even with Gd-DTPA. If Gd-BOPTA is used in conjunction with self-triggering, the SNR will probably be even higher. Gd-BOPTA at 0.1 mmol/kg body weight has been shown to provide similar image quality to Gd-DTPA at 0.2 mmol/kg body weight for renal angiography (18). Based on this study, the self-triggering approach might make it possible to collect whole-heart images using 0.1 mmol/kg body weight of Gd-BOPTA. With the current concerns of nephrogenic systemic fibrosis (19), this would be a significant step towards contrast dosage minimization.
In conclusion, a new method to trigger the contrast-enhanced data acquisition during slow infusion of contrast agent is proposed and validated for real-time triggered contrast-enhanced whole-heart coronary MRA. The self-triggering technique allows improved SNR, and its effect on diagnostic accuracy needs to be tested on a patient population.
Acknowledgments
The authors thank Xiaoming Bi, Ph.D., Saurabh Shah, and Sven Zuehlsdorff, Ph.D. of Siemens Medical Solutions for assistance in pulse sequence programming.
Supported in part by National Institute of Health grants nos. NIBIB EB002623 and NHLBI HL38698, and Siemens Medical Solutions USA, Inc., Malvern, PA.
References
- 1.Bi X, Carr JC, Li D. Whole-heart coronary magnetic resonance angiography at 3 Tesla in 5 minutes with slow infusion of Gd-BOPTA, a high-relaxivity clinical contrast agent. Magn Reson Med. 2007;58(1):1–7. doi: 10.1002/mrm.21224. [DOI] [PubMed] [Google Scholar]
- 2.Liu X, Bi X, Huang J, Jerecic R, Carr J, Li D. Contrast-enhanced whole-heart coronary magnetic resonance angiography at 3.0 T: comparison with steady-state free precession technique at 1.5 T. Invest Radiol. 2008;43(9):663–668. doi: 10.1097/RLI.0b013e31817ed1ff. [DOI] [PubMed] [Google Scholar]
- 3.Yang Q, Li D, Bi X, et al. Diagnostic Value of Contrast-Enhanced Whole-heart Coronary MRA at 3.0 Tesla. Proceedings 16th Scientific Meeting, International Society for Magnetic Resonance in Medicine; Toronto. 2008. Apr, p. 315. [Google Scholar]
- 4.Foo TK, Saranathan M, Prince MR, Chenevert TL. Automated detection of bolus arrival and initiation of data acquisition in fast, three-dimensional, gadolinium-enhanced MR angiography. Radiology. 1997;203(1):275–280. doi: 10.1148/radiology.203.1.9122407. [DOI] [PubMed] [Google Scholar]
- 5.Wilman AH, Riederer SJ, King BF, Debbins JP, Rossman PJ, Ehman RL. Fluoroscopically triggered contrast-enhanced three-dimensional MR angiography with elliptical centric view order: application to the renal arteries. Radiology. 1997;205(1):137–146. doi: 10.1148/radiology.205.1.9314975. [DOI] [PubMed] [Google Scholar]
- 6.Larson AC, White RD, Laub G, McVeigh ER, Li D, Simonetti OP. Self-gated cardiac cine MRI. Magn Reson Med. 2004;51(1):93–102. doi: 10.1002/mrm.10664. [DOI] [PMC free article] [PubMed] [Google Scholar]
- 7.Griswold MA, Jakob PM, Heidemann RM, et al. Generalized autocalibrating partially parallel acquisitions (GRAPPA) Magn Reson Med. 2002;47(6):1202–1210. doi: 10.1002/mrm.10171. [DOI] [PubMed] [Google Scholar]
- 8.Makaryus AN, Dhama B, Raince J, et al. Coronary artery diameter as a risk factor for acute coronary syndromes in Asian-Indians. Am J Cardiol. 2005;96(6):778–780. doi: 10.1016/j.amjcard.2005.05.018. [DOI] [PubMed] [Google Scholar]
- 9.Dodge JT, Jr, Brown BG, Bolson EL, Dodge HT. Lumen diameter of normal human coronary arteries. Influence of age, sex, anatomic variation, and left ventricular hypertrophy or dilation. Circulation. 1992;86(1):232–246. doi: 10.1161/01.cir.86.1.232. [DOI] [PubMed] [Google Scholar]
- 10.Weber OM, Martin AJ, Higgins CB. Whole-heart steady-state free precession coronary artery magnetic resonance angiography. Magn Reson Med. 2003;50(6):1223–1228. doi: 10.1002/mrm.10653. [DOI] [PubMed] [Google Scholar]
- 11.Wang Y, Ehman RL. Retrospective adaptive motion correction for navigator-gated 3D coronary MR angiography. J Magn Reson Imaging. 2000;11(2):208–214. doi: 10.1002/(sici)1522-2586(200002)11:2<208::aid-jmri20>3.0.co;2-9. [DOI] [PubMed] [Google Scholar]
- 12.Aharon S, Oksuz O, Lorenz C. Simultaneous projection of multibranched vessels with their surroundings on a single image from coronary MRA. Seattle, WA, USA: 2006. p. 365. [Google Scholar]
- 13.Maki JH, Prince MR, Londy FJ, Chenevert TL. The effects of time varying intravascular signal intensity and k-space acquisition order on three-dimensional MR angiography image quality. J Magn Reson Imaging. 1996;6(4):642–651. doi: 10.1002/jmri.1880060413. [DOI] [PubMed] [Google Scholar]
- 14.Shankaranarayanan A, Fung M, Beatty P, et al. 128-channel highly-accelerated breath-held 3D coronary MR Imaging. Proceedings 16th Scientific Meeting, International Society for Magnetic Resonance in Medicine; Toronto. 2008. Apr, p. 314. [Google Scholar]
- 15.Nehrke K, Bornert P, Mazurkewitz P, Winkelmann R, Grasslin I. Free-breathing wholeheart coronary MR angiography on a clinical scanner in four minutes. J Magn Reson Imaging. 2006;23(5):752–756. doi: 10.1002/jmri.20559. [DOI] [PubMed] [Google Scholar]
- 16.Niendorf T, Hardy CJ, Giaquinto RO, et al. Toward single breath-hold whole-heart coverage coronary MRA using highly accelerated parallel imaging with a 32-channel MR system. Magn Reson Med. 2006;56(1):167–176. doi: 10.1002/mrm.20923. [DOI] [PubMed] [Google Scholar]
- 17.Fleischmann D, Hittmair K. Mathematical analysis of arterial enhancement and optimization of bolus geometry for CT angiography using the discrete fourier transform. J Comput Assist Tomogr. 1999;23(3):474–484. doi: 10.1097/00004728-199905000-00026. [DOI] [PubMed] [Google Scholar]
- 18.Prokop M, Schneider G, Vanzulli A, et al. Contrast-enhanced MR Angiography of the renal arteries: blinded multicenter crossover comparison of gadobenate dimeglumine and gadopentetate dimeglumine. Radiology. 2005;234(2):399–408. doi: 10.1148/radiol.2342040023. [DOI] [PubMed] [Google Scholar]
- 19.Broome DR, Girguis MS, Baron PW, Cottrell AC, Kjellin I, Kirk GA. Gadodiamide-associated nephrogenic systemic fibrosis: why radiologists should be concerned. AJR Am J Roentgenol. 2007;188(2):586–592. doi: 10.2214/ajr.06.1094. [DOI] [PubMed] [Google Scholar]


