

Abstract
Therapeutic advances in type 1 diabetes (T1DM) are currently focused on developing a closed-loop control system using a continuous glucose monitor (CGM), subcutaneous insulin delivery, and a control algorithm. Because a CGM assesses blood glucose indirectly (and therefore often inaccurately), it limits the effectiveness of the controller. In order to improve the quality of CGM data, a series of analyses are suggested. These analyses evaluate and compensate for CGM errors, assess risks associated with glucose variability, predict glucose fluctuation, and forecast hypo- and hyperglycemia. These analyses are illustrated with data collected using the MiniMed CGMS® (Medtronic, Northridge, CA) and Freestyle Navigator™ (Abbott Diabetes Care, Alameda, CA). It is important to remember that traditional statistics do not work with CGM data because consecutive CGM readings are highly interdependent.
Keywords: CGM, continuous glucose monitoring, hypoglycemia, prediction methods, time series
Introduction
Thirty years ago, the possibility of external closed-loop control (artificial pancreas) of blood glucose (BG) levels in people with type 1 diabetes (T1DM) was established with an instrument known commercially as the Biostator™, which used intravenous (i.v.) BG sampling and i.v. insulin and glucose delivery.1–3 Thus, this device was cumbersome and unsuitable for outpatient use. A minimally invasive closed loop using a subcutaneous (s.c.) continuous glucose monitor (CGM) and s.c. insulin delivery was needed. With the introduction of several s.c. continuous glucose monitoring systems (CGMS),4–7 s.c.–s.c. systems using CGM coupled with an insulin infusion pump and a control algorithm have been developed and tested.8–11 However, subcutaneous closed-loop control has encountered limitations primarily as a consequence of sensor performance and reliability. It is generally recognized that CGM accuracy is lower than the accuracy of self-monitoring devices12 and that “the glucose monitor remains the main limiting factor in the development of commercially viable closed-loop system.”9 This is because of several factors, including, but not limited to, (i) tissue-to-probe interface (e.g., wound healing effects, movement artifacts), (ii) measurement of glucose concentration in interstitial fluid but calibration with BG, and (iii) interstitial time lag. For this reason, a new guideline is proposed for the assessment of several aspects of CGM performance, including point and trend accuracy, sensitivity and specificity, device stability, calibration, and lag time.13 While the discussion of all these aspects of sensor performance is beyond the scope of this article, we concentrate on issues of the analysis and interpretation of CGM data related to closed-loop control.
The two major types of algorithmic controllers are proportional–integral–derivative (PID) and model-predictive control (MPC). The general consensus is that PID control would be suitable for implantable i.v. systems because of the minimal time lag between BG reading and insulin adjustment,14,15 whereas MPC is the tool of choice for s.c.–s.c. control, which has to deal with a substantial time lag.9 Indeed, s.c.–s.c. controllers need to compensate for two time delays: (i) because the CGM resides in interstitial fluid there is a 5- to 20-minute time lag between change in blood and change in sensor reading due to blood-to-interstitial glucose transport and sensor limitations16,17 and (ii) a change in the rate of insulin delivery takes 30 minutes or more to result in a change in insulin action.18,19 While these time delays have little impact in steady metabolic states (e.g., fasting during sleep), they are critical during rapidly changing metabolic demands, such as meals or physical activity. Consequently, semiclosed loop control, i.e., closed-loop control between meals opening for delivery of prandial insulin, has been proposed (the Advanced Insulin Infusion using a Control Loop project8). In addition to user intervention, algorithms retrieving CGM data prior to submission to the controller could have a major contribution to the success of the artificial pancreas. In order to provide the controller with the best data possible, a series of analyses are needed prior to initiation of PID or MPC. This article discusses three categories of methods.
Evaluation of CGM accuracy, including separate estimation of, and compensation for, calibration errors and blood-to-interstitial glucose time lag based on a diffusion model.
Risk analysis, which uses a nonlinear data transformation of the BG scale to define risk space, providing certain numerical advantages to optimal control.
Forecast, which uses time series analysis to predict future glucose values, thereby alleviating the effect of time lags. The combination of risk and time series analysis is used to predict the risk of crossing specific thresholds (e.g., hypo- or hyperglycemia).
All analyses are illustrated by CGM data collected during clinical trials with the MiniMed CGMS® (Medtronic, Northridge, CA) and Freestyle Navigator™ (Abbott Diabetes Care, Alameda, CA).
Decomposition of Sensor Errors
Figure 1 presents the components of the error of the MiniMed CGMS assessed during a hyperinsulinemic hypoglycemic clamp involving 39 subjects with T1DM. In this study reference BG was sampled every 5 minutes and then reference data were synchronized with data from the CGMS. The calibration error was estimated as the difference between CGMS readings and computer-simulated recalibration of the raw CGMS current using all reference BG points to yield an approximation of the dynamics of interstitial glucose (IG) adjusted for the BG-to-IG gradient.20 The physiologic BG-to-IG time lag was estimated as the difference between reference BG and the “perfectly” recalibrated CGMS signal. The mean absolute deviation (MAD) of sensor data was 20.9 mg/dl during euglycemia and 24.5 mg/dl during the descent into and recovery from hypoglycemia. Computer-simulated recalibration reduced MAD to 10.6 and 14.6 mg/dl, respectively. Thus, during this experiment, approximately half of the sensor deviation from reference BG was attributed to calibration error; the rest was attributed to BG-to-IG gradient and random sensor deviations.
Figure 1.
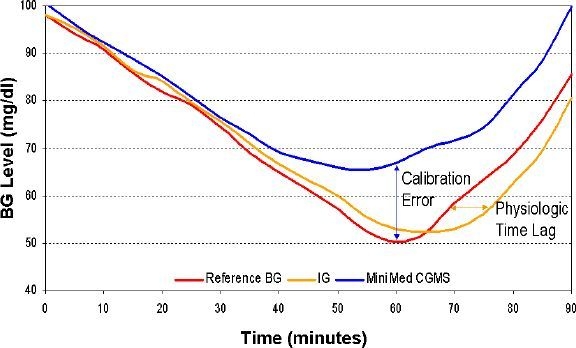
CGMS error during hypoglycemic clamp decomposed into error of calibration and physiologic deviation caused by blood-to-interstitial time lag.
A diffusion model was fitted for each individual subject's data, as well as globally across all subjects. While the details of this model have been reported previously,20 of particular importance is the finding that “global,” across-subjects, parameters describe the observed blood-to-interstitial delays reasonably well.20 The availability of global parameters would allow glucose concentration in the interstitium to be numerically estimated directly from reference BG data. This in turn would allow for (i) setting the accuracy benchmark by simulating a sensor that does not have calibration errors, (ii) tracking and correcting errors because of calibration, and (iii) numerical compensation for BG-to-IG differential through an inverted diffusion model estimating BG from IG approximation of the sensor (in essence, the reference BG line in Figure 1 could be derived from the IG line numerically, thereby reducing the influence of interstitial time lag).
Risk Analysis of BG Variability
Traditionally, statistical estimation of BG variability in diabetes includes computing the standard deviation of BG readings, counting of episodes below/above certain thresholds, or computing of specific statistics, such as the M value,21 mean amplitude of glycemic excursions,22 or lability index.23 While all these computations are available in our toolbox, we would advocate using a set of advanced measures that we have been developing since the late 1990s for both self-monitoring of blood glucose24 and CGM25 data. The reason is that the traditional measures are unequally sensitive to hypoglycemic and hyperglycemic excursions due to the inherent asymmetry of the BG scale26 and therefore portray a bias toward the hyperglycemia picture of variability. Correcting this problem numerically, we have introduced a data transformation that symmetrizes the BG scale using only accepted clinical assumptions, not a particular data set, which makes the approach extendable to any data.26 Based on this transformation, we have developed our theory of risk analysis of BG data27 defining a computational framework, the risk space. Figure 2 presents the effect of transforming BG fluctuations from glucose to risk values.
Figure 2.
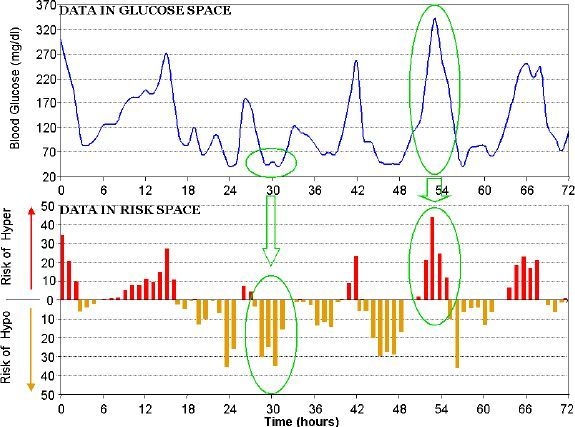
CGM data in glucose vs risk space: converting data equalizes numerically the hypoglycemic and hyperglycemic ranges and suppresses the variance in the safe euglycemic range.
This transformation provides the following numerical and clinical advantages over traditional and literature variability measures. (i) Similar emphasis is placed on hypoglycemic and hyperglycemic ranges. (ii) The normal BG range (70–180 mg/dl) is given less weight, thus variability contained within normal range carries less risk than excursions outside of this range. This corresponds to the clinical importance of extreme BG fluctuations and to the notion that fluctuations within normal range are generally harmless. (iii) Excursions into extreme hypo- and hyperglycemia get progressively increasing risk values; this corresponds to the clinical impression that more extreme hypo- or hyperglycemia carries higher risk for the patient.
Projection and Time Series-Based Prediction of Future BG Values
Most contemporary CGM systems include glucose prediction capabilities, in particular hypoglycemia and hyperglycemia alarms. Practically all predictions are currently based on a linear extrapolation of glucose values, e.g., projection ahead of the current glucose trend. Because glucose fluctuations are generally nonlinear, such projections frequently result in errors and typically have a high false-alarm rate. In contrast, a model-based sliding algorithm designed to continually predict glucose levels 30–45 minutes ahead had substantially higher accuracy than typical linear projections.28 The sliding algorithm works as follows. For each time series, a first-order polynomial model is fitted, continually at any sampling time, against past glucose data by weighted least squares. Then, the model is used to predict the glucose level at a preset prediction horizon. In model fitting, data points are “weighted” using a forgetting factor of 0.8 (which was determined to be optimal in numerical experiments), i.e., the weight of the kth point before the actual sampling time is (0.8)k. Figure 3 presents the action of the prediction algorithm at a prediction horizon of 30 minutes. While the algorithm tends to exaggerate transient peak and nadir glucose values, its overall predictive capability is very good. Judged by continuous glucose error-grid analysis (CG-EGA), >80% of predicted vs actual values fall in CG-EGA zone A and >85% fall in zones A+B. As would be expected, the accuracy of the prediction is highest during euglycemia, with 97% of predicted vs actual values falling in CG-EGA zones A+B.
Figure 3.
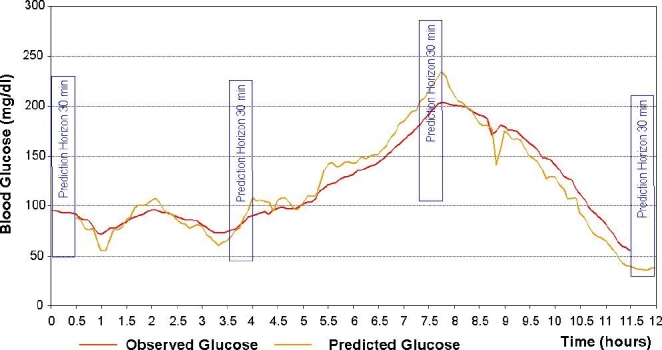
Real-time prediction of glucose fluctuation using an autoregression algorithm.
Autocorrelation of CGM Data
Finally, a statistical disadvantage of the CGM data stream is the high interdependence between data points taken from the same subject within a relatively short time. As a result, standard statistical analyses, such as t tests, while appropriate for independent data points, will produce inaccurate results if applied directly to CGS data. The reason is a severe violation of the statistical assumptions behind the calculation of degrees of freedom, which are essential to compute the p value of any statistical test. Figure 4 illustrates this point and suggests a way to avoid such a miscalculation.
Figure 4.
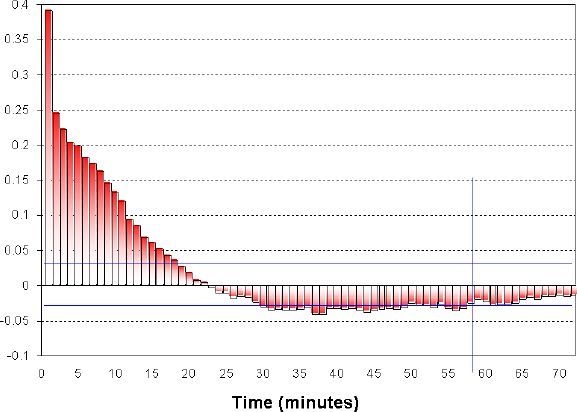
Autocorrelation of continuous monitoring data: the autocorrelation coefficients become insignificant at a time lag of approximately 1 hour; thus CGM readings more than 1 hour apart could be considered linearly independent.
In Figure 4, the autocorrelation of consecutive CGM data points remains significant for approximately 1 hour, after which its significance drops below the level of 0.05. Thus, CGM readings that are separated by more than 1 hour in time could be considered linearly independent, which is sufficient for some statistical tests. A note of caution is that linear independence does not imply stochastic independence, which might be essential in some cases. Another conclusion from Figure 4 is that CGM data aggregated in 1-hour blocks would be reasonably approximated by a Markov chain, which opens a number of possibilities for the analysis of aggregated data. Finally, in Figure 4 the linear dependence between consecutive data points practically disappears at a time lag of ≃30 minutes. Therefore, a projection of BG levels more than 30 minutes ahead, which is using linear methods, would be inaccurate. This last point has significant clinical impact on the settings of hypo- or hyperglycemia alarms, many of which are based on linear projections of past CGM data.
Conclusions
The CGM data stream has some inherent characteristics that allow for advanced data analysis approaches, but also calls for caution if standard statistical methods are used. Most importantly, CGM data represent time series, i.e., sequential readings that are ordered in time. This leads to two fundamental requirements to their analysis. First, consecutive sensor readings taken from the same subject within a relatively short time are highly interdependent. Second, the order of CGS data points is essential for clinical decision making. For example, the sequences 90→82→72 mg/dl and 72→82→90 mg/dl are clinically very different. These properties allow the development of several algorithms presented in this article: (i) evaluation of and compensation for sensor errors as a consequence of calibration and blood-to-interstitial time lag, (ii) analysis of temporal variability and associated risks, and (iii) real-time prediction of glucose trends and events using nonlinear prediction methods. These analyses of system dynamics are extremely useful in enabling real-time closed-loop control.
We caution that standard statistical analyses, while appropriate for independent data points, will produce inaccurate results if applied to CGM data. Data preprocessing steps, such as taking data more than 1-hour apart, would alleviate this problem. From a control point of view, of particular importance is that 1-hour block aggregation would produce a Markov chain, which opens the possibility of using advanced engineering and mathematical methods. Clinically, a linear projection of BG levels more than 30 minutes ahead would be generally inaccurate.
Acknowledgements
The authors thank Dr. Claudio Cobelli (University of Padova, Italy) and Dr. Marc Breton (University of Virginia) for their valuable discussions of this project.
Abbreviations
- BG
blood glucose
- CG-EGA
continuous glucose error-grid analysis
- CGM
continuous glucose monitor
- CGMS
continuous glucose monitoring system
- IG
interstitial glucose
- i.v.
intravenous
- MAD
mean absolute deviation
- MPC
model-predictive control
- PID
proportional–integral–derivative
- s.c.
subcutaneous
- T1DM
type 1 diabetes
References
- 1.Albisser AM, Leibel BS, Ewart TG, Davidovac Z, Botz CK, Zingg W. An artificial endocrine pancreas. Diabetes. 1974;23(5):389–396. doi: 10.2337/diab.23.5.389. [DOI] [PubMed] [Google Scholar]
- 2.Clemens AH, Chang PH, Myers RW. The development of Biostator, a Glucose Controlled Insulin Infusion System (GCIIS) Horm Metab Res. 1977;(Suppl 7):23–33. [PubMed] [Google Scholar]
- 3.Santiago JV, Clemens AH, Clarke WL, Kipnis DM. Closed-loop and open-loop devices for blood glucose control in normal and diabetic subjects. Diabetes. 1979;28(1):71–84. doi: 10.2337/diab.28.1.71. [DOI] [PubMed] [Google Scholar]
- 4.Klonoff DC. The artificial pancreas: how sweet engineering will solve bitter problems. J Diabetes Sci Technol. 2007;1(1):72–81. doi: 10.1177/193229680700100112. [DOI] [PMC free article] [PubMed] [Google Scholar]
- 5.Feldman B, Brazg R, Schwartz S, Weinstein R. A continuous glucose sensor based on wired enzyme technology–results from a 3-day trial in patients with type 1 diabetes. Diabetes Technol Ther. 2003;5(5):769–779. doi: 10.1089/152091503322526978. [DOI] [PubMed] [Google Scholar]
- 6.Gross TM, Bode B, Einhorn D, Kayne DM, Reed JH, White NH, Mastrototaro JJ. Performance evaluation of the MiniMed continous glucose monitoring system during patient home use. Diabetes Technol Ther. 2000;2(1):49–56. doi: 10.1089/152091500316737. [DOI] [PubMed] [Google Scholar]
- 7.Klonoff DC. Continuous glucose monitoring: roadmap for 21st century diabetes therapy. Diabetes Care. 2005 May;28(5):1231–1239. doi: 10.2337/diacare.28.5.1231. [DOI] [PubMed] [Google Scholar]
- 8.Hovorka R, Chassin LJ, Wilinska ME, Canonico V, Akwi JA, Federici MO, Massi-Benedetti M, Hutzli I, Zaugg C, Kaufmann H, Both M, Vering T, Schaller HC, Schaupp L, Bodenlenz M, Pieber TR. Closing the loop: the adicol experience. Diabetes Technol Ther. 2004;6(3):307–318. doi: 10.1089/152091504774197990. [DOI] [PubMed] [Google Scholar]
- 9.Hovorka R. Continuous glucose monitoring and closed-loop systems. Diabet Med. 2006;23(1):1–12. doi: 10.1111/j.1464-5491.2005.01672.x. [DOI] [PubMed] [Google Scholar]
- 10.Shichiri M, Sakakida M, Nishida K, Shimoda S. Enhanced, simplified glucose sensors: long-term clinical application of wearable artificial endocrine pancreas. Artif Organs. 1998;22(1):32–42. doi: 10.1046/j.1525-1594.1998.06043.x. [DOI] [PubMed] [Google Scholar]
- 11.Steil GM, Rebrin K, Darwin C, Hariri F, Saad MF. Feasibility of automating insulin delivery for the treatment of type 1 diabetes. Diabetes. 2006;55(12):3344–3350. doi: 10.2337/db06-0419. [DOI] [PubMed] [Google Scholar]
- 12.Kovatchev BP, Gonder-Frederick LA, Cox DJ, Clarke WL. Evaluating the accuracy of continuous glucose monitoring sensors: continuous glucose error-grid analysis illustrated by Therasense Freestyle Navigator data. Diabetes Care. 2004;27(8):1922–1928. doi: 10.2337/diacare.27.8.1922. [DOI] [PubMed] [Google Scholar]
- 13.Clinical Laboratory Standards Institute. Performance metrics for continuous interstitial glucose monitoring; proposed guideline. CLSI document POCT4-P. In press 2007.
- 14.Renard E, Shah R, Miller M, Kolopp M, Costalat G, Bringer J. Sustained safety and accuracy of central IV glucose sensors connected to implanted insulin pumps and short-term closed-loop trials in diabetic patients. Diabetologia. 2003;46:A47. [Google Scholar]
- 15.Renard E, Panteleon AE, Leong P, Han J, Kolopp M, Miller M, et al. Efficacy of closed-loop control of blood glucose based on an implantable i.v. sensor and intraperitoneal pump. Diabetes. 2004;53:A114. [Google Scholar]
- 16.Boyne MS, Silver DM, Kaplan J, Saudek CD. Timing of changes in interstitial and venous blood glucose measured with a continuous subcutaneous glucose sensor. Diabetes. 2003;52(11):2790–2794. doi: 10.2337/diabetes.52.11.2790. [DOI] [PubMed] [Google Scholar]
- 17.Kulcu E, Tamada JA, Reach G, Potts RO, Lesho MJ. Physiological differences between interstitial glucose and blood glucose measured in human subjects. Diabetes Care. 2003;26(8):2405–2409. doi: 10.2337/diacare.26.8.2405. [DOI] [PubMed] [Google Scholar]
- 18.Hovorka R, Shojaee-Moradie F, Carroll PV, Chassin LJ, Gowrie IJ, Jackson NC, Tudor RS, Umpleby AM, Jones RH. Partitioning glucose distribution/transport, disposal, and endogenous production during IVGTT. Am J Physiol Endocrinol Metab. 2002;282(5):E992–1007. doi: 10.1152/ajpendo.00304.2001. [DOI] [PubMed] [Google Scholar]
- 19.Plank J, Wutte A, Brunner G, Siebenhofer A, Semlitsch B, Sommer R, Hirschberger S, Pieber TR. A direct comparison of insulin aspart and insulin lispro in patients with type 1 diabetes. Diabetes Care. 2002;25(11):2053–2057. doi: 10.2337/diacare.25.11.2053. [DOI] [PubMed] [Google Scholar]
- 20.King CR, Clarke WL, Anderson SM, Breton MD, Kovatchev BP. Modeling of calibration effectiveness and blood-to-interstitial glucose dynamics as potential confounders of the accuracy of continuous glucose sensors during hyperinsulinemic clamp. J Diabetes Sci Technol. 2007;1(3):317–322. doi: 10.1901/jaba.2007.1-317. [DOI] [PMC free article] [PubMed] [Google Scholar]
- 21.Schlichtkrull J, Munck O, Jersild M. The M-value, an index of blood glucose control in diabetics. Acta Med Scand. 1965;177:95–102. doi: 10.1111/j.0954-6820.1965.tb01810.x. [DOI] [PubMed] [Google Scholar]
- 22.Service FJ, Molnar GD, Rosevear JW, Ackerman E, Gatewood LC, Taylor WF. Mean amplitude of glycemic excursions, a measure of diabetic instability. Diabetes. 1970;19(9):644–655. doi: 10.2337/diab.19.9.644. [DOI] [PubMed] [Google Scholar]
- 23.Ryan EA, Shandro T, Green K, Paty BW, Senior PA, Bigam D, Shapiro AM, Vantyghem MC. Assessment of the severity of hypoglycemia and glycemic lability in type 1 diabetic subjects undergoing islet transplantation. Diabetes. 2004;53(4):955–962. doi: 10.2337/diabetes.53.4.955. [DOI] [PubMed] [Google Scholar]
- 24.Kovatchev BP, Cox DJ, Gonder-Frederick L, Clarke WL. Methods for quantifying self-monitoring blood glucose profiles exemplified by an examination of blood glucose patterns in patients with type 1 and type 2 diabetes. Diabetes Technol Ther. 2002;4(3):295–303. doi: 10.1089/152091502760098438. [DOI] [PubMed] [Google Scholar]
- 25.Kovatchev BP, Clarke WL, Breton M, Brayman K, McCall A. Quantifying temporal glucose variability in diabetes via continuous glucose monitoring: mathematical methods and clinical application. Diabetes Technol Ther. 2005;7(6):849–862. doi: 10.1089/dia.2005.7.849. [DOI] [PubMed] [Google Scholar]
- 26.Kovatchev BP, Cox DJ, Gonder-Frederick LA, Clarke W. Symmetrization of the blood glucose measurement scale and its applications. Diabetes Care. 1997;20(11):1655–1658. doi: 10.2337/diacare.20.11.1655. [DOI] [PubMed] [Google Scholar]
- 27.Kovatchev BP, Straume M, Cox DJ, Farhy LS. Risk analysis of blood glucose data: a quantitative approach to optimizing the control of insulin dependent diabetes. J Theor Med. 2001;3:1–10. [Google Scholar]
- 28.Zanderigo F, Sparacino G, Kovatchev BP, Cobelli C. Glucose prediction algorithms from continuous monitoring data: assessment of accuracy via continuous glucose-error grid analysis. J Diabetes Sci Technol. 2007;1(5):645–651. doi: 10.1901/jaba.2007.1-645. [DOI] [PMC free article] [PubMed] [Google Scholar]