

Abstract
Hæmodynamic signals underlying functional brain imaging (e.g. fMRI) are assumed to reflect metabolic demand generated by local neuronal activity, with equal increases in hæmodynamic signal implying equal increases in the underlying neuronal activity1-6. Few studies have compared neuronal and hæmodynamic signals in alert animals7,8 to test for this assumed correspondence. Here we present evidence bringing this assumption into question. Using a dual-wavelength optical imaging technique9 that independently measures cerebral blood volume and oxygenation, continuously, in alert behaving monkeys, we find two distinct components to the hæmodynamic signal in the alert animals' primary visual cortex (V1). One component is reliably predictable from neuronal responses generated by visual input. The other component – of almost comparable strength – is a hitherto unknown signal that entrains to task structure independent of visual input or of standard neural predictors of hæmodynamics. This latter component shows predictive timing, with increases of cerebral blood volume in anticipation of trial onsets even in darkness. This trial-locked hæmodynamic signal could be due to an accompanying V1 arterial pumping mechanism, closely matched in time, with peaks of arterial dilation entrained to predicted trial onsets. These findings (tested in 2 animals) challenge the current understanding of the link between brain hæmodynamics and local neuronal activity. They also suggest the existence of a novel preparatory mechanism in the brain that brings additional arterial blood to cortex in anticipation of expected tasks.
We have developed a dual-wavelength optical imaging technique to (in effect) simultaneously image cortical blood volume and oxygenation in alert behaving macaques. This technique involves switching rapidly between two wavelengths: 530 nm (green, equally absorbed in oxygenated and deoxygenated hæmoglobin, thus measuring total hæmoglobin concentration, ‘HbT,’ or ‘blood volume’) and 605 nm (red, absorbed about 5-fold more strongly in deoxygenated than oxygenated hæmoglobin, thus measuring ‘oxygenation’.10 Fig 1a, Methods). While imaging V1 in animals performing periodic visual tasks we observed a hitherto unknown stimulus-independent hæmodynamic signal that appeared to entrain to trial timing (Fig 1b).
Fig 1. Periodic fixation tasks evoke stimulus-independent, trial-linked signals even in the dark.

a: Normalized emission spectra of the 2 illumination sources (LEDs), superimposed on in vitro absorbance spectra for deoxy- and oxyhæmoglobin10 (units: 104 cm−1/M). b: ‘Stim’: V1 ‘blood volume’ response to small, brief visual stimulus presented during periodic fixation trials. ‘Blank’: Signal in trial with no visual stimulus. ‘Stim-Blank’: stimulus-specific response. c: Eye position and pupil diameter (% of mean), consecutive trials. (Vertical dashed lines: trial onsets. Note pupil dilation, fix break, fix acquire, shown for first trial). Scales colour-coded. d: Cortical signals, colour-coded by imaging wavelength. e, f: Trial-triggered averages. (grey lines: individual trials; thick lines: mean, +/− SEM, n=51: 605 nm: mean peak-to-peak amplitude: 1.19% +/− 0.08; 530 nm: 3.47% +/− 0.21). Population histograms: 605 nm: mean=0.86%, std=0.29, N=47 experiments. 530 nm: mean=2.17%, std=0.97, N=66.
To study this trial-related signal in isolation, we developed a task that minimized visual input while preserving trial timing. In an otherwise completely dark room, the animal was required to fix its gaze periodically on a tiny fixation point for juice reward (point size ∼1-2 arc min, i.e. ∼ 1-2 cone diameters). The fixation point stayed on continuously, switching between two equiluminant colours to cue the animal to ‘fixate’ or ‘relax.’ It was akin to seeing nothing besides one single twinkling star in an otherwise black night sky. Our two rhesus macaque monkeys (‘V’ and ‘S’) learned the task correctly as evidenced by their fixation patterns (Fig 1c). Both monkeys performed long sequences of correct trials, consistently holding fixation during ‘fixate’ periods and taking fixation breaks, if any, only during ‘relax’ periods.
On imaging V1 while the animals performed this task we observed robust hæmodynamic signals at the trial frequency even though the animals were in virtually total darkness and foveal V1, the only region receiving visual input from the fixation point, lay outside our imaging area. These periodic fluctuations were seen in both the ‘blood volume’ (530 nm) and ‘oxygenation’ signals (605 nm; Fig 1d,f). They were accompanied by periodic changes in heart rate (HR)11 and systematic pupil dilation12 on trial onset suggesting a rhythmic state of alertness synchronized to each trial (Fig 1c-f).
We wanted to determine the relation between these trial-linked hæmodynamic signals and V1 neuronal activity. A crucial assumption in most brain imaging studies is that hæmodynamic signals are caused by local neuronal responses through a uniform underlying mechanism1-6 (but see13,14). In particular, brain images are routinely used to infer changes in local neuronal activity by fitting the imaging signal with some standard causal hæmodynamic kernel. To reveal neuronal mechanisms underlying V1 hæmodynamics we obtained both trial-related and visually evoked optical imaging signals concurrently with electrode recordings across V1 (Fig S1, Table 1 in supplementary material). At each site, in alternating blocks (20-40 trials each) while the animal performed the same fixation task, we either presented vigorous visual stimuli or no stimuli at all. For each data set we then used an optimization routine to calculate the causal kernel that ‘best’ fitted hæmodynamics to concurrent neuronal signals (Fig S2), and tested whether this ‘best’ kernel could reliably predict hæmodynamics.
To get measures of neuronal activity for this analysis we separated the electrode recordings into multi-unit spiking (MUA) and local field potential (LFP. Fig S1, Methods). As expected, visual stimulation evoked vigorous responses in both MUA and LFP (Fig 2a). The stimulus-evoked LFP responses could be empirically separated into two distinct frequency bands (Fig 2a, bottom). The high-frequency band (‘hi-LFP’: 66-130 Hz, avoiding 60 Hz), like MUA, showed crisp visually evoked responses. The low-frequency band (‘lo-LFP’, 10-56 Hz), also showed robust signal but with no apparent correlation with visual stimulation. Our empirically defined LFP bands match categories defined through prior work. The ‘hi-LFP’ matches a frequency band (‘high gamma’) shown to correlate well with stimulus-evoked spiking and hæmodynamics2,15,16. The ‘lo-LFP’ – often separated into finer frequency bands15,16 – is believed to have a very different relationship with other brain signals15,16. We therefore decided to test the three neuronal signal types independently, MUA, hi-LFP and lo-LFP, for their ability to reliably predict concurrently recorded hæmodynamics. These tests were conducted separately for ‘blood volume’ and ‘oxygenation’ signals.
Fig 2. Local neuronal activity predicts visually driven, but not trial-related hæmodynamics.
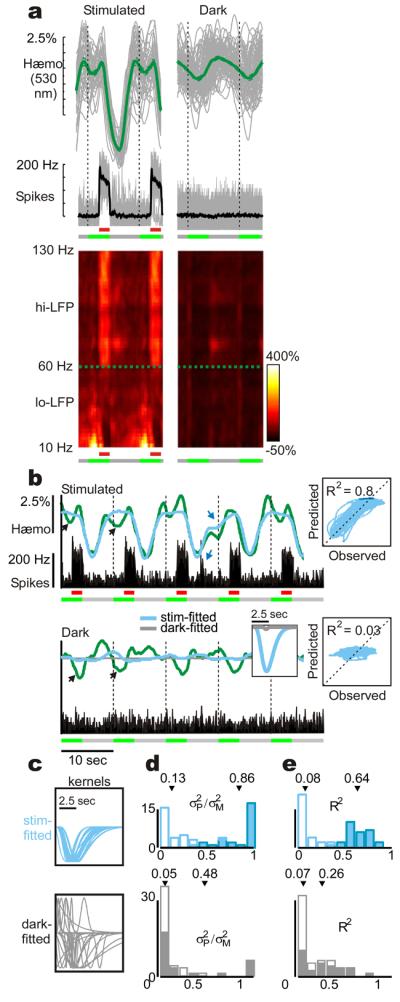
a: Trial-triggered mean hæmodynamic (‘blood volume’) and electrophysiological signals comparing stimulus-driven and dark-room responses, representative experiment. LFP power spectrum (bottom) normalized to pre-stimulus dark power (2-Hz resolution). b: Comparing measured hæmodynamics (green) with optimal predictions from concurrent spiking, same experiment. Blue, gray –using kernels (inset) obtained by fitting stimulated or dark-room signals respectively; (same colour code used all through. Dark-room kernel and prediction almost indistinguishable from a flat line; prediction shown for dark only, to avoid clutter.). Black arrows: trial-related activity not predicted in either the stimulated or dark-room trials. Blue arrows: random bursts of neuronal activity generate matching deflections in the predicted and observed trace. Right: scatter-plots and R2 values of observed vs. predicted hæmodynamics using stimulus-based predictors. c: Optimal kernels across days (amplitude normalized for comparison; N = 28 recording sites). d-e: Descriptive statistics of spike-based fits. top – stimulus-based prediction; bottom – dark-room based. d: ratio of variance between predicted and measured signals (σP2/σM2). e: R2 statistic: Open vs. closed bars represent dark-room vs. stimulus driven sessions, respectively. Arrows mark population means.
Visually driven MUA and hi-LFP predicted the simultaneously recorded hæmodynamic signals very well both in amplitude and time course (Fig 2b-e, S3b-e). Further, the optimal kernels obtained by fitting these signals were consistent in shape across all recording sites (Fig 2c, S3c, top); kernels from any given experiment predicted visually evoked responses in all other experiments with almost equal accuracy, attesting to their remarkable reliability (Fig S4). In sharp contrast, the same kernels, when convolved with dark-room MUA or hi-LFP, were uniformly poor at predicting trial-related hæmodynamics, in both amplitude and temporal correlation (Fig 2b-e, S3b-e). The latter finding (R2 ∼ 0.08, MUA; 0.06, hi-LFP) specifically implies that there is no consistent temporal relation between predicted and measured hæmodynamics, independent of amplitude. This poor predictability was particularly striking since the trial-related hæmodynamic signal amplitudes were almost comparable to those of responses to vigorous visual stimulation (37% at ‘blood volume,’ 530 nm; 57% at ‘oxygenation,’ 605 nm. Fig S5). To check whether trial-related hæmodynamics could still be predicted reliably by concurrent neuronal recordings but through kernels of a different shape, we fitted dark-room MUA and hi-LFP to dark-room hæmodynamics. These ‘best’ dark-room kernels were highly variable amongst recording sites and, again, consistently failed to predict trial-related hæmodynamics (Fig 2c-e, S3c-e, bottom). The same overall pattern of results was seen for both ‘blood volume’ and ‘oxygenation’ signals (Fig S6).
These results provide compelling evidence that visually evoked hæmodynamic signals are very well predicted by established measures of local neuronal activity (MUA, hi-LFP) through a causal kernel that is uniform across experiments. Such a model fails profoundly, however, to predict the trial-related signals. Therefore any neuronal mechanisms underlying trial-related hæmodynamics appear to be distinct from those typically assumed to underlie neurovascular coupling.
Unlike MUA or hi-LFP, lo-LFP – whether treated as a whole or separated into finer frequency bands – failed to show any consistent relationship with hæmodynamics. These signals gave highly variable ‘optimal kernels’ when fitted with concurrent hæmodynamics either under visual driving or in the dark, with uniformly poor predictions of hæmodynamics (Fig S7, S13).
Next, we characterized the novel trial-related hæmodynamic signal in terms of its temporal relation to trial timing. To determine whether our observed signals are linked specifically with trial timing and not a result of some unrelated intrinsic oscillatory process17, we examined how the signals adapted to different trial periods. Our results provided compelling evidence that the signals are linked predictively to trial onsets. This was seen both in the signal shapes at each trial period and their anticipatory timing on switching trial period.
We found that the trial-related signals stretched elastically to match each tested trial period (Fig 3, S8a. Tested 6-sec to 30-sec trial periods). In particular, the shape of the ‘blood volume’ signal always stretched so as to start darkening (increasing hæmoglobin) during the ‘relax’ period, – before the onset of the next trial – reaching a peak darkening close to the onset of the next ‘fixate’ period (Fig 1, 3a-d). This elastic pattern of trial-locked hæmodynamics – in which signals begin changing prior to trial onsets – cannot be explained by mechanisms that involve a causal kernel triggered on trial start. This can be demonstrated by comparison with responses to (brief, intense) visual stimulation of the same duration as the ‘fixate’ period, where the stereotyped response shape, with abrupt onset and fixed width following stimulus presentation, is independent of trial period (Fig S8b; quantitative model, Fig S8c). The trial-related signal is thus unlikely to be due to neuronal signals active only during the cued ‘fixate’ period (e.g. the presumed time course of ‘attention’18).
Fig 3. Trial-related hæmodynamic signals entrain to anticipated trial onsets, stretching to conform to the trial period.

a: Schematic: dark-room fixation trials, each with the same 4-sec ‘fixate’ epochs but in blocks of different trial periods, short (8-sec, blue) and long (20-sec; pink; same colour scheme in other panels & Fig 4). b, c: ‘Blood volume’ signal, short and long trials respectively. Averages triggered on trial onsets, +/− SEM (b: n=220 trials; c: N=179). Arrowheads: peak brightening (red), darkening (black). Dotted white line in panel c shows where short trial onset would have occurred. d: population histograms of peak brightening and darkening in units of trial phase (0=trial start, 1=trial end, start of next trial; brightening: mean=0.43, sd=0.16; darkening, mean=0.89, sd=0.21; N=66; Trial periods ranging from 6 to 30 sec). e, f: Signal at transitions between trial periods: short-to-long (e; N=16 trials, mean+/− SEM), and long-to-short (f: N=10); arrowheads are aligned, in each case, to the panel above for comparison of signal features. Dotted white line as in c. g: Left: Short-to-Long transition trial (green) is statistically indistinguishable from other short trials over one short-trial period (blue background). (Bootstrap analysis. Green: mean transition trial; grey: means of 500 random N=16-trial subsets of the short trials to match statistics of transition trial; black: grand mean of all short trials, same as b; inset histogram: correlation of random subsets with grand mean; arrowhead: correlation of transition trial with grand mean = 0.97). Right: Short-to-Long transition response is distinct from random N=16-trial subsets of long trials. Same conventions as on the left, with the correlation coefficients being calculated, again, over the duration of one short period (pink background).
On switching trial timing unexpectedly after the monkey had established a rhythm of 10-20 correct trials at a given period, hæmodynamic signals continued to oscillate at the earlier period for a couple of trials before entraining to the new one (Fig 3e, f). This occurred even though the animal himself picked up the new trial pace immediately, holding and breaking fixation at the new rhythm right after the switch (i.e. clearly having noticed the new pace of fixation cues). Thus, on switching from short to long trials the measured signals showed a peak darkening at the short trial spacing even though the animal was fixating correctly at the longer period (Fig 3e). Similarly, on switching from long to short trials the cortical signal continued at its prior slower pace for one long period, overriding the first few short trials (Fig 3f). The response shape observed on transition trials closely resembled pre-transition responses for the duration of the pre-transition trial period, while being very poorly matched to the post-transition trial shape suggesting that the underlying neuronal mechanism continued to ‘anticipate’ the pre-transition trial timing (Fig 3g, S9). Further, the trial-related signal timing was correlated specifically with trial onsets and not with reward19 – the peak darkening position remained unaffected on delaying the reward associated with each trial (Fig S8d).
Finally, images of the cortical surface suggest that the trial-related signals involve the local vasculature rather than being a systemic trial-locked autonomic (e.g. cardiac) response20. These images revealed a dramatic contraction-dilation cycle in V1 arteries, evidenced by a prominent brightening, followed by darkening of the arterial walls relative to the ‘parenchyma’ baseline (Fig 4a-b, S10. Fig S11 indicates how arteries, veins and ‘parenchyma’ are distinguished and how the artery signal is measured). This arterial signal had a timing that closely matched the overall timing of the mean ‘blood volume’ with peaks of arterial contraction and dilation coinciding with peaks of brightening (decreased hæmoglobin) and darkening (increased hæmoglobin), respectively (Fig 4a, c-g). The arterial cycle stretched elastically to fit trial periods, matching the shape of the mean signal (Fig 4d,e). Further, on switching trial periods the arterial cycle showed an anticipatory dilation well synchronized with the anticipatory increase in ‘blood volume’ seen in the mean signal (Fig 4f,g). This local arterial cycle may thus be the specific mechanism generating trial-related increases in V1 ‘blood volume’ in anticipation of visual tasks. Further, the arterial cycle is seen in V1 only for visual tasks and is likely not a passive consequence of trial-locked changes in heart rate or blood pressure20. We found no V1 arterial pumping or trial-related changes in V1 ‘blood volume’ in a periodic auditory control task despite the presence of periodic changes in heart rate and pupil dilation very similar to those seen in our visual task (Fig S12).
Fig 4. Mean ‘blood volume’ signal is closely matched, temporally, by V1 arterial contraction-dilation cycle.

a: Mean trial-triggered signals and b: individual frames showing fractional signal change relative to trial-mean image. Inset square: green: ‘fixate’, black: ‘relax’. Magnified sections show arterial contraction (white walls), dilation (black walls). Grey trace in panel a: arterial signal relative to ‘parenchyma baseline,’ (Fig S11 – method for calculating arterial signal. Arterial trace shifted vertically from overall mean for visibility). c: Timing of peak arterial contraction (dilation), as phase within trial, matches peak brightening (darkening) of mean signal: red square (black diamond) respectively. d - g: Arterial signal (grey) closely matches mean signal (green) for different trial periods (d, e) and at transitions between periods (f, g); same experiment, conventions as in Fig 3b, c, f, g (traces shifted vertically for visibility). Note close matches between corresponding peaks and troughs (arrows), indicated as in Fig 3.
Our findings have two major implications, one for the interpretation of brain imaging21, and the other advancing our knowledge of brain mechanisms underlying anticipation. First – the interpretation of fMRI22, e.g. through general linear modelling23, typically makes the crucial assumption of a uniform linear predictive relationship between neuronal and hæmodynamic signals. We show that this model is valid for visually evoked signals, but that it fails profoundly to predict another class of signals, of almost comparable magnitude and behaviourally linked structure. These results raise the further possibility that there may be other, hitherto uncovered exceptions13,14 to the assumption that hæmodynamic signals uniformly imply equivalent underlying neuronal activity. Second – the predictive timing and arterial contraction-dilation cycle that we observe in the trial-related hæmodynamic signal suggests that it could reflect a novel anticipatory brain mechanism. This mechanism could play the role of preparing cortex for anticipated tasks by bringing additional arterial blood in time for task onsets. The question of the mechanism driving this signal (e.g. distal neuromodulatory control of cerebral arteries?) as well as its functional consequences remains a challenge for future investigations.
Methods Summary
Results were obtained using continuous, dual-wavelength intrinsic-signal optical imaging and electrode recording in two monkeys engaged in either visual fixation tasks or auditory control tasks. Standard alert-monkey optical imaging techniques24 were used to record the intrinsic cortical signal, continuously, through a clear silicone artificial dura and glass-fronted recording chamber implanted over the animals' V1. The primary innovation here consisted of our using two imaging wavelengths. Two arrays of fast, high-intensity LEDs at the two wavelengths (530 nm, 605 nm) were switched on and off alternately in synchrony with the camera, thus illuminating the brain surface alternately with each wavelength on successive camera frames (15 frames / sec). The illumination alternated much faster than typical hæmodynamic signal time scales giving, in effect, simultaneous optical imaging at both wavelengths at 7.5 frames / sec. Increased absorption (darkening) at 530 nm indicated an increase in total hæmoglobin, i.e. ‘blood volume.’ Increased absorption at 605 nm primarily indicated an increase in deoxyhæmoglobin, from a combination of increased deoxygenation and blood volume.
For the dark-room fixation task: in a completely dark room, with a mask covering even the stimulus presentation monitor, the animal was cued to fixate or relax by the colour of a fixation point visible through a pinhole in the mask (size 1-2 arc min), typically switching between equiluminant green (‘fixate’) and red (‘relax’). We dark-adapted alongside the animal to confirm that nothing else was visible. Control experiments confirmed that the trial-related signal was independent of the brightness (range: 10x), colour and size (range: 25x in area) of the fixation point.
All experimental procedures were performed in accordance with the NIH Guide for the Care and Use of Laboratory Animals and were approved by the Institutional Animal Care and Use Committees (IACUC) of Columbia University and the New York State Psychiatric Institute.
Methods
Tasks: Visual fixation
Two monkeys were trained on a variety of visual tasks with a common periodic fixation schedule cued by fixation point colour. The tasks required only passive fixation during ‘fixation on’ for juice reward (Fixation window: 0.5° radius, monitor distance: 133 cm; fix duration: 4 sec within trials of duration ranging from 6 to 30 sec; trial duration typically held fixed for a given experiment; on some experiments, trial timing switched in blocks between 2 or 3 specific values; in other control experiments, randomized by drawing numbers from a homogenous set.). Eye fixation and pupil diameter recorded using IR eye tracker25.
Tasks: Auditory control
(Fig S10), Auditory pitch discrimination task, in a completely dark room (lacking even the fixation point). Trial sequence as follows: Animal pulls lever (start trial) -> fixed delay (range 4 – 10 sec in different experiments), -> auditory tone onset -> delay (typically 4 sec) -> tone changes pitch, cue to release lever as quickly as possible (200 msec), for juice reward. Once the animals learned this task they performed trials in rapid succession. Thus we could determine task periodicity by setting the initial delay from lever pull to tone on. The monkey typically continued looking in the general direction of the fixation point (even though none was present), allowing us to track pupil dilation with the IR camera.
Optical imaging: Surgery, recording chambers, artificial dura
After the monkeys were trained on visual fixation tasks, craniotomies were performed over the animals' V1 and glass-windowed stainless steel recording chambers were implanted, under surgical anaesthesia, using standard sterile procedures24,26, so as to image a ∼10-mm area of V1 covering visual eccentricity ∼1° to 5°. The exposed dura was resected and replaced with a soft, clear silicone artificial dura. After the animals had recovered from the surgery, cortical activity from their V1 was optically imaged, routinely, while the animals engaged in relevant behavioural tasks. Recording chambers and artificial dura were fabricated in our lab using published methods27.
Optical imaging: Hardware
Camera: Dalsa 1M30P (binned to 256 × 256 pixels, 15 frames / sec), Frame Grabber: Optical PCI Bus Digital (Coreco Imaging, Boston, MA). Software developed in our lab based on a system by V. Kalatsky28. Illumination: high-intensity LEDs (Agilent Technologies, Purdy Technologies) emission wavelengths centred at 530 nm & 605 nm, filtered through small individual interference filters (Omega Optical). Lens: ‘macroscope’ of back-to-back camera lenses 29 focused on the cortical surface. Continuous image acquisition, simultaneously recording signals from camera, trial timing and behavioural data (trial onset, stimulus onset, identity and duration etc., eye position, pupil size, timing of fixation breaks, fixation acquisitions, trial outcomes). Analyzed off line using custom software (MATLAB).
Optical imaging: Image processing
All images were first corrected for residual brain movements by aligning each frame to the first frame (shift+rotation30), using blood vessels. Signal means (e.g. in Fig 1b) were obtained by averaging signal over full area, then dividing by the trial-mean of this average giving % signal change as a function of time in a trial. Images of cortical signal (Fig 1a, 4b, supplementary movie) were obtained by aligning image sequences to a selected time point (e.g. trial onset) and averaging, frame by frame, across the set of all correct trials. This gave ‘movies’ of cortical activity at the camera frame rate (7.5 frames / sec at each wavelength). For images of stimulus-evoked responses (Fig 1a. Stimulus: 0.25° bar, flashed on for 1 sec at the start of each fixation trial) each frame in the movie was then divided, pixel by pixel, by the mean pre-stimulus image (5 frames preceding time=0 msec). The ‘Blank’ response in Fig 1a was obtained the same way, at the same time point (3.3 sec post stim onset), but on a fixation trial with no stimulus. For imaging the trial-related signal (Fig 4b, supplementary movie) each frame in the movie was divided, pixel by pixel, by the trial mean (average of all images over one trial duration), rather than pre-stim image, to give the image of fractional signal change relative to the trial mean (Fig 4b, S9). To get time courses of blood vessel signal relative to the mean (Fig 4c) the signal was measured along test lines sampling veins, arteries and ‘parenchyma’ and the ‘parenchyma baseline’ regressed away (Fig S9). To get movies of stimulus-evoked activity, similar movies were obtained of cortical activity aligned to stimulus onset, both for trials with stimulus present (‘stimulated’) and absent (‘blank’). Movie frames were divided by pre-stim baseline of 3-5 frames immediately preceding stimulus onset to get the overall change in cortical activity post stimulus (Fig S1b). Only included trials where the animal maintained fixation correctly.
Visual stimuli for comparing stimulated vs. dark-room responses
Gratings optimized to stimulate the recorded location. Typically 100% contrast, 4c/deg, drifting at 4 deg/sec.
Electrophysiology: Hardware, electronics and analysis
Extracellular electrode recordings (plastic coated tungsten: FHC or tungsten in glass; impedances 300-800KΩ Plexon amplifier and recording software were conducted simultaneously with optical imaging (Fig S1). Penetrations were distributed over imaged V1. Recording sites sampled cortical depths starting from most superficial to ∼1500 microns below the pial surface at 200-400 micron steps (Table S1). The electrode signal was split into ‘spiking’ (100Hz-8KHz bandpass) and ‘Local Field-Potential’ (LFP) (0.7Hz-170Hz). ‘Multi Unit Activity’ (MUA) events were defined as each negative-going crossing of a threshold = ∼ 4x the root mean square (RMS) of the baseline obtained while the animal looked at a grey screen (Fig S1).
Electrophysiology: Data processing
MUA were binned into 16.67 msec bins and aligned to the hæmodynamic traces using simultaneously recorded synch events. LFP data were spectrally decomposed using mtspecgramc (Chronux Toolbox for MATLAB; sliding window of 1 sec, a step size of 250 msec, frequency range from 10 to 130 Hz) and interpolated into a continuous power spectrum aligned to the hæmodynamic traces. 2D spectrograms (Fig 2a. bottom) show the trial-triggered mean LFP power normalized by the mean pre-trial power in the dark signal (2Hz frequency resolution). The LFP timecourse (Fig S4, S6 ‘LFP’) shows the bandpass-filtered power, integrated over each relevant frequency band (‘low-frequency’: 10-56Hz or ‘high-frequency’: 66-130 Hz, avoiding 60Hz).
Electrophysiology: Fitting to Hæmodynamics
For each electrophysiological measure (MUA, low-frequency LFP, high-frequency LFP) the ‘best’ kernel predicting hæmodynamics from concurrent electrophysiology was calculated (Fig S3). Correct trials were extracted from the continuous time series and concatenated into a continuous series. We modelled the hæmodynamic response function (HRF) as a gamma kernel: ; where α = (T / W)2 * 8.0 * log(2.0), β = W2 / T / 8.0 / log(2.0), and A is the amplitude, T is the time to peak, and W is the full width at 75% maximum. We fit the kernel parameters using a downhill simplex algorithm (fminsearch, MATLAB) by comparing the actual hæmodynamic response obtained during stimulated trials to that predicted from a convolution of the HRF with the corresponding spike or gamma-band (66-130 Hz) LFP trace. The algorithm reliably converged to similar temporal HRF parameters across all days (T=2.50 (0.08) sec, W = 1.68 (0.06) sec). The proportion of the variance in the hæmodynamic responses explained by neuronal activity was quantified using the R2 statistic from linear regression of the predicted hæmodynamic trace to the observed trace for both the stimulated and the dark room trials.
Controls for trial timing
We performed control experiments to verify that the observed signals were tied specifically to task-related trial onsets, independent of other timing signals. We confirmed that the signal periodicity was not linked to the animal either acquiring or breaking fixation – the two time points, during each trial, with any change in light on the retina (albeit minuscule). This also ruled out any links to extra-retinal fixation-related V1 activity. We controlled for the rhythmic pupil dilations – for the possibility that cortical signals were being evoked by the accompanying pulse of extra light. Giving the animal simulated pupil dilations – a bright flash in the fixation point – evoked no cortical response. As a control for the possibility that the signal was an accidental match to ongoing oscillations we introduced 20% jitter in trial timing; the signal specifically entrained to trial onsets.
Supplementary Material
Acknowledgements
We thank Karl Korinek for designing and fabricating much of the dual-wavelength optical imaging hardware; Partha P. Mitra for the suggestion of making continuous recordings and the use of the Chronux analysis software; Elizabeth M. C. Hillman for insights into brain hæmodynamic mechanisms; Calvin Ma, Gina Cantone, Justine Ordinario, Elena Glushenkova, W. (Elaine) Zhang, and Mark Bucklin for help with recordings; Eyal Seidemann and Ralph Siegel for technical help during our initial setup; C. D. Gilbert and members of the Mahoney Center and the Center for Theoretical Neuroscience at Columbia for comments on the manuscript. The work was supported by the Keck foundation, grants from the NIH, the Klingenstein Foundation the Gatsby Initiative in Brain Circuitry and the Dana Foundation to AD and an NRSA to YBS.
Footnotes
SupplementaryFigures and SupplementaryMovie are linked to the online version of the paper at www.nature.com/nature.
Reprints and permissions information is available at www.nature.com/reprints.
The authors declare that they do not have any competing financial interests.
Reference List
- 1.Logothetis NK, Wandell BA. Interpreting the BOLD signal. Annu. Rev. Physiol. 2004;66:735–769. doi: 10.1146/annurev.physiol.66.082602.092845. [DOI] [PubMed] [Google Scholar]
- 2.Logothetis NK, Pauls J, Augath M, Trinath T, Oeltermann A. Neurophysiological investigation of the basis of the fMRI signal. Nature. 2001;412:150–157. doi: 10.1038/35084005. [DOI] [PubMed] [Google Scholar]
- 3.Vanzetta I, Grinvald A. Increased cortical oxidative metabolism due to sensory stimulation: implications for functional brain imaging. Science. 1999;286:1555–1558. doi: 10.1126/science.286.5444.1555. [DOI] [PubMed] [Google Scholar]
- 4.Ugurbil K, Toth LJ, Kim D-S. How accurate is magnetic resonance imaging of brain function. Trends Neurosi. 2003;26(2):108–114. doi: 10.1016/S0166-2236(02)00039-5. [DOI] [PubMed] [Google Scholar]
- 5.Shulman RG, Rothman DL, Behar KL, Hyder F. Energetic basis for brain activity: implications for neuroimaging. Trends Neurosi. 2004;27(8):489–495. doi: 10.1016/j.tins.2004.06.005. [DOI] [PubMed] [Google Scholar]
- 6.Heeger DJ, Huk AC, Geisler WS, Albrecht DG. Spikes versus BOLD: what does neuroimaging tell us about neuronal activity? Nat. Neurosci. 2000;3:631–633. doi: 10.1038/76572. [DOI] [PubMed] [Google Scholar]
- 7.Berwick J, et al. Hemodynamic Response in the Unanesthetized Rat: Intrinsic Optical Imaging and Spectroscopy of the Barrel Cortex. J. Cereb. Blood Flow Metab. 2002;22:670–679. doi: 10.1097/00004647-200206000-00005. [DOI] [PubMed] [Google Scholar]
- 8.Goense JBM, Logothetis NK. Neurophysiology of the BOLD fMRI Signal in Awake Monkeys. Curr Biol. 2008;18(9):631–640. doi: 10.1016/j.cub.2008.03.054. [DOI] [PubMed] [Google Scholar]
- 9.Hillman EMC. Optical brain imaging in-vivio: techniques and applications from animal to man. J. Biomed. Opt. 2007;12(5):051402-1–051402-28. doi: 10.1117/1.2789693. [DOI] [PMC free article] [PubMed] [Google Scholar]
- 10.Prahl S. Tabulated Molar Extinction Coefficient for Hemoglobin in Water. 2007. http://omlc. ogi. edu/spectra/hemoglobin/summary. html.
- 11.van der Molen MW, Boomsma DI, Jennings JR, Nieuwboer RT. Does the heart know what the eye sees? A cardiac/pupillometric analysis of motor preparation and response execution. Psychophysiology. 1989;26(1):70–80. doi: 10.1111/j.1469-8986.1989.tb03134.x. [DOI] [PubMed] [Google Scholar]
- 12.Beatty J. Task-evoked pupillary responses, processing load and the structure of processing resources. Psychol Bull. 1982;91(2):276–292. [PubMed] [Google Scholar]
- 13.Nir Y, et al. Coupling between Neuronal Firing Rate, Gamma LFP, and BOLD fMRI Is Related to Interneuronal Correlations. Curr Biol. 2007;17(15):1275–1285. doi: 10.1016/j.cub.2007.06.066. [DOI] [PubMed] [Google Scholar]
- 14.Maier A, et al. Divergence of fMRI and neural signals in V1 during perceptual suppression in the awake monkey. Nat. Neurosci. 2008;11:1193–1200. doi: 10.1038/nn.2173. [DOI] [PMC free article] [PubMed] [Google Scholar]
- 15.Niessing J, et al. Hemodynamic signals correlate tightly with synchronized gamma oscillations. Science. 2005;309:948–951. doi: 10.1126/science.1110948. [DOI] [PubMed] [Google Scholar]
- 16.Belitski A, et al. Low-Frequency Local Field Potentials and Spikes in Primary Visual Cortex Convey Independent Visual Information. J. Neurosci. 2008;28(22):5696–5709. doi: 10.1523/JNEUROSCI.0009-08.2008. [DOI] [PMC free article] [PubMed] [Google Scholar]
- 17.Mayhew JEW, et al. Cerebral vasomotion: a 0.1-Hz oscillation in reflected light imaging of neural activity. NeuroImage. 1996;4:183–193. doi: 10.1006/nimg.1996.0069. [DOI] [PubMed] [Google Scholar]
- 18.Ress D, Backus BT, Heeger DJ. Activity in primary visual cortex predicts performance in a visual detection task. Nat. Neurosci. 2000;3(9):940–945. doi: 10.1038/78856. [DOI] [PubMed] [Google Scholar]
- 19.Shuler MG, Bear MF. Reward timing in the primary visual cortex. Science. 2006;311:1606–1609. doi: 10.1126/science.1123513. [DOI] [PubMed] [Google Scholar]
- 20.Franceschini MA, Joseph DK, Huppert TJ, Diamond SG, Boas DA. Diffuse optical imaging of the whole head. J. Biomed. Opt. 2006;11(5):054007. doi: 10.1117/1.2363365. [DOI] [PMC free article] [PubMed] [Google Scholar]
- 21.Attwell D, Iadecola C. The neural basis of functional brain imaging signals. Trends Neurosi. 2002;25(12):621–625. doi: 10.1016/s0166-2236(02)02264-6. [DOI] [PubMed] [Google Scholar]
- 22.Ogawa S, et al. Intrinsic signal changes accompanying sensory stimulation: functional brain mapping with magnetic resonance imaging. Proc. Natl. Acad. Sci. USA. 1992;89:5951–5955. doi: 10.1073/pnas.89.13.5951. [DOI] [PMC free article] [PubMed] [Google Scholar]
- 23.Glover GH. Deconvolution of impulse response in event-related BOLD fMRI. NeuroImage. 1999;9(4):416–429. doi: 10.1006/nimg.1998.0419. [DOI] [PubMed] [Google Scholar]
- 24.Shtoyerman E, Arieli A, Slovin H, Vanzetta I, Grinvald A. Long-term optical imaging and spectroscopy reveal mechanisms underlying the intrinsic signal and stability of cortical maps in V1 of behaving monkeys. J. Neurosci. 2000;20(21):8111–8121. doi: 10.1523/JNEUROSCI.20-21-08111.2000. [DOI] [PMC free article] [PubMed] [Google Scholar]
- 25.Matsuda K, Nagami T, Kawano K, Yamane S. A new system for measuring eye position on a personal computer. Abstracts, Society for Neuroscience. 2000;26:744.2. Ref Type: Abstract. [Google Scholar]
- 26.Das A, Gilbert CD. Long-Range Horizontal Connections and Their Role in Cortical Reorganization Revealed by Optical Recording of Cat Primary Visual Cortex. Nature. 1995;375:780–784. doi: 10.1038/375780a0. [DOI] [PubMed] [Google Scholar]
- 27.Arieli A, Grinvald A, Slovin H. Dural substitute for long-term imaging of cortical activity in behaving monkeys and its clinical implications. J. Neurosci. Methods. 2002;114:119–133. doi: 10.1016/s0165-0270(01)00507-6. [DOI] [PubMed] [Google Scholar]
- 28.Kalatsky VA, Stryker MP. New paradigm for optical imaging: temporally encoded maps of intrinsic signals. Neuron. 2003;38:529–545. doi: 10.1016/s0896-6273(03)00286-1. [DOI] [PubMed] [Google Scholar]
- 29.Ratzlaff EH, Grinvald A. A tandem-lens epifluorescence macroscope: hundred-fold brightness advantage for wide-field imaging. J. Neurosci. Methods. 1992;36:127–137. doi: 10.1016/0165-0270(91)90038-2. [DOI] [PubMed] [Google Scholar]
- 30.Lucas BD, Kanade T. An Iterative Image Registration Technique with an Application to Stereo Vision (IJCAI). Proceedings of the 7th International Joint Conference on Artificial Intelligence; IJCAI.1981. pp. 674–679. [Google Scholar]
Associated Data
This section collects any data citations, data availability statements, or supplementary materials included in this article.