

Abstract
Asymmetric intracellular signals enable cells to migrate in response to external cues. The multiprotein WAVE (SCAR/WASF) complex activates the actin-nucleating Arp2/3 complex [1-4] and localizes to propagating “waves”, which direct actin assembly during neutrophil migration [5, 6]. Here, we observe similar WAVE complex dynamics in other mammalian cells and analyze WAVE complex dynamics during the establishment of neutrophil polarity. Earlier models proposed that either spatially-biased generation [7] or selection of protrusions [8] enables chemotaxis. These models require existing morphological polarity to control protrusions. Similar spatially-biased generation and selection of WAVE complex recruitment occur in morphologically unpolarized neutrophils during the development of their first protrusions. Additionally, several mechanisms limit WAVE complex recruitment during polarization and movement: intrinsic cues restrict WAVE complex distribution during the establishment of polarity, and asymmetric intracellular signals constrain WAVE complex distribution in morphologically polarized cells. External gradients can overcome both intrinsic biases and control WAVE complex localization. Following latrunculin-mediated inhibition of actin polymerization, addition and removal of agonist gradients globally recruits and releases the WAVE complex from the membrane. Under these conditions the WAVE complex no longer polarizes, despite the presence of strong external gradients. Thus, actin polymer and the WAVE complex reciprocally interact during polarization.
RESULTS AND DISCUSSION
For neutrophils, the WAVE complex is required for motility and polarity, exhibits propagating waves generated through rapid sequential rounds of recruitment and release of the complex from the plasma membrane, and requires actin polymer for its recycling from the plasma membrane [6]. Several pieces of evidence suggest that similar WAVE complex dynamics organize protrusion in other metazoan cells: the WAVE complex is required for the movement and morphogenesis of cells in C. elegans [9], Drosophila [10, 11], and mice [3, 12]; the WAVE complex localizes to the tips of protruding lamellipodia in B16F10 murine melanoma cells [13] (Fig. 1A, Movie S1); and this leading edge localization represents rapidly cycling WAVE complex (half life 8.6 s for WAVE in murine melanoma cells compared to 6.4 s for the Hem-1 component of the neutrophil WAVE complex [6, 14]). To determine whether actin assembly is required for WAVE complex recycling in cells other than neutrophils, we depolymerized the actin cytoskeleton in B16F10 cells expressing a fluorescently tagged subunit of the WAVE complex (Abi1). Actin disassembly resulted in cessation of WAVE complex movement and significant WAVE complex enrichment (2.4 +/-0.3 fold, P < .005) near the plasma membrane (Fig. 1B, Movie S2), suggesting that actin is also required for WAVE complex recycling in these cells. Collectively, these data suggest that the WAVE complex exhibits similar properties in diverse mammalian cells and is likely a general regulator of cell migration throughout metazoans.
Figure 1. Propagating waves of the WAVE complex are mechanistically conserved in other mammalian cells and represent a dynamic quantitative polarity readout in neutrophils.

(A) Representative TIRF timelapse sequences for a B16F10 fibroblast cell migrating on fibronectin expressing Abi1 (a component of the WAVE complex) tagged with YFP. Similar to HL-60 cells, propagating waves of the WAVE complex are observed at the leading edge (Movie S1). (B) Representative Abi1-YFP TIRF timelapse sequences for a migrating B16F10 fibroblast exposed to 10 μM latrunculin at 0 s. Similar to HL-60 cells, B16F10 cells exhibit an enrichment of WAVE complex near the membrane following latrunculin treatment, suggesting a role for actin polymer in WAVE complex recycling (Movie S2). (C) Representative brightfield and Hem1-YFP TIRF timelapse sequences for a HL-60 cell executing a turn in response to a change in the direction of the agonist gradient (Movie S3). (D) Corresponding heatmap shows wave response. Green arrow indicates initial up-gradient direction; red arrow indicates final up-gradient direction. Bars, 5 μm.
WAVE complex dynamics exhibit several features that make them ideal for a quanitative readout of polarity in neutrophils over other internal signals such as the phospholipid PIP3 [15-17] or cell morphology [7, 8, 18]. PIP3 now appears to be dispensable for chemotaxis in neutrophils [19] and Dictyostelium [20]. Morphology results from the integration of many signals. Compared to previous morphological studies [7, 8], our use of TIRF imaging only visualizes the footprint of the cell and is likely to emphasize stabilized protrusions versus protrusions that are unlinked to the surface.
To compare WAVE complex dynamics and cell morphology as readouts for polarity, cells were analyzed following exposure to chemoattractant gradients (Fig. 1C and 1D; Movie S3). We developed automated image analysis software (Fig. S1) to quantify the input/output relation between agonist perturbations and WAVE complex response for a large number of cells. When a micropipette containing agonist was moved to a new location, WAVE complex recruitment changed more dramatically in the following 10 s than did cell morphology (Fig 1C., compare 84 s to 94 s). For quiescent cells exposed to gradients of chemoattractant, significant WAVE complex asymmetry was observed in the absence of obvious morphological polarity (Fig 2B, 14 s time point). These cells were examined to determine how morphological protrusions and WAVE complex behavior relate to the external gradient. Both were highly accurate in predicting the ultimate gradient direction. However, protrusions oscillated significantly around the true gradient direction (SD = 24%), whereas changes in WAVE complex behavior were more precisely aligned with the gradient (SD = 12%). These data suggest that under our stimulation conditions, changes in WAVE complex dynamics represent a more quantitative and robust readout of polarity than cell morphology.
Figure 2. Cells establish Hem-1 wave asymmetry through either focused generation or uniform generation followed by selection.
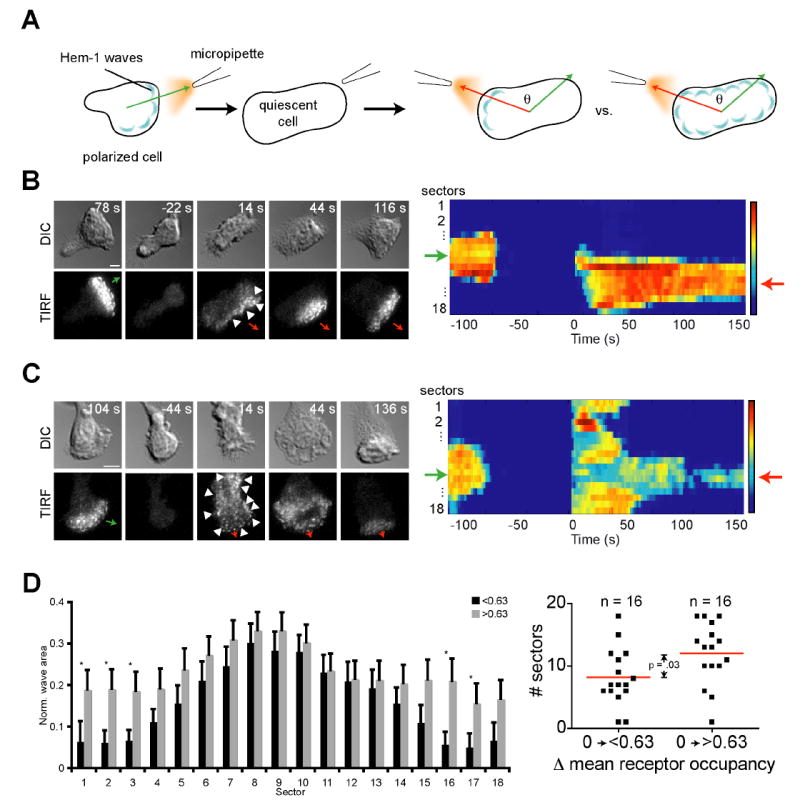
(A) Illustration of experimental setup. An agonist gradient was applied to a cell and then removed. This process was necessary to ensure quiescence because cells adhered to a coverslip often exhibited polarity and motility even in the absence of chemoattractant. Cells were classified as quiescent when they lost all wave dynamics and any obvious morphological front and back. The micropipette was repositioned at a different angle and the gradient reapplied at t = 0 s. Therefore, all cells start with a mean receptor occupancy of 0 for this figure. The angle difference and interval between agonist applications did not affect WAVE complex distribution, nor did the cell retain memory of the original micropipette position after the micropipette was turned back on (Fig. S2). (B and C) Representative DIC and Hem-1-YFP TIRF timelapse sequences and corresponding heatmaps show that cells exhibit a focused (B, Movie S4) or uniform (C, Movie S5) distribution of waves. Note that wave asymmetry is apparent in the absence of any obvious morphological differences (arrowheads). Green arrows indicate initial up-gradient direction; red arrows indicate final up-gradient direction. Bars, 5 μm. (D) Bar graph (left) of a 20 s average of wave response immediately after gradient reapplication. Black bars show response for cells with mean receptor occupancy (post-stimulation) of <0.63. Gray bars indicate cells with mean receptor occupancy (post-stimulation) of >0.63. Error bars are s.e.m. Asterisks indicate statistically significant differences between means of each sector (p <0.05, Student’s t-test). Dot plot (right) shows a statistically significant difference (p = .03, Student’s t-test) between the mean width (red line) of the distributions as defined in Fig. S1.
The establishment of WAVE complex asymmetry was determined by analyzing the signaling response of an initially quiescent cell to chemoattractant (Fig. 2A). Quiescent cells were exposed to a range of agonist increases and split into two equal size populations based on the size of the mean estimated increase in fractional receptor occupancy (see methods; 0.63 was the median increase). Among our micropipette experiments, the average receptor occupancy change correlated better with cell response than did the slope of the gradient (data not shown). Cells exposed to increases in estimated mean receptor occupancy from 0 to < 0.63 responded to the new gradient with focused generation of WAVE complex recruitment (Fig 2B and 2D; Movie S4). For mean receptor occupancy increases greater than 0.63, most cells produced a relatively uniform distribution of WAVE complex recruitment that collapsed into a focused distribution on the up-gradient surface (Fig. 2C and 2D; Movie S5). In both cases, WAVE complex asymmetry ultimately aligns with the external agonist gradient.
Previous analyses of uniformly stimulated neutrophils showed initially uniform signaling responses before cells became polarized [6, 17]. It is unknown whether cells can also produce initially asymmetric signaling in response to uniform stimulation. To test this possibility, the responses of quiescent cells (when cells lost all WAVE complex dynamics and any obvious morphological front and back) were observed. A mean receptor occupancy increase from 0 to 0.1 caused the cells to produce focused WAVE complex recruitment (Fig. 3A and 3C; Movie S6). In contrast, a mean receptor occupancy increase from 0 to 0.7 caused cells to produce a spatially uniform distribution of WAVE complex recruitment that ultimately collapsed into a focused distribution (Fig. 3B and 3C; Movie S7). The first detectable response in either case occurred approximately 12-18 s after stimulation. These data suggest that immediate signaling asymmetries are generated in response to small agonist steps. Previous studies examining the establishment of PIP3 asymmetry [17] and WAVE asymmetry [6] used larger increases in receptor occupancy, conditions that prevent the initially focused recruitment of WAVE complex in response to uniform chemoattractant (Fig. 3B and 3C).
Figure 3. Directional bias limits wave generation in response to small increases in mean receptor occupancy.

(A and B) Initially quiescent cells were subjected to spatially uniform mean receptor occupancy increases from 0 to 0.1 (at t = 0 s), which produced focused waves (A, Movie S6), or 0 to 0.7 (at t = 0 s), which produced a spatially uniform distribution of Hem-1 waves that ultimately collapsed into a focused distribution (B, Movie S7). Bars, 5 μm. (C) Dot plot shows a statistically significant difference (p = .001, Student’s t-test) between the mean width (red line) of the distributions. (D and E) Representative timelapse images of cells with prepolarized WAVE complex distributions responding to spatially uniform increases in mean receptor occupancy from (D) 0.61 to 0.73 (n = 6, Movie S8) or (E) 0.39 to 0.73 (n = 8, Movie S9). (F) Dot plot shows a statistically significant difference (p = 0.002, Student’s t-test) between the changes in wave width for small versus large increases in mean receptor occupancy (note that mean receptor occupancies are statistically different even after removing the outlier for the 0.61 to 0.73 increase). These data suggest that intrinsic directional bias can maintain the asymmetric distribution of Scar/WAVE over a limited range of agonist concentrations in both quiescent and prepolarized cells.
There are several potential mechanisms that could constrain WAVE complex dynamics to a limited region of the cell surface. For instance, upstream molecular asymmetries could act to restrict WAVE complex recruitment to a limited region of the cell surface during the establishment of polarity. An example of this type of internal directional bias is centrosome position, which influences the initial axis of morphological polarity in response to uniform chemoattractant [21]. This sort of intrinsic bias could be responsible for the immediate WAVE complex polarity in response to small steps in uniform chemoattractant (Fig 3A). A second source of internal directional bias could operate during migration. Moving cells have polarized morphologies and intracellular signals, which act as a directional bias to restrict protrusions near the existing leading edge [18, 22]. This type of internal directional bias spatially restricts WAVE complex responses for intermediate increases in mean receptor occupancy (Fig. 3D; Movie S8) in a manner similar to the role of an intrinsic bias during the establishment of polarity. However, larger steps of uniform agonist elicited uniform WAVE complex recruitment (Fig. 3E and 3F; Movie S9), indicating that this bias can be overcome.
During chemotaxis, both an external bias from the agonist gradient and the cell’s intrinsic biases could influence the establishment of WAVE complex asymmetries. In other cell types, such as Dictyostelium, only agonist gradients and not uniform chemoattractant produce signaling polarity [15]. Under these conditions, it is difficult to separate the effects of intrinsic biases from the external gradient. In contrast, neutrophils exhibit signaling polarity in uniform chemoattractant as well as gradients [17], enabling us to determine the role of internal directional bias independent of gradient sensing.
External gradients limit the spatial exent of WAVE complex recruitment for initially quiescent cells (Fig. 2B). Here, external gradients set the final direction of WAVE complex polariy and overwhelm any internal signaling biases within the cell. This occurs for mean receptor occupancy increases less than 0.63. In contrast, under a condition where only internal signaling biases operate, a similar step size (an increase of 0.34), elicited uniform WAVE complex recruitment in polarized cells (Fig. 3E). These data indicate that gradient sensing can overwhelm intrinsic biases and can constrain cell responses over a larger range of agonist increases than intrinsic biases.
Some cues such as PIP3 can polarize in the absence of actin rearrangements [15, 17, 23, 24], but it is unclear whether WAVE complex asymmetry can also be uncoupled from downstream actin-dependent morphological rearrangements. Neutrophils were treated with latrunculin to inhibit actin polymerization. Even in the absence of external agonist, latrunculin transiently increased the concentration of WAVE complex at the membrane (Fig. 4A, 40 s). Under these conditions the WAVE complex still responds to stimulation, although WAVE complex puncta are observed instead of propagating waves. Sudden addition of an agonist gradient increased WAVE complex recruitment (Fig. 4A, 160 and 300 s), whereas removal of agonist caused WAVE complex release from the membrane (Fig. 4A, 200 and 360 s). In latrunculin-treated cells exposed to gradients of chemoattractant, the localization of WAVE complex was relatively uniform (Fig. 4B, 170 and 330 s; Movie S10). Untreated cells typically produced focused WAVE complex recruitment in response to small increases in agonist gradients (Fig. 2B). In contrast, latrunculin-treated cells that experienced a similar increase in receptor occupancy exhibited a significantly wider WAVE complex distribution (Fig. 4C). Therefore, actin polymer, which is generated downstream of the WAVE complex, also appears to be required for the initial generation of WAVE complex asymmetry in neutrophils. Additionally, for control cells exposed to large increases in agonist gradients, the WAVE complex was initially relatively uniform but resolved into a more focused distribution over time. In contrast, this selection mechanism was not apparent over the timescale analyzed in latrunculin-treated cells (Fig. 4D). Furthermore, previous studies implicate actin polymer as a factor that stabilizes signaling components at the membrane [25, 26], whereas our data suggest that actin polymerization can also remove signaling proteins from the membrane.
Figure 4. Actin polymer is required for establishment of Hem-1 wave asymmetry.

(A) Transient fMLP pulses (red trace) induce transient Hem-1-YFP (black trace) accumulation at the membrane. An initially migrating cell was subjected to 20 μM latrunculin treatment to depolymerize the actin cytoskeleton (40 s). This induced Hem-1-YFP recruitment even in the absence of external stimuli. Subsequent fMLP pulses from a micropipette (160 and 300 s) induced further recruitment. When the agonist was removed, Hem-1-YFP quickly disappeared from the membrane. (B) Selected TIRF and DIC images (Movie S10) from the traces shown in (A). Red arrows indicate direction of gradient pulses. Arrowheads indicate areas of significant Hem-1-YFP accumulation at the membrane. Note the broad distribution following each agonist pulse. Bar, 5 μm. (C) Dot plot of a 20 s average of wave response immediately after an agonist pulse for cells untreated (-lat) and treated with 20 μM latrunculin (+lat). There is a statistically significant difference between the mean width (red lines) of the two populations (p = .002, Student’s t-test). (D) Untreated cells that showed an initially broad wave distribution after an agonist pulse were compared to latrunculin-treated cells. The wave distribution in untreated cells converged into a focused distribution, whereas the wave distribution in latrunculin-treated cells did not converge. Error bars are s.e.m. Inset shows statistical significance between the difference in mean sectors (red lines) of the two populations (p = .002, Student’s t-test).
Biochemical fractionation was used to measure WAVE complex enrichment near the plasma membrane as a complement to our TIRF studies. A significant two-fold enrichment of the WAVE complex was observed in the plasma membrane fraction following stimulation and actin depolymerization, indicating that at least some of the TIRF-visible pool of the WAVE complex represents plasma-membrane association (Fig. S3).
CONCLUSIONS
Two models cover how cells reorient polarity during directional migration, and aspects of each apply to how cells initially establish polarity. One model showed that Dicytostelium respond by selectively retaining the pseudopod that experiences the highest agonist concentration, rather than biasing pseudopod generation [8]. In our system, the unit of selection is not a pseudopod, but rather smaller organizing units consisting of WAVE complex recruitment events. In contrast, the local generation model for chemotaxis proposes that the chemotactic behavior of the cell is the sum of local, independent protrusion events all over the surface of the pseudopod [7]. Once a cell is polarized, the probability of a protrusion event occurring in a particular location on the pseudopod depends on the relative local concentration of agonist. Extending this generation-based model to unpolarized cells can explain how a cell can initially bias WAVE complex asymmetry when receptor occupancy is low (~0.1), a phenomenon inexplicable by a selection-based model. However, the generation-based model fails to explain how cells could generate WAVE complex recruitment everywhere and selectively retain WAVE complex recruitment up-gradient; so each model succeeds where the other fails.
We propose a model where local generation events are linked to cellular adaptation machinery. For small increases in agonist, a generation-based mechanism leads to immediately focused polarity. For larger increases in agonist, the generation machinery is saturated, resulting in a uniform WAVE complex distribution. In this case, global adaptation allows the cell to selectively retain WAVE complex recruitment to achieve WAVE asymmetry in a direction set by intrinsic biases or the external gradient. Our model enables the cell to balance rapid polarization (initial signal generation to the up-gradient side) with a more robust polarization (a slower gradual selection of uniform signal distribution, which can occur over a wider range of stimulation conditions). Importantly, the dominant mechanism of polarization depends on the amount of stimulation.
Intriguingly, actin polymerization is essential for WAVE complex polarization during chemotaxis. There are many examples of loss-of-function perturbations of chemotactic signaling that block intracellular signaling responses including PIP3 generation, Ras and Rac activation, actin polymerization, and morphological changes in response to external chemoattractant [5, 26-32]. The WAVE complex is the first example of an intracellular signal that depends on actin polymer for its polarization but not for its global responsiveness to stimulation.
Supplementary Material
A B16F10 fibroblast cell expressing Abi1-YFP was imaged at 37°C by TIRF while migrating on fibronectin. The playback speed is 10 frames/s. This movie corresponds to Figure 1A.
A B16F10 fibroblast cell expressing Abi1-YFP was imaged at 37°C by TIRF while migrating on fibronectin and exposed to 10 μM latrunculin. The playback speed is 10 frames/s. This movie corresponds to Figure 1B.
An HL-60 cell expressing Hem-1-YFP was imaged at 37°C by TIRF and bright-field microscopy once every 2 s (overlay, left; TIRF, right). Note that Hem-1-YFP waves are a more sensitive readout of polarity during a turn than morphology. The playback speed is 10 frames/s. This movie corresponds to Figure 1C.
An initially unpolarized HL-60 cell expressing Hem-1-YFP was suddenly exposed to a formyl-methionyl-leucyl-phenylalanine (fMLP) gradient at t=0 s and imaged at 37°C (Hem-1-YFP TIRF alone, left; overlay, right) by TIRF (green) and differential interference contrast (DIC) microscopy with 2 s frame intervals. Alexa594 dye corresponding to agonist from the micropipette was imaged in TIRF (red). The playback speed is 10 frames/s. This movie corresponds to Figure 2B.
An initially unpolarized HL-60 cell expressing Hem-1-YFP was suddenly exposed to an fMLP gradient at t=0 s and imaged at 37°C (Hem-1-YFP TIRF alone, left; overlay, right) by TIRF (green) and DIC microscopy with 2 s frame intervals. Alexa594 dye corresponding to agonist from the micropipette was imaged in TIRF (red). The playback speed is 10 frames/s. This movie corresponds to Figure 2C.
An initially quiescent HL-60 cell expressing Hem-1-YFP was exposed to a sudden uniform increase in receptor occupancy from 0 to 0.1 at t=0 s and imaged at 37°C by TIRF and DIC microscopy with 6 s frame intervals. The playback speed is 10 frames/s. This movie corresponds to Figure 3A.
An initially unpolarized HL-60 cell expressing Hem-1-YFP was exposed to a sudden uniform increase in mean receptor occupancy from 0 to 0.7 at t=0 s and imaged at 37°C by TIRF and DIC microscopy with 6 s frame intervals. The playback speed is 10 frames/s. This movie corresponds to Figure 3B.
An HL-60 cell expressing Hem-1-YFP was exposed to an increase in mean receptor occupancy from 0.61 to 0.73 delivered at t=0 s and imaged at 37°C by TIRF microscopy with 6 s frame intervals. The playback speed is 10 frames/s. This movie corresponds to Figure 3D.
An HL-60 cell expressing Hem-1-YFP was exposed to an increase in mean receptor occupancy from 0.39 to 0.73 delivered at t=0 s and imaged at 37°C by TIRF microscopy with 6 s frame intervals. The playback speed is 10 frames/s. This movie corresponds to Figure 3E.
An initially unpolarized HL-60 cell expressing Hem-1-YFP was treated with 20μM latrunculin at t=40 s, followed by pulses of fMLP from a micropipette at t=160 and 300 s. Cells were imaged at 37°C by TIRF (green) and DIC microscopy with 2 s frame intervals. Alexa594 dye corresponding to agonist from the micropipette was imaged in TIRF (red). The playback speed is 10 frames/s. The movie corresponds to Figure 4B.
Acknowledgments
We thank John Sedat for image denoising collaboration, the Nikon Imaging Center at UCSF for Matlab analysis software, Scott Foster for leukocyte preparation, and Henry Bourne, Oliver Hoeller, Steve Altschuler, Lani Wu, Max Krummel, Benjamin Rhau, Mark Von Zastrow, Alexander Watters, Sarah Wilson, Bryant Chhun, Delquin Gong, and Julie Wu for helpful comments on the manuscript.
This work was supported by NIH R01 (GM084040), the UCSF/UCB Cell Propulsion lab (an NIH Nanomedicine Development Center), a Searle Scholars Award, an American Heart Association National Scientist Development Grant, a National Defense Science and Engineering Graduate Fellowship to A. Millius, an American Heart Association Graduate Fellowship to A. Houk, and an Achievement Awards for College Scientists (ARCS) Scholarship to S. Dandekar.
List of abbreviations
- DIC
Differential Interference Contrast
- TIRF
Total Internal Reflection Fluorescence
Footnotes
Publisher's Disclaimer: This is a PDF file of an unedited manuscript that has been accepted for publication. As a service to our customers we are providing this early version of the manuscript. The manuscript will undergo copyediting, typesetting, and review of the resulting proof before it is published in its final citable form. Please note that during the production process errors may be discovered which could affect the content, and all legal disclaimers that apply to the journal pertain.
References
- 1.Machesky LM, Insall RH. Scar1 and the related Wiskott-Aldrich syndrome protein, WASP, regulate the actin cytoskeleton through the Arp2/3 complex. Curr Biol. 1998;8:1347–1356. doi: 10.1016/s0960-9822(98)00015-3. [DOI] [PubMed] [Google Scholar]
- 2.Kunda P, Craig G, Dominguez V, Baum B. Abi, Sra1, and Kette control the stability and localization of SCAR/WAVE to regulate the formation of actin-based protrusions. Curr Biol. 2003;13:1867–1875. doi: 10.1016/j.cub.2003.10.005. [DOI] [PubMed] [Google Scholar]
- 3.Steffen A, Rottner K, Ehinger J, Innocenti M, Scita G, Wehland J, Stradal TE. Sra-1 and Nap1 link Rac to actin assembly driving lamellipodia formation. The EMBO journal. 2004;23:749–759. doi: 10.1038/sj.emboj.7600084. [DOI] [PMC free article] [PubMed] [Google Scholar]
- 4.Stradal TE, Scita G. Protein complexes regulating Arp2/3-mediated actin assembly. Current opinion in cell biology. 2006;18:4–10. doi: 10.1016/j.ceb.2005.12.003. [DOI] [PubMed] [Google Scholar]
- 5.Weiner OD, Rentel MC, Ott A, Brown GE, Jedrychowski M, Yaffe MB, Gygi SP, Cantley LC, Bourne HR, Kirschner MW. Hem-1 complexes are essential for Rac activation, actin polymerization, and myosin regulation during neutrophil chemotaxis. PLoS Biol. 2006;4:e38. doi: 10.1371/journal.pbio.0040038. [DOI] [PMC free article] [PubMed] [Google Scholar]
- 6.Weiner OD, Marganski WA, Wu LF, Altschuler SJ, Kirschner MW. An Actin-Based Wave Generator Organizes Cell Motility. PLoS Biol. 2007;5:e221. doi: 10.1371/journal.pbio.0050221. [DOI] [PMC free article] [PubMed] [Google Scholar]
- 7.Arrieumerlou C, Meyer T. A local coupling model and compass parameter for eukaryotic chemotaxis. Developmental cell. 2005;8:215–227. doi: 10.1016/j.devcel.2004.12.007. [DOI] [PubMed] [Google Scholar]
- 8.Andrew N, Insall RH. Chemotaxis in shallow gradients is mediated independently of PtdIns 3-kinase by biased choices between random protrusions. Nature cell biology. 2007;9:193–200. doi: 10.1038/ncb1536. [DOI] [PubMed] [Google Scholar]
- 9.Patel FB, Bernadskaya YY, Chen E, Jobanputra A, Pooladi Z, Freeman KL, Gally C, Mohler WA, Soto MC. The WAVE/SCAR complex promotes polarized cell movements and actin enrichment in epithelia during C. elegans embryogenesis. Dev Biol. 2008 doi: 10.1016/j.ydbio.2008.09.023. [DOI] [PMC free article] [PubMed] [Google Scholar]
- 10.Zallen JA, Cohen Y, Hudson AM, Cooley L, Wieschaus E, Schejter ED. SCAR is a primary regulator of Arp2/3-dependent morphological events in Drosophila. The Journal of cell biology. 2002;156:689–701. doi: 10.1083/jcb.200109057. [DOI] [PMC free article] [PubMed] [Google Scholar]
- 11.Rogers SL, Wiedemann U, Stuurman N, Vale RD. Molecular requirements for actin-based lamella formation in Drosophila S2 cells. The Journal of cell biology. 2003;162:1079–1088. doi: 10.1083/jcb.200303023. [DOI] [PMC free article] [PubMed] [Google Scholar]
- 12.Rakeman AS, Anderson KV. Axis specification and morphogenesis in the mouse embryo require Nap1, a regulator of WAVE-mediated actin branching. Development (Cambridge, England) 2006;133:3075–3083. doi: 10.1242/dev.02473. [DOI] [PubMed] [Google Scholar]
- 13.Hahne P, Sechi A, Benesch S, Small JV. Scar/WAVE is localised at the tips of protruding lamellipodia in living cells. FEBS Lett. 2001;492:215–220. doi: 10.1016/s0014-5793(01)02239-6. [DOI] [PubMed] [Google Scholar]
- 14.Lai FP, Szczodrak M, Block J, Faix J, Breitsprecher D, Mannherz HG, Stradal TE, Dunn GA, Small JV, Rottner K. Arp2/3 complex interactions and actin network turnover in lamellipodia. The EMBO journal. 2008;27:982–992. doi: 10.1038/emboj.2008.34. [DOI] [PMC free article] [PubMed] [Google Scholar]
- 15.Parent CA, Blacklock BJ, Froehlich WM, Murphy DB, Devreotes PN. G protein signaling events are activated at the leading edge of chemotactic cells. Cell. 1998;95:81–91. doi: 10.1016/s0092-8674(00)81784-5. [DOI] [PubMed] [Google Scholar]
- 16.Meili R, Ellsworth C, Lee S, Reddy TB, Ma H, Firtel RA. Chemoattractant-mediated transient activation and membrane localization of Akt/PKB is required for efficient chemotaxis to cAMP in Dictyostelium. The EMBO journal. 1999;18:2092–2105. doi: 10.1093/emboj/18.8.2092. [DOI] [PMC free article] [PubMed] [Google Scholar]
- 17.Servant G, Weiner OD, Herzmark P, Balla T, Sedat JW, Bourne HR. Polarization of chemoattractant receptor signaling during neutrophil chemotaxis. Science. 2000;287:1037–1040. doi: 10.1126/science.287.5455.1037. [DOI] [PMC free article] [PubMed] [Google Scholar]
- 18.Zigmond SH, Levitsky HI, Kreel BJ. Cell polarity: an examination of its behavioral expression and its consequences for polymorphonuclear leukocyte chemotaxis. The Journal of cell biology. 1981;89:585–592. doi: 10.1083/jcb.89.3.585. [DOI] [PMC free article] [PubMed] [Google Scholar]
- 19.Ferguson GJ, Milne L, Kulkarni S, Sasaki T, Walker S, Andrews S, Crabbe T, Finan P, Jones G, Jackson S, et al. PI(3)Kgamma has an important context-dependent role in neutrophil chemokinesis. Nature cell biology. 2007;9:86–91. doi: 10.1038/ncb1517. [DOI] [PubMed] [Google Scholar]
- 20.Hoeller O, Kay RR. Chemotaxis in the absence of PIP3 gradients. Curr Biol. 2007;17:813–817. doi: 10.1016/j.cub.2007.04.004. [DOI] [PubMed] [Google Scholar]
- 21.Xu J, Van Keymeulen A, Wakida NM, Carlton P, Berns MW, Bourne HR. Polarity reveals intrinsic cell chirality. Proc Natl Acad Sci U S A. 2007;104:9296–9300. doi: 10.1073/pnas.0703153104. [DOI] [PMC free article] [PubMed] [Google Scholar]
- 22.Xu J, Wang F, Van Keymeulen A, Herzmark P, Straight A, Kelly K, Takuwa Y, Sugimoto N, Mitchison T, Bourne HR. Divergent signals and cytoskeletal assemblies regulate self-organizing polarity in neutrophils. Cell. 2003;114:201–214. doi: 10.1016/s0092-8674(03)00555-5. [DOI] [PubMed] [Google Scholar]
- 23.Janetopoulos C, Ma L, Devreotes PN, Iglesias PA. Chemoattractant-induced phosphatidylinositol 3,4,5-trisphosphate accumulation is spatially amplified and adapts, independent of the actin cytoskeleton. Proc Natl Acad Sci U S A. 2004;101:8951–8956. doi: 10.1073/pnas.0402152101. [DOI] [PMC free article] [PubMed] [Google Scholar]
- 24.Xu X, Meier-Schellersheim M, Yan J, Jin T. Locally controlled inhibitory mechanisms are involved in eukaryotic GPCR-mediated chemosensing. The Journal of cell biology. 2007;178:141–153. doi: 10.1083/jcb.200611096. [DOI] [PMC free article] [PubMed] [Google Scholar]
- 25.Devreotes P, Janetopoulos C. Eukaryotic chemotaxis: distinctions between directional sensing and polarization. The Journal of biological chemistry. 2003;278:20445–20448. doi: 10.1074/jbc.R300010200. [DOI] [PubMed] [Google Scholar]
- 26.Sasaki AT, Chun C, Takeda K, Firtel RA. Localized Ras signaling at the leading edge regulates PI3K, cell polarity, and directional cell movement. The Journal of cell biology. 2004;167:505–518. doi: 10.1083/jcb.200406177. [DOI] [PMC free article] [PubMed] [Google Scholar]
- 27.Shefcyk J, Yassin R, Volpi M, Molski TF, Naccache PH, Munoz JJ, Becker EL, Feinstein MB, Sha’afi RI. Pertussis but not cholera toxin inhibits the stimulated increase in actin association with the cytoskeleton in rabbit neutrophils: role of the “G proteins” in stimulus-response coupling. Biochem Biophys Res Commun. 1985;126:1174–1181. doi: 10.1016/0006-291x(85)90309-2. [DOI] [PubMed] [Google Scholar]
- 28.Wu L, Valkema R, Van Haastert PJ, Devreotes PN. The G protein beta subunit is essential for multiple responses to chemoattractants in Dictyostelium. The Journal of cell biology. 1995;129:1667–1675. doi: 10.1083/jcb.129.6.1667. [DOI] [PMC free article] [PubMed] [Google Scholar]
- 29.Kumagai A, Hadwiger JA, Pupillo M, Firtel RA. Molecular genetic analysis of two G alpha protein subunits in Dictyostelium. The Journal of biological chemistry. 1991;266:1220–1228. [PubMed] [Google Scholar]
- 30.Sun CX, Downey GP, Zhu F, Koh AL, Thang H, Glogauer M. Rac1 is the small GTPase responsible for regulating the neutrophil chemotaxis compass. Blood. 2004;104:3758–3765. doi: 10.1182/blood-2004-03-0781. [DOI] [PubMed] [Google Scholar]
- 31.Chen L, Iijima M, Tang M, Landree MA, Huang YE, Xiong Y, Iglesias PA, Devreotes PN. PLA2 and PI3K/PTEN pathways act in parallel to mediate chemotaxis. Developmental cell. 2007;12:603–614. doi: 10.1016/j.devcel.2007.03.005. [DOI] [PMC free article] [PubMed] [Google Scholar]
- 32.Veltman DM, Keizer-Gunnik I, Van Haastert PJ. Four key signaling pathways mediating chemotaxis in Dictyostelium discoideum. The Journal of cell biology. 2008;180:747–753. doi: 10.1083/jcb.200709180. [DOI] [PMC free article] [PubMed] [Google Scholar]
Associated Data
This section collects any data citations, data availability statements, or supplementary materials included in this article.
Supplementary Materials
A B16F10 fibroblast cell expressing Abi1-YFP was imaged at 37°C by TIRF while migrating on fibronectin. The playback speed is 10 frames/s. This movie corresponds to Figure 1A.
A B16F10 fibroblast cell expressing Abi1-YFP was imaged at 37°C by TIRF while migrating on fibronectin and exposed to 10 μM latrunculin. The playback speed is 10 frames/s. This movie corresponds to Figure 1B.
An HL-60 cell expressing Hem-1-YFP was imaged at 37°C by TIRF and bright-field microscopy once every 2 s (overlay, left; TIRF, right). Note that Hem-1-YFP waves are a more sensitive readout of polarity during a turn than morphology. The playback speed is 10 frames/s. This movie corresponds to Figure 1C.
An initially unpolarized HL-60 cell expressing Hem-1-YFP was suddenly exposed to a formyl-methionyl-leucyl-phenylalanine (fMLP) gradient at t=0 s and imaged at 37°C (Hem-1-YFP TIRF alone, left; overlay, right) by TIRF (green) and differential interference contrast (DIC) microscopy with 2 s frame intervals. Alexa594 dye corresponding to agonist from the micropipette was imaged in TIRF (red). The playback speed is 10 frames/s. This movie corresponds to Figure 2B.
An initially unpolarized HL-60 cell expressing Hem-1-YFP was suddenly exposed to an fMLP gradient at t=0 s and imaged at 37°C (Hem-1-YFP TIRF alone, left; overlay, right) by TIRF (green) and DIC microscopy with 2 s frame intervals. Alexa594 dye corresponding to agonist from the micropipette was imaged in TIRF (red). The playback speed is 10 frames/s. This movie corresponds to Figure 2C.
An initially quiescent HL-60 cell expressing Hem-1-YFP was exposed to a sudden uniform increase in receptor occupancy from 0 to 0.1 at t=0 s and imaged at 37°C by TIRF and DIC microscopy with 6 s frame intervals. The playback speed is 10 frames/s. This movie corresponds to Figure 3A.
An initially unpolarized HL-60 cell expressing Hem-1-YFP was exposed to a sudden uniform increase in mean receptor occupancy from 0 to 0.7 at t=0 s and imaged at 37°C by TIRF and DIC microscopy with 6 s frame intervals. The playback speed is 10 frames/s. This movie corresponds to Figure 3B.
An HL-60 cell expressing Hem-1-YFP was exposed to an increase in mean receptor occupancy from 0.61 to 0.73 delivered at t=0 s and imaged at 37°C by TIRF microscopy with 6 s frame intervals. The playback speed is 10 frames/s. This movie corresponds to Figure 3D.
An HL-60 cell expressing Hem-1-YFP was exposed to an increase in mean receptor occupancy from 0.39 to 0.73 delivered at t=0 s and imaged at 37°C by TIRF microscopy with 6 s frame intervals. The playback speed is 10 frames/s. This movie corresponds to Figure 3E.
An initially unpolarized HL-60 cell expressing Hem-1-YFP was treated with 20μM latrunculin at t=40 s, followed by pulses of fMLP from a micropipette at t=160 and 300 s. Cells were imaged at 37°C by TIRF (green) and DIC microscopy with 2 s frame intervals. Alexa594 dye corresponding to agonist from the micropipette was imaged in TIRF (red). The playback speed is 10 frames/s. The movie corresponds to Figure 4B.