

Abstract
Motivation: Importance of accurate automatic protein function prediction is ever increasing in the face of a large number of newly sequenced genomes and proteomics data that are awaiting biological interpretation. Conventional methods have focused on high sequence similarity-based annotation transfer which relies on the concept of homology. However, many cases have been reported that simple transfer of function from top hits of a homology search causes erroneous annotation. New methods are required to handle the sequence similarity in a more robust way to combine together signals from strongly and weakly similar proteins for effectively predicting function for unknown proteins with high reliability.
Results: We present the extended similarity group (ESG) method, which performs iterative sequence database searches and annotates a query sequence with Gene Ontology terms. Each annotation is assigned with probability based on its relative similarity score with the multiple-level neighbors in the protein similarity graph. We will depict how the statistical framework of ESG improves the prediction accuracy by iteratively taking into account the neighborhood of query protein in the sequence similarity space. ESG outperforms conventional PSI-BLAST and the protein function prediction (PFP) algorithm. It is found that the iterative search is effective in capturing multiple-domains in a query protein, enabling accurately predicting several functions which originate from different domains.
Availability: ESG web server is available for automated protein function prediction at http://dragon.bio.purdue.edu/ESG/
Contact: cspark@cau.ac.kr; dkihara@purdue.edu
Supplementary information: Supplementary data are available at Bioinformatics online.
1 INTRODUCTION
Developments in genomics and proteomics areas over the last decade have upshot into growing amount of newly sequenced genomes and large-scale experimental data that require computational assistance for predicting functions (Hawkins and Kihara, 2007; Hawkins et al., 2008). Conventionally, sequence homology has been used as the key information source for transferring annotations by comparing the new sequences with a database of annotated genes. Although considering homology is a genuine way of inferring function in the light of evolution, practically, it is not always trivial to extract correct function information from a sequence database search result.
Tian and Skolnick (2003) have observed that enzyme function starts diverging quickly when the sequence identity falls below 70% and E-values from PSI-BLAST are not always strongly correlated to enzyme function conservation. Studies (Devos and Valencia, 2001; Friedberg, 2006) have shown that the traditional annotation transfer methods may be reliable for very high sequence similarity but are likely to be erroneous in many situations. Even though sequence similarity strongly indicates functional similarity in many cases (Duan et al., 2006), methods for interpreting results of homology search needs to be expanded to consider weakly similar hits. Concepts of phylogenetic similarity, structural similarity and functional similarity are not necessarily interchangeable with the sequence homology, and these terms map imperfectly with each other (Fitch, 2000). It was demonstrated that non-critical transfer of annotations from similar sequences while ignoring the multi-domain architecture can result in serious prediction inaccuracies (Galperin and Koonin, 1998).
To capture the complex relation between sequence similarity and function, many methods have been developed. John and Sali (2004) and Park et al. (1997) have explored the concept of using an intermediate sequence to relate two weakly similar proteins that can be potential homologs. Song et al. (2008) have developed a method based on sequence homology network that compares local neighborhood network of proteins for deciding the functional similarity.
Recently, there have been efforts on developing automatic function prediction methods which are built on BLAST (Altschul et al., 1990) and PSI-BLAST. OntoBlast (Zehetner, 2003) uses the E-values of sequence hits in a BLAST search to score Gene Ontology (GO) terms. GOFigure (Khan et al., 2003) and GOtcha (Martin et al., 2004) incorporate the hierarchical structure of GO vocabulary (Harris et al., 2004) for scoring parental GO terms in the hierarchy. GOAnno (Plewniak et al., 2003) extracts GO terms from subfamilies of a multiple sequence alignment. GOPET (Vinayagam et al., 2006) and ProtFun (Jensen et al., 2003) apply support vector machine to sequence similarity features obtained from a BLAST search. We have previously developed protein function prediction (PFP) (Hawkins et al., 2006, 2009) that incorporates E-value-based scoring of GO terms along with the functional association between GO terms and parental GO term scoring. PFP is very successful, which is evidenced by the top rank in the function prediction category in AFP-SIG 05 (Friedberg et al., 2006) and CASP7 (Lopez et al., 2007) competitions.
Here, we report our new method, extended similarity group (ESG), which is shown to significantly outperform PFP and conventional PSI-BLAST search in a large benchmark dataset of 2400 genes. In addition, we find that the iterative search is able to capture functions of a protein, which originate from multiple functional domains in the sequence.
2 METHODS
ESG uses PSI-BLAST (Altschul et al., 1997) (version 2.2.18) as a sequence database search tool. The maximum number of passes is set to three (−j 3). The default inclusion E-value is used (−h 0.005). As described below, ESG assigns a probability to GO terms based on the sum of relative significance of E-value of sequences annotated with the GO terms.
2.1 Computing the annotation probability
We begin with N sequences retrieved by performing PSI-BLAST search with the query sequence Q (Fig. 1A). This is called the first level of extended similarity group, from which searches are further iterated. The sequences obtained by PSI-BLAST search from the first-level ESG sequences are called the second-level ESG sequences and so on for the next levels. Thus, ESG covers multiple-level neighborhoods around the query protein. For each query protein Q, we define the probability that Q has a particular GO annotation fa, and this direct probability is given by PQd (fa). Here, we use two level neighbors but computations can be extended for multiple levels with an exponential increase of computation time with respect to N.
Fig. 1.

(A) ESG computation with one level. Sequences S1 to SN are retrieved by PSI-BLAST search. (B) ESG with two levels. The second round of PSI-BLAST searches are performed from each of the sequences, S1 to SN.
2.2 ESG level one computation
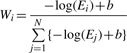
Let S1, S2, …, SN be the PSI-BLAST hit sequences for Q each with E-values E1, E2, …, EN, respectively (Fig. 1A). Every sequence gets a weight equal to its relative E-value with respect to the E-values of all N sequences [Equation (1)]. In the computation of weights, we use sequences with an E-value of up to 1000. The score is shifted by a constant, b, which is given by log(1000) to make the score a non-negative value. Using the binary function ISi (fa) [Equation (2)], the direct probability PQd(fa) for each annotation fa assigned to Si is the sum of weights of sequences with the annotation fa [Equation (3)].
 |
(1) |
| (2) |
| (3) |
2.3 ESG multilevel computation
For probability computation using two level neighbors of query sequence Q, we perform the second iteration of PSI-BLAST search from each of the sequences Si obtained at the first level (Fig. 1B). Thus, from each sequence Si we obtain Ni sequences, Sij (1 ≤j≤Ni). Each of these sequences has a weight Wij, which is computed by applying Equation (1) to the PSI-BLAST search from Si. Weight Wi of sequence Si at first level is distributed between sequence Si and all its child nodes Sij using a stage weight parameter v (0 ≤ v ≤ 1). This parameter decides the proportion of Wi that is allocated to Si itself and its children together [Equation (4)].
| (4) |
| (5) |
To compute the final PQd (fa) the weights of sequences at two ESG levels that have annotation fa are summed up in proportion of step weights as shown in Figure 1B and Equation (5). Equations described here can be easily extended for more number of iterative levels.
2.4 ESG with function association matrix
Function association matrix (FAM) is used by PFP to capture observed correlation between GO terms in the annotation database. GO annotations have a hierarchical structure with three distinct annotation categories, i.e. molecular function, biological process and cellular component. Some of these terms even pairs across different categories frequently occur together in the database to annotate the same protein. FAM captures association of two GO terms, fa and fj, as a conditional probability:
| (6) |
where c(fa, fj) is the number of times fa and fj are assigned simultaneously to a sequence and c(fj) is the total number of times fj appeared in UniProt. μ is the size of one dimension of the FAM (i.e. the total number of unique GO terms), and ε is the pseudo-count (we used 0.05 for ε).
| (7) |
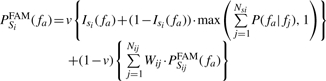
When using the two level system as described previously, we follow Equation (7) together with Equation (4) except for replacing the probability scores PSijd (fa) coming from each sequence hit Si by FAM probability PSiFAM (fa). In Equation (8), we compute the FAM probability for sequence Si. Isi (fa) is the binary function [Equation (2)], fj are annotations of Si, P(fa|fj) is the FAM [Equation (6)], NSi is number of GO annotations for Si, v is the stage weight parameter. For the FAM probability given to the sequences found in the second level, i.e. PSijFAM(fa), Equation (9) is used. Equations (8) and (9) show that FAM is used only when the sequence Si is not annotated with fa (i.e. ISi (fa)=0).
 |
(8) |
| (9) |
In all the FAM computations, only the strong associations with a conditional probability,P(fa|fj), of >0.7 are considered.
2.5 Top PSI-BLAST method
In the Top PSI-BLAST method, PSI-BLAST search is performed with a default setting with maximum of three iterations. Then the top hit with an E-value score better than 0.01 that has annotations is used for transferring annotations to the query sequence.
2.6 PFP method
PFP uses PSI-BLAST to retrieve sequences similar to query sequence and assigns scores to GO terms associated with these hits based on E-values. It also incorporates FAM that captures association between GO terms.
| (10) |
Each GO term is assigned a score as shown in Equation (10), where s(fa) is the final raw score assigned to the GO term, fa, N is the number of sequences retrieved by PSI-BLAST, Nfunc(i) is the number of GO terms assigned to sequence j, E-value(i) is the E-value for sequence i and P(fa |fj) is the FAM score [Equation (6)]. Using the raw score distributions for each GO term in a benchmarking dataset, PFP computes a P-value and the expected accuracy from the P-value for the predicted GO terms. Here, we use predicted GO terms with an expected accuracy of 0.8 or higher.
2.7 Sequence database with GO annotations
PSI-BLAST searches needed for ESG, PFP and Top-PSIBLAST method are run against UniProt sequence database (Bairoch et al., 2005). Then, GO terms associated to gene IDs are taken from the GO Consortium database (Ashburner et al., 2000) version go_200804. Thus, the same sequence database and the same setting are used for genes of any organisms. Along with the annotation, we also use the evidence codes in the analysis shown in Figure 4. In the evidence code, Inferred from Electronic Annotations (IEAs) are those obtained from some computational method without any experimental evidences.
Fig. 4.

The funsim score for benchmarking set with and without IEAs across the 12 different organisms. Probability cutoff of 0.35 is used.
2.8 Prediction accuracy
We evaluate prediction accuracy by the modified funsim semantic similarity measure (Hawkins et al., 2009), and also by precision and recall. The funsim score previously proposed (Schlicker et al., 2006) is modified to include evaluation of GO terms in the cellular component category. The funsim score is explained below.
2.9 The funsim semantic similarity score
The funsim score uses the frequency of GO terms, freq(c), in the database as its basis [Equation (11)]. annot(c) is the number of times GO term c occurs in the database to annotate different sequences and children(c) is the list of child nodes of term c in the GO hierarchy. Probability for a GO term c is given by Equation (12).
| (11) |
| (12) |
The similarity of two GO terms is computed by Equation (13), where S(c1, c2) is the set of common ancestors of terms c1 and c2 in GO hierarchy. The multiplier (1 − p(c)) is to give less importance to a frequently occurring term.
| (13) |
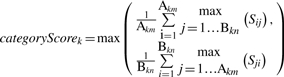
Now consider two sets of GO terms, GOA and GOB, to be compared (e.g. GOA is predicted GO terms and GOB is the correct terms). For each category we compute sim(c1, c2) separately, comparing pairs of terms from GOA and GOB, to form the matrix (Sij) [Equation (14)]. Akm and Bkn is the number of terms in the set GOA and GOB in the category k, respectively. Then, the maximum of the average score of row max or column max is selected as the categoryScore for the category, k [Equation (15)].
| (14) |
for category k, i = 1 to Akm and j = 1 to Bkn
 |
(15) |
Finally, the funsim score between two sets of GO terms is defined as follows. Unlike Schlicker's method all the three GO categories are compared. The maximum score in each category is set to 1.
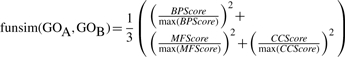 |
(16) |
Since funsim score matches each term from one set to any one term from other set and takes average scores from such matches, it penalizes over prediction.
2.10 Precision and recall computations
Along with funsim score we also use precision and recall for evaluation. Precision is defined as TP/(TP + FP) and recall is defined as TP/(TP + FN), where TP and FP denote true and false positive, respectively, and FN denotes false negative. For computing precision and recall, we consider exact match between predicted terms and the actual annotations of the sequence.
2.11 Benchmark dataset
We compare performance of function prediction accuracy on a benchmark dataset of 200 protein sequences each from the following 12 different species in the GO database: Arabidopsis thaliana, Bos taurus, Caenorhabditis elegans, Drosophila melanogaster, Danio rerio, Escherichia coli, Gallus gallus, Homo sapiens, Mus musculus, Pseudomonas aeruginosa, Rattus norvegicus and Saccharomyces cerevisiae. Thus, there are in total of 2400 sequences. In each genome, 200 proteins are randomly selected from those which have at least one sequence hit with GO annotations within the E-value of 0.01 by PSI-BLAST against the GO database, in order for the Top PSI-BLAST method to be able to provide function prediction to all the sequences. This dataset is available at our web site (http://dragon.bio.purdue.edu/ESG/testdata/).
3 RESULTS
3.1 Prediction accuracy of ESG
We have run ESG with two levels and at each level we have selected the top N = 50 hits obtained by PSI-BLAST search. The stage weight v is set to 0.5. Unless specified, ESG only uses direct probability, but without FAM [i.e. Equation (5)].Figure 2 shows the precision–recall curve for ESG predictions. With the probability cutoff of 0.35, fairly optimum precision of 68% and recall of 58% are obtained. For higher probability cutoffs above 0.35, there was no strong increase in the precision but the recall was falling sharply. At higher cutoffs, the number of terms predicted was less as compared with the false negatives in the prediction.
Fig. 2.

Precision–recall curve of ESG predictions. Crosses show the data points with the probability cutoff of 0.35.
Figure 3A compares performance of ESG with PFP and the Top PSI-BLAST method. We used two probability cutoff values, 0.35 and 0.15 for ESG. Among the methods compared, ESG shows the best funsim score of 0.697 with the cutoff of 0.15. With the probability cutoff of 0.35, the average funsim score decreased to 0.683, but it is still better than the performance of PFP and the Top PSI-BLAST. The average funsim score of PFP and the Top PSI-BLAST is 0.574 and 0.452, respectively. According to Schlicker et al. (2006), the funsim scores in the range of 0.5–0.7 indicate that GO terms are functionally related. It is very interesting that ESG achieves better performance than PFP without using FAM (PFP is using FAM). We also compared the three methods by the funsim score with only using MF and biological process (BP) categories, since GO terms in cellular component (CC) category is relatively less developed (the total number of terms in MF, BP and CC is 8827, 15131 and 2182, respectively). ESG again performs the best but the probability cutoff of 0.35 for ESG now shows a marginally better performance than 0.15: the average funsim score of ESG (with cutoff 0.35), ESG (0.15), PFP and the Top PSI-BLAST is 0.718, 0.717, 0.601 and 0.465, respectively. The graph is available in the Supplementary Material. This result clearly shows that extensive use of information retrieved from PSI-BLAST sequence search result (by considering very weak hits: ESG and PFP; by extending search space by iterative database search: ESG; considering GO term association by FAM: PFP) significantly contributes in improving function prediction accuracy.
Fig. 3.

Prediction accuracy measured by the funsim score. (A) Average funsim scores for ESG, PFP and Top PSI-BLAST for benchmarking dataset across 12 species. (B), Comparison with GOPET with funsim score using MF terms only.
In Figure 3B, we further compare the three methods with GOPET, a SVM-based GO prediction method. As its available program only computes GO terms in the MF category, this comparison is made in MF. ESG with the cutoff of 0.15 shows the best performance (0.706), and GOPET and ESG with cutoff of 0.35 follow with the score of 0.705 and 0.690, respectively. Moreover, note that we compared PFP with GOtcha and InterProScan (Mulder and Apweiler, 2007) in our previous work (Hawkins et al., 2009) and showed that PFP performs significantly better than them (Figs 7 and 8 in the paper).
Fig. 7.

Domain assignment accuracy.
Fig. 8.

Heatmap representation of sequence hits by ESG for a query sequence, P76216. The left most column shows sequence hits by the first-level ESG search sorted by the E-value. Each row represents one sequence. The top 50 sequences used as queries in the second-level search are surrounded by a thick rectangle. Sequences below the thick rectangle have an E-value between 10 and 13. The second-level search results from each of the 50 sequences are visualized in the next 50 columns. In columns of the second-level search, gray boxes indicate that the sequences found in the first-level search reappeared in the second-level search. Black boxes at the right side of each row indicate that the sequence representing the row has annotation common with the query. The figure represents the top part of sequences obtained in the ESG computation.
Next, we examine ESG's performance on two sets of sequences, one set with IEA and one without IEA(Fig. 4). The 200 sequences for each organism are randomly selected for both with/without IEA. This test is performed because predicting electronic annotation (i.e. IEA) by another electronic method, ESG, may seem tautological and thus seem trivial. It is shown that the funsim score of sequences with and without IEA are almost the same, around 0.68. Therefore, good performance of ESG (Fig. 4) is not biased by sequences with IEA.
At last in this section, we examine the effect of different levels of iterations. We ran iterations up to 3 with N = 10 on the 200 E.coli genes without IEA. The resulting funsim score was 0.693, 0.696 and 0.693, for 1, 2 and 3 levels, respectively. This result indicates that ESG with two levels is quite optimal and further iterations probably may not improve the accuracy.
3.2 Comparison of precision and recall values
In addition to the funsim score, we also computed precision and recall using exact matches with the actual database annotations (Fig. 5). ESG shows significantly higher average precision of 0.67 as compared with those of PFP (0.10) and Top PSI-BLAST (0.10). In terms of recall, ESG again shows overall the best performance over the other two methods (PFP shows a slightly better performance on the C.elegans dataset). However, the margin of ESG over PFP is shrunken. The average recall for ESG, PFP and Top PSI-BLAST is 0.60, 0.50 and 0.12, respectively. We find that the key advantage of ESG is the much smaller number of GO terms predicted by ESG (on average 7) as compared with PFP (on average 56), giving fewer false positives and maintaining high precision value. Top PSI-BLAST gives 11 predicted GO terms on average, while the database annotations have on an average of 10 terms for each protein. Narrowing to the minimum set of correct prediction by ESG eliminates over predictions and is a main reason for the high funsim scores shown in Figure 3.
Fig. 5.

Precision and recall values for ESG, PFP and Top PSI-BLAST.
3.3 Prediction accuracy for ESG with FAM
Next, we examine the effect of FAM on function prediction of ESG. Recall that FAM is not incorporated to ESG, but has been incorporated to PFP in the results so far shown. The testing ESG with FAM is performed on the 200 E.coli genes, because the computational time increases significantly when FAM is integrated in ESG. For example, in a typical case of an ESG run without FAM takes about 15–20 min, while it increases to 2 h or more when FAM is used. FAM is added in following Equations (7–9).
As shown in Table 1, when FAM is incorporated, precision of ESG falls from 0.794 to 0.566. But at the same time recall improves from 0.773 to 0.810. Reflecting the drop of precision, the funsim score is slightly deteriorated by using FAM from 0.726 to 0.711. FAM brings in additional information of GO term association mined from the sequence database. Therefore, generally using FAM results in predicting more GO terms. The average number of GO terms predicted with FAM by ESG is 12.3 as compared with 7.3 when predicting without FAM. This fact accounts for the decrease in precision and the increase in recall by incorporating FAM. The average number of predicted GO terms by ESG without FAM is same as that of Top PSI-BLAST. In contrast, PFP makes significantly larger number of predictions (i.e. 56.5 on average) using the threshold expected accuracy value of 0.8, which result in a low precision of 0.111.
Table 1.
Prediction accuracy comparisons on the E.coli dataset
| Method | Precision | Recall | funsim | Average no. of terms predicted |
|---|---|---|---|---|
| ESG with FAM | 0.566 | 0.810 | 0.711 | 12.3 |
| ESG without FAM | 0.794 | 0.773 | 0.726 | 7.3 |
| PFP | 0.111 | 0.518 | 0.565 | 56.5 |
| Top PSI-BLAST | 0.112 | 0.104 | 0.204 | 8.2 |
3.4 Protein with multiple functional domains
In analyzing prediction results of ESG closely, we found that ESG's iterative search scheme is often effective in capturing multiple functional domains of a protein. When a query sequence has multiple domains, each sequence hit of the first level of PSI-BLAST search shares at least one common domain with the query. Then, the second-level search starting from each first-level hit can boost the score of a domain by identifying more sequences that share the domain. Such examples of proteins where conventional BLAST search assigns false positive annotations due to their multiple domains are shown in Figure 6 (Song et al., 2008). PDGFRB and PRKG1 have a statistically significant alignment with an E-value of 2e-13. They have protein kinase domain in common, while Ig-like C2-type domains are unique to PDGFRB and cyclic nucleotide binding domains are unique to PRKG1. Now PDGFRB and NCAM2 have a significant alignment with an E-value of 1e-8, having Ig-like C2-type domains in common. Although the two proteins, PRKG1 and NCAM2, have a significant E-value with PDGFRB, their functionalities differ due to the presence of other unique domains to each protein: PDGFRB is β-type platelet-derived growth factor receptor and PRKG1 is cGMP-dependent protein kinase 1, both of which are involved in protein amino acid phosphorylation. NCAM2 with Fibronectin type III domains is unique in the sense that it involves in neural cell adhesion. In this example, the E-value, the alignment coverage, the number of shared domains, length of alignments, etc., are not sufficient for correctly establishing the fact that NCAM2 is involved in different biological process though it shares the common domain with PDGFRB (Song et al., 2008).
Fig. 6.

Domain structure of PDGFRB, PRKG1 and NCAM2 (figure is not drawn to the exact scale of the proteins).
Interestingly, ESG correctly assigns function to these proteins. ESG predicts correct function for NCAM2 as involved in ‘cell adhesion’ with probability 0.9. The ‘protein amino acid phosphorylation’ is predicted with a low probability of 0.25, which is below the cutoff used. ESG predicted nine terms, while PFP predicts 33 terms that contain the term ‘protein kinase activity’ with an expected accuracy of 0.979, even though kinase domain is not present in NCAM2. For protein PRKG1 both ESG and PFP predict the correct terms indicating that the protein is involved in cyclic nucleotide-dependent kinase activity, with ESG predicting total seven terms and PFP predicting 48 terms.
In Figure 7, we further investigated domain prediction accuracy by ESG compared with Top PSI-BLAST on the entire benchmark dataset. Pfam domains are assigned to sequences in the benchmark dataset by referring to the Uniprot database, which gives a list of Pfam domains for a given gene sequence. Then, a set of predicted GO terms for a sequence are mapped to corresponding Pfam domains using a GO to Pfam correspondence table available at the GO database. Assuming that the set of Pfam domains are predicted by ESG (or Top PSI-BLAST), these predicted domains are compared with the domains assigned to each sequence to compute the recall. Figure 7 shows that ESG captures more correct domains as compared with Top PSI-BLAST. Note that it is very difficult to compute precision of the methods in terms of Pfam domains because Pfam domains and GO terms have many-to-many relationship.
4 DISCUSSION
In this article, we described a novel function prediction algorithm, ESG, which extracts function annotation from the sequence similarity space that is extended by the iterative database search. To clarify characteristics of ESG, we compared performance of ESG with two other methods, the Top PSI-BLAST method and PFP. Top PSI-BLAST represents the typical homology search used in large-scale genome annotation where annotation is transferred to the query protein from the most significant hit in a search. PFP is a previously developed method by our group that was proved successful in automated function prediction. On the benchmarking dataset of 2400 sequences taken from 12 organisms, ESG consistently showed the best funsim score among the three methods. Top PSI-BLAST performed significantly worse than ESG and PFP.
At this juncture, we briefly discuss differences in design and concept of PFP and ESG. PFP extracts relevant GO annotation even from sequences with insignificant E-values by summing up scores reflecting the E-value of sequences. FAM further expands PFP's sensitivity to capture related GO terms. ESG, in contrast, limits GO terms to predict, by examining consistency of appearance of the GO terms in a number of searches in the vicinity of the query sequence on the sequence similarity space. Thus, PFP is designed to enhance sensitivity, while ESG has better precision for GO term prediction. Another difference is that ESG assigns probability to predicted GO terms using a rigorous statistical framework as opposed to PFP, which assigns a custom PFP score to GO terms and computes the P-value from background distribution of the custom PFP score.
Biological implication by the success of ESG and PFP is that there exist functional commonalities among proteins which are not traditionally considered as homologous, and importantly, such common function can be captured by making use of very weakly similar sequences in a database search. To exemplify this statement, ESG search for a query protein, P76216, is examined. P76216 is involved in biological processes GO:0019544 arginine catabolic process to glutamate, GO:0006525 arginine metabolic process and GO:0006950 response to stress. And it has molecular functions GO:0009015 N-succinylarginine dihydrolase activity, GO:0005515 protein binding, and GO:0016787 hydrolase activity. ESG could predict all terms except for GO:0005515 with the probability cutoff of 0.35. Figure 8 illustrates that many sequences with an insignificant E-value hold common annotation to the query and some of them are recaptured by the second-level searches. Out of the 1615 sequences found, 268 have common annotations to the query. Note that this hit rate is far better than random: a randomly selected set of same size from the database contain 112 proteins that had at least one common annotation.
There is a strong need for accurate automatic function prediction methods as the number of sequenced genomes is rapidly increasing. Various efforts have been made to address this goal including classification of large protein sequence space (Kaplan et al., 2005; Loewenstein and Linial, 2008), considering protein structures (Yeats et al., 2008), and pathway data (Kanehisa et al., 2008). A recent trend is to consider heterogeneous experimental data sources such as microarray and protein–protein interaction. Although such new data can provide additional function information, obviously major sources of function information reside in sequence databases. Thus, sequence-based methods should remain at the center of gene function annotation and it needs to be re-examined with a fresh perspective to investigate the complex relationship between sequence and functional similarity. ESG together with PFP shows a promising future direction with strong evidences that there are still rich sources of functional information in weakly similar sequences, which are previously underestimated.
Funding: National Institutes of Health (GM075004 and GM077905 in parts); National Science Foundation (DMS0604776 and DMS800568 in parts). CP was supported by the Chung-Ang University Research Grants in 2008.
Conflict of Interest: none declared.
REFERENCES
- Altschul SF, et al. Basic local alignment search tool. J. Mol. Biol. 1990;215:403–410. doi: 10.1016/S0022-2836(05)80360-2. [DOI] [PubMed] [Google Scholar]
- Altschul SF, et al. Gapped BLAST and PSI-BLAST: a new generation of protein database search programs. Nucleic Acids Res. 1997;25:3389–3402. doi: 10.1093/nar/25.17.3389. [DOI] [PMC free article] [PubMed] [Google Scholar]
- Bairoch A, et al. The Universal Protein Resource (UniProt) Nucleic Acids Res. 2005;33:D154–D159. doi: 10.1093/nar/gki070. [DOI] [PMC free article] [PubMed] [Google Scholar]
- Devos D, Valencia A. Intrinsic errors in genome annotation. Trends Genet. 2001;17:429–431. doi: 10.1016/s0168-9525(01)02348-4. [DOI] [PubMed] [Google Scholar]
- Duan ZH, et al. The relationship between protein sequences and their gene ontology functions. BMC Bioinformatics. 2006;7(Suppl. 4):S11. doi: 10.1186/1471-2105-7-S4-S11. [DOI] [PMC free article] [PubMed] [Google Scholar]
- Fitch WM. Homology a personal view on some of the problems. Trends Genet. 2000;16:227–231. doi: 10.1016/s0168-9525(00)02005-9. [DOI] [PubMed] [Google Scholar]
- Friedberg I. Automated protein function prediction - the genomic challenge. Brief Bioinform. 2006;7:225–242. doi: 10.1093/bib/bbl004. [DOI] [PubMed] [Google Scholar]
- Friedberg I, et al. New avenues in protein function prediction. Protein Sci. 2006;15:1527–1529. doi: 10.1110/ps.062158406. [DOI] [PMC free article] [PubMed] [Google Scholar]
- Galperin MY, Koonin EV. Sources of systematic error in functional annotation of genomes: domain rearrangement, non-orthologous gene displacement and operon disruption. In Silico Biol. 1998;1:55–67. [PubMed] [Google Scholar]
- Harris MA. The gene ontology (GO) database and informatics resource. Nucleic Acid Res. 2004;32:D258–D261. doi: 10.1093/nar/gkh036. [DOI] [PMC free article] [PubMed] [Google Scholar]
- Hawkins T, Kihara D. Function prediction of uncharacterized proteins. J. Bioinform. Comput. Biol. 2007;5:1–30. doi: 10.1142/s0219720007002503. [DOI] [PubMed] [Google Scholar]
- Hawkins T, et al. Enhanced automated function prediction using distantly related sequences and contextual association by PFP. Protein Sci. 2006;15:1550–1556. doi: 10.1110/ps.062153506. [DOI] [PMC free article] [PubMed] [Google Scholar]
- Hawkins T, et al. New paradigm in protein function prediction for large scale omics analysis. Mol. Biosyst. 2008;4:223–231. doi: 10.1039/b718229e. [DOI] [PubMed] [Google Scholar]
- Hawkins T, et al. PFP: automated prediction of gene ontology functional annotations with confidence scores using protein sequence data. Proteins. 2009;74:556–582. doi: 10.1002/prot.22172. [DOI] [PubMed] [Google Scholar]
- Jensen LJ. Functionality of system components: conservation of protein function in protein feature space. Genome Res. 2003;13:2444–2449. doi: 10.1101/gr.1190803. [DOI] [PMC free article] [PubMed] [Google Scholar]
- John B, Sali A. Detection of homologous proteins by an intermediate sequence search. Protein Sci. 2004;13:54–62. doi: 10.1110/ps.03335004. [DOI] [PMC free article] [PubMed] [Google Scholar]
- Kanehisa M, et al. KEGG for linking genomes to life and the environment. Nucleic Acids Res. 2008;36:D480–D484. doi: 10.1093/nar/gkm882. [DOI] [PMC free article] [PubMed] [Google Scholar]
- Kaplan N, et al. ProtoNet 4.0: a hierarchical classification of one million protein sequences. Nucleic Acids Res. 2005;33:D216–D218. doi: 10.1093/nar/gki007. [DOI] [PMC free article] [PubMed] [Google Scholar]
- Khan S, et al. GoFigure: automated Gene Ontology annotation. Bioinformatics. 2003;19:2484–2485. doi: 10.1093/bioinformatics/btg338. [DOI] [PubMed] [Google Scholar]
- Loewenstein Y, Linial M. Connect the dots: exposing hidden protein family connections from the entire sequence tree. Bioinformatics. 2008;24:i193–i199. doi: 10.1093/bioinformatics/btn301. [DOI] [PubMed] [Google Scholar]
- Lopez G, et al. Assessment of predictions submitted for the CASP7 function prediction category. Proteins. 2007;69:165–174. doi: 10.1002/prot.21651. [DOI] [PubMed] [Google Scholar]
- Martin DM, et al. GOtcha: a new method for prediction of protein function assessed by the annotation of seven genomes. BMC Bioinformatics. 2004;5:178. doi: 10.1186/1471-2105-5-178. [DOI] [PMC free article] [PubMed] [Google Scholar]
- Mulder N, Apweiler R. InterPro and InterProScan: tools for protein sequence classification and comparison. Methods Mol. Biol. 2007;396:59–70. doi: 10.1007/978-1-59745-515-2_5. [DOI] [PubMed] [Google Scholar]
- Park J, et al. Intermediate sequences increase the detection of homology between sequences. J. Mol. Biol. 1997;273:349–354. doi: 10.1006/jmbi.1997.1288. [DOI] [PubMed] [Google Scholar]
- Plewniak F, et al. PipeAlign: a new toolkit for protein family analysis. Nucleic Acids Res. 2003;31:3829–3832. doi: 10.1093/nar/gkg518. [DOI] [PMC free article] [PubMed] [Google Scholar]
- Schlicker A, et al. A new measure for functional similarity of gene products based on Gene Ontology. BMC Bioinformatics. 2006;7:302. doi: 10.1186/1471-2105-7-302. [DOI] [PMC free article] [PubMed] [Google Scholar]
- Song N, et al. Sequence similarity network reveals common ancestry of multidomain proteins. PLoS. Comput. Biol. 2008;4:e1000063. doi: 10.1371/journal.pcbi.1000063. [DOI] [PMC free article] [PubMed] [Google Scholar]
- Tian W, Skolnick J. How well is enzyme function conserved as a function of pairwise sequence identity? J. Mol. Biol. 2003;333:863–882. doi: 10.1016/j.jmb.2003.08.057. [DOI] [PubMed] [Google Scholar]
- Vinayagam A, et al. GOPET: a tool for automated predictions of Gene Ontology terms. BMC Bioinformatics. 2006;7:161. doi: 10.1186/1471-2105-7-161. [DOI] [PMC free article] [PubMed] [Google Scholar]
- Yeats C, et al. Gene3D: comprehensive structural and functional annotation of genomes. Nucleic Acids Res. 2008;36:D414–D418. doi: 10.1093/nar/gkm1019. [DOI] [PMC free article] [PubMed] [Google Scholar]
- Zehetner G. OntoBlast function: from sequence similarities directly to potential functional annotations by ontology terms. Nucleic Acids Res. 2003;31:3799–3803. doi: 10.1093/nar/gkg555. [DOI] [PMC free article] [PubMed] [Google Scholar]