

Abstract
Summary: The rtracklayer package supports the integration of existing genome browsers with experimental data analyses performed in R. The user may (i) transfer annotation tracks to and from a genome browser and (ii) create and manipulate browser views to focus on a particular set of annotations in a specific genomic region. Currently, the UCSC genome browser is supported.
Availability: The package is freely available from http://www.bioconductor.org/. A quick-start vignette is included with the package.
Contact: mflawren@fhcrc.org
1 INTRODUCTION
High-throughput experiments often produce measurements that are associated with genomic locations. Analysis of such data commonly incorporates existing genomic annotations, such as transcription factor binding motifs. Thus, the ability to access, manipulate and visualize genomic features is an important feature of any environment for experimental data analysis.
The rtracklayer package provides a command-line interface and low-level infrastructure for importing, exporting and visualizing genomic annotations from within the R platform for statistical computing. As part of the Bioconductor project, rtracklayer aims to integrate genomic visualizations with experimental data analysis. The software consists of two orthogonal but integrated components: (i) routines for converting genomic tracks between R/Bioconductor data structures and standard file formats and (ii) an abstract interface for controlling genome browsers from R. The interface has two primary functions: (i) uploading and downloading annotations to and from the genome browser and (ii) manipulating the genomic views in the browser. There is a built-in implementation of the interface for the UCSC browser (Kent et al., 2002); implementations for other browsers may be plugged into the framework by other R packages.
Some R/Bioconductor packages already provide genomic visualizations and these include GenomeGraphs (Durinck et al., 2009) and xmapbridge. The GenomeGraphs package draws genomic annotations using static R graphics. All displayed annotations must be downloaded and stored on the local machine. The xmapbridge package interfaces with the X:Map genome browser, which is designed specifically for exon array data.
The rest of this article will demonstrate the features of rtracklayer on a microarray dataset from a larger research project investigating the regulation of human stem cell differentiation by microRNAs. The transcriptome of the cells was measured before and after differentiation by HG-U133plus2 Affymetrix GeneChip arrays. There were two chips for each of the two time points. We begin our demonstration by constructing an annotation dataset from the experimental data, and then illustrate the use of the genome browser interface to display specific genomic regions in the UCSC browser.
2 ANNOTATION DATA STRUCTURE
For the analysis of the stem cell microarray data, we are interested in the genomic regions corresponding to differentially expressed genes that are predicted to be targeted by a microRNA. These regions may be represented by a collection of genomic annotations known as a track, which is viewable in a genome browser.
The IRanges package in Bioconductor defines the RangedData class, which stores data on ranged features and thus represents an annotation track. The genomic features are specified in terms of their chromosome, start position, end position and strand (+ or −). Using rtracklayer, a RangedData may be imported from data formatted as General Feature Format (GFF) (Durbin et al., 2000), Browser Extended Display (BED) (UCSC, 2008a) or Wiggle (WIG) (UCSC, 2008b).
In preparation for creating the microRNA target track, we first used a number of Bioconductor packages to detect the genes in the microarray experiment with significantly increased expression. The locations of the microRNA target sites were obtained from MiRBase (http://microrna.sanger.ac.uk/). Information about the target sites on differentially expressed genes was stored in the data.frame called targets. Below, we create an equivalent RangedData track.
![]()
As an aside, we could export the track as a WIG file for use in other tools, then read it back into R.
![]()
3 GENOME BROWSER INTERFACE
We will now visually explore the genomic annotation space around the differentially expressed genes that are thought to be microRNA targets. An example of how genome browsers draw annotation tracks is given in Figure 1. Such graphics provide the analyst with an overview of the sequence-level relationships between genomic annotations. From such an overview, the analyst might make inferences across genomic information sources. The rtracklayer package displays tracks by linking R/Bioconductor with existing genome browsers.
Fig. 1.

The genomic visualization produced by the UCSC genome browser by the rtracklayer example. The track named ‘targets’ at the top, showing microRNA target sites (as black rectangles) for the differentially expressed genes in the human stem cell experiment, was uploaded to the browser from R. To reproduce this, enter demo(targets) in R after loading rtracklayer.
To view the tracks in a genome browser, we first create an instance of browserSession for a specific external browser. The browserSession instance serves as a container of tracks, as well as an interface for creating views of specific segments of the genome. In this case, we interact with the UCSC Genome Browser, the default.
![]()
The second step is to load the track into the session. We store the targetTrack object in session under the name ‘targets’.
![]()
The final step in this example is to display a view around the target site associated with the most upregulated gene, DCN, encoding a glycoprotein thought to regulate muscle formation. We wish to display the entire track, along with some context on either side. In the code below, we call browserView to create a view spanning the first feature of the track, zoomed out by a factor of 10 via the * operator, where a positive factor zooms in and a negative factor zooms out.
![]()
This last command opens a web browser and loads the UCSC genome browser, with a view resembling the one in Figure 1. By default, the view will include our custom track along with the default UCSC tracks, including genes, mRNAs, cross-species alignments, SNPs, etc. The user may then fully interact with the browser; its behavior is the same as when accessing it directly.
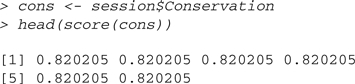
One may also download track information from the browser, such as the conservation scores. Here, only the data in the currently viewed region are retrieved; more control is provided by the track function.
We have demonstrated that rtracklayer is an effective tool for manipulating and visualizing genomic annotations in the context of experimental data analysis. The package is driven at the command-line, and is meant for users familiar with the R language. However, it could serve as a basis for GUI. As rtracklayer is extensible, we plan to implement support for additional browsers.
ACKNOWLEDGEMENTS
We would like to thank Dr Muneesh Tewari for helpful discussions and the gene expression data.
Funding: NHGRI (grant P41HG004059 to R.G., in part).
Conflict of Interest: none declared.
REFERENCES
- Durbin R, et al. General Feature Format. Sanger Institute; 2000. September 2000. URL http://www.sanger.ac.uk/Software/formats/GFF/GFF_Spec.shtml (last accessed date May 18, 2009) [Google Scholar]
- Durinck S, et al. GenomeGraphs: integrated genomic data visualization with R. BMC Bioinformatics. 2009;10:2. doi: 10.1186/1471-2105-10-2. [DOI] [PMC free article] [PubMed] [Google Scholar]
- Kent W, et al. The human genome browser at UCSC. Genome Res. 2002;12:996–1006. doi: 10.1101/gr.229102. [DOI] [PMC free article] [PubMed] [Google Scholar]
- UCSC Genome Bioinformatics Group. Browser Extended Display Format. 2008a Available at http://genome.ucsc.edu/goldenPath/help/customTrack.html#BED (last accessed date May 18, 2009) [Google Scholar]
- UCSC Genome Bioinformatics Group. Wiggle Format. 2008b Available at http://genome.ucsc.edu/goldenPath/help/wiggle.html (last accessed date May 18, 2009) [Google Scholar]