Abstract
Background
Optical coherence tomography (OCT) has been used for high-resolution endoscopic imaging and diagnosis of specialized intestinal metaplasia, dysplasia, and intramucosal carcinoma of the esophagus. However, the relatively slow image-acquisition rate of the present OCT systems inhibits wide-field imaging and limits the clinical utility of OCT for diagnostic imaging in patients with Barrett's esophagus.
Objective
This study describes a new optical imaging technology, optical frequency-domain imaging (OFDI), derived from OCT, that enables comprehensive imaging of large esophageal segments with microscopic resolution.
Design
A prototype OFDI system was developed for endoscopic imaging. The system was used in combination with a balloon-centering catheter to comprehensively image the distal esophagus in swine.
Results
Volumetric images of the mucosa and portions of the muscularis propria were obtained for 4.5-cm-long segments. Image resolution was 7 μm in depth and 30 μm parallel to the lumen, and provided clear delineation of each mucosal layer. The 3-dimensional data sets were used to create cross-sectional microscopic images, as well as vascular maps of the esophagus. Submucosal vessels and capillaries were visualized by using Doppler-flow processing.
Conclusions
Comprehensive microscopic imaging of the distal esophagus in vivo by using OFDI is feasible. The unique capabilities of this technology for obtaining detailed information of tissue microstructure over large mucosal areas may open up new possibilities for improving the management of patients with Barrett's esophagus.
Endoscopic optical coherence tomography (OCT) has recently emerged as a diagnostic tool for imaging epithelial tissues of the GI tract.1,2 By collecting and analyzing infrared light reflected from within tissue, OCT provides high-resolution, cross-sectional images of architectural- and cellular-tissue microstructure. Initial pilot studies that used endoscopic OCT demonstrated an excellent ability to clearly delineate the layered structure of the esophagus, as well as lymphatic and vascular networks.3-5 Subsequent studies have validated the diagnostic accuracy of OCT for detecting specialized intestinal metaplasia,6 dysplastic colonic polyps,7 and high-grade dysplasia and intramucosal carcinoma of the esophagus.8 The use of color Doppler OCT extends the ability of OCT to visualize subsurface blood vessels and has been proposed as a method for monitoring hemostatic intervention.9 OCT is a particularly attractive technology for endoscopic use,10 because flexible, narrow-diameter optical-fiber probes can be produced and configured to scan in a variety of orientations.2,3,5 The small size (~250 μm) of an optical fiber further allows imaging probes to be configured with spacers to stabilize the position of the probe with respect to the mucosal surface while maintaining clearance through the instrument channel of standard endoscopes.7 Although prior studies have demonstrated the diagnostic potential of endoscopic OCT, previous systems have functioned effectively in a “point-sampling” mode, wherein a probe is placed at discrete locations and cross-sectional images are obtained. The inability to screen or to survey large areas of the GI tract has limited the clinical utility of endoscopic OCT. However, recent advances in OCT technology through modifications of the core detection principles, have enabled a dramatic increase in imaging speed without compromising resolution or image quality.11-14 This new method has been termed optical frequency-domain imaging (OFDI). The purpose of this study was to test this new OCT technology for comprehensive microscopic imaging of the esophagus.
MATERIALS AND METHODS
OFDI system
The technologic approach to OFDI was previously described in detail.13 Briefly, OFDI uses a focused, narrow-diameter beam and measures the delay of reflections emanating from within the tissue sample. By repeatedly measuring these depth scans (A-lines) while the beam is scanned across the tissue, cross-sectional images are acquired. Because the propagation velocity of light in tissue is so high, the delay intervals for reflected light are too brief to be measured directly with electronic detectors. Instead, OFDI measures the delay intervals by using interferometry. In contrast to conventional OCT, OFDI uses a monochromatic light source whose wavelength is rapidly scanned and measures the interference signal as a function of wavelength. Traditional A-lines, comprising the tissue reflectivity as a function of depth along the beam, are computed through Fourier transformation. This approach yields significantly improved detection sensitivity in comparison with OCT. As a result, OFDI can provide more than 100-fold faster imaging while maintaining the same resolution and contrast of conventional OCT.
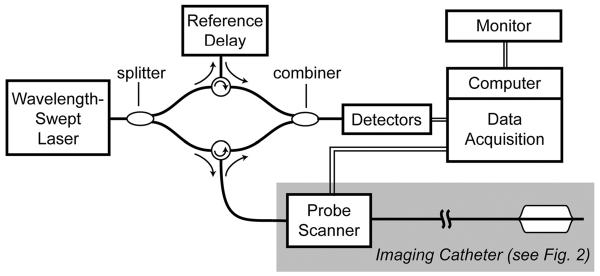
A schematic of the OFDI system used in this study is shown in Figure 1. Light from a wavelength-swept laser was divided by a fiber-optic splitter into a reference arm and a sample arm. The sample-arm light was directed to a fiber-optic catheter (Fig. 2), which was connected to the system by a scanner that allowed rotation and axial pullback of the catheter. The catheter delivered the source light to the area to be imaged, collected the reflected light, and returned this light to the OFDI system, where it was combined with light from the reference arm. The resulting interference signal was detected by a set of photo receivers and was recorded by a data acquisition unit. Data were passed to a control computer, which performed the processing required to generate and display images. The data-acquisition unit, in addition, controlled the catheter scanner and recorded the actual scanner position for each depth scan. This allowed for the correction of nonlinear catheter-scanner motion.
Figure 1.
The OFDI system schematic.
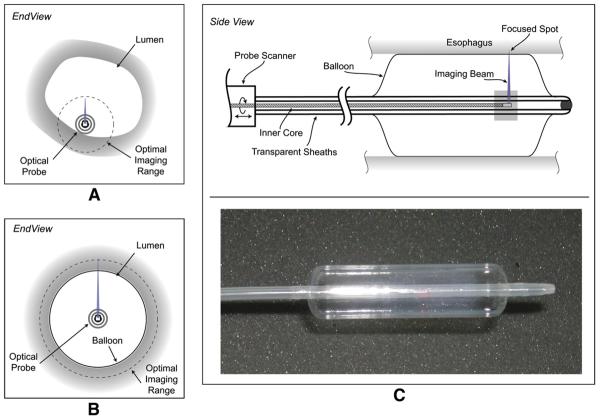
Figure 2.
The imaging catheter and balloon centration mechanism is shown. A, The limited field of view of the conventional catheter. B, The use of a balloon-centering catheter that allows full circumferential imaging overcomes the limited field of view of conventional catheter. C, The balloon catheter is shown schematically.
Axial resolution in OFDI is determined by the range over which the wavelength is scanned. The source used in this study had a tuning range of 125 nm, centered at 1320 nm, which yielded a 7-micron resolution in tissue. For endoscopic imaging, the system was operated at a reduced rate so that data could be continuously archived via a standard computer bus to a hard drive. At an A-line acquisition rate of 10 kHz, the system was capable of continuous acquisition and of saving data. The detection scheme incorporated balanced detection for improved sensitivity and polarization-diversity detection to avoid artifacts that could potentially arise from tissue birefringence. The imaging window spanned a depth range of 3.5 mm.
Balloon catheter
Previous OCT catheters relied on endoscopic guidance to place the catheter near or against the lumen, as illustrated schematically in Figure 2A.4,5 In this study, the optical components of the catheter were positioned at the center of a photodynamic therapy balloon catheter (Advanced Polymer, Inc, Salem, NH) that had a diameter of 1.8 cm. This is illustrated schematically in Figure 2B. After placement of the catheter, the balloon was inflated, resulting in the dilation of the esophagus and the centering of the imaging optics. The balloon catheter design in side view is shown in Figure 2C. During the imaging procedure, the probe scanner rotated the imaging optics in the inner sheath. Simultaneously, a slow pullback of the optics was performed. The resulting helical scan covered the entire portion of the lumen that was in contact with the balloon.
The inner core of the catheter consisted of an optical fiber enclosed within a metal drive shaft. The optical fiber delivered imaging light to and from the tissue, and the drive shaft conveyed torque and translation generated by the probe scanner to the distal end of the inner core. At the distal end, light from the optical fiber was expanded and focused by a gradient index lens and was directed transversely by a right-angle prism. A small cylindrical lens was placed on the second surface of the prism to compensate for optical astigmatism induced by the plastic sheaths. The focal length of the distal optics was adjusted to achieve a beam diameter of about 30 μm at the surface of the inflated, 1.8-cm-diameter balloon. The probe was scanned at 4 revolutions per second and was pulled back at a rate of 0.13 mm/s, resulting in an axial pitch of the helical scan of 33 μm. During each revolution, 2500 A-lines were acquired, corresponding to a transverse imaging pitch of 25 μm. Imaging times for comprehensive pullback lengths of 4.5 cm were less than 6 minutes.
Animal studies
Esophageal imaging was performed, in 2 female Yorkshire swine that weighed about 35 kg, according to a protocol approved by the Massachusetts General Hospital Subcommittee on Research Animal Care. The animals were sedated, and the balloon catheter was placed near the gastroesophageal junction by using endoscopic guidance. The balloon was then inflated, and helical image scans were acquired throughout the 4.5-cm length of the centering balloon. No effort was made to clear adherent mucous from the esophageal wall before balloon inflation. A single volumetric image corresponded to approximately 10 GB of data. After imaging and euthanasia, the entire esophagus and proximal stomach were resected, and histologic sections were obtained at measured intervals from the gastroesophageal junction.
Data analysis
The helical data sets were processed by using an algorithm to correct for motion artifacts arising from peristalsis, respiration, or cardiac motion. The algorithm was applied to the OFDI A-line data and included 2 steps. First, the balloon surface was identified in each A-line based on the slope of the signal intensity as a function of radial distance. Subsequently, an offset was introduced into each A-line such that the radial location of the balloon surface was constant over the entire data set. As a result, the balloon surface was constrained to a regular cylinder. Subsequently, 3-dimensional and arbitrary cross-sectional views of the tissue volume were displayed. Radial (depth) measurements in the OFDI data were corrected for the index of refraction (1.38) in analogy with the scaling that is used in US imaging.
RESULTS
Distal esophagus
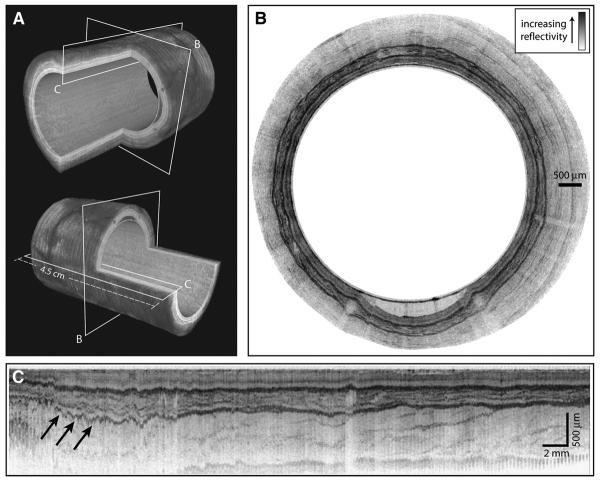
Imaging was performed without complications in both swine. A 3-dimensional reconstruction of a helical data set at the distal esophagus is depicted in Figure 3A. The locations of the cross-sectional and longitudinal images displayed in Figures 3B and C, respectively, are shown in Figure 3A. The transverse cross-sectional image in Figure 3B shows clear delineation of the mucosal microscopic structure. Note that imaging of the entire mucosal thickness was achieved over the full 360°. A longitudinal cross-sectional image is shown in Figure 3C. Imaging through the mucosal wall is achieved over the full 4.5-cm pullback length. Because of the large diameter of the balloon (18 mm) relative to the OFDI image depth (2 mm), displaying transverse cross-sectional images to scale significantly reduces feature size. As such, the balloon radius is reduced in the representations in Figure 3 to allow for high-resolution visualization, while maintaining the cylindrical shape of the imaged area. The same geometric distortion is applied in both Figures 3A and B.
Figure 3.
OFDI images of the distal esophagus. The esophageal circumference in all figures is given by the balloon circumference (56 mm). A, Three-dimensional renderings of the distal esophagus with quadrant cut-outs and planes designating the locations of the cross-sectional images. B, A trans-verse cross-sectional image; the balloon appears as the inner surface and is clearly apparent in the lower portion of the image where an air/mucus pocket separates the balloon and luminal wall; the radial depth scale is given by the indicated scale bar. The images in (A) and (B) are presented with distorted dimensions to allow for greater visualization of detail. C, A longitudinal cross-sectional image is shown (arrows designating residual motion artifacts); note that the 3-dimensional images use an inverted reflectivity mapping (white corresponds to higher reflectivities) to improve visualization.
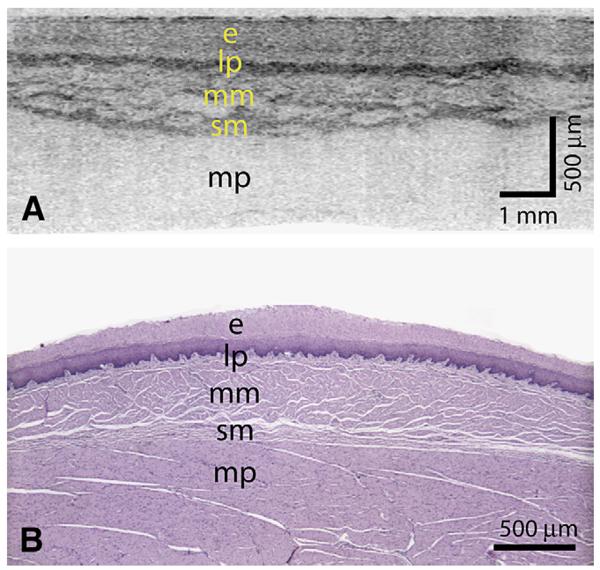
Because the first scan priority of the probe was rotational, the transverse cross-sectional images (Fig. 3B) were insensitive to artifacts that resulted from cardiac, respiratory, and peristaltic motion. A magnified portion of a transverse cross-section (Fig. 4A) demonstrated good correspondence with representative histology (Fig. 4B). However, the impact of motion on longitudinal cross-sectional images and 3-dimensional renderings was significant. The generation of longitudinal images, as well as 3-dimensional rendering, requires compensation for this motion. We implemented a surface extraction and a normalization routine that aligned the balloon position in depth for each A-line. Although this algorithm resulted in a uniform cylindrical appearance at the lumen, compression of the esophageal wall was evident as a depth-dependent misalignment in longitudinal sections (Fig. 3C).
Figure 4.
A, A transverse cross-sectional image showing all architectural layers of the squamous mucosa, including the epithelium (e), lamina propria (lp), muscularis mucosa (mm), submucosa (sm), and muscularis propria (mp); because of the large change in esophageal circumference during imaging (56 mm) and after resection (~22 mm), the cross-sectional image is displayed over a proportionately larger width. B, Representative histology from the same swine (H&E, orig. mag. ×2).
Squamocolumnar junction
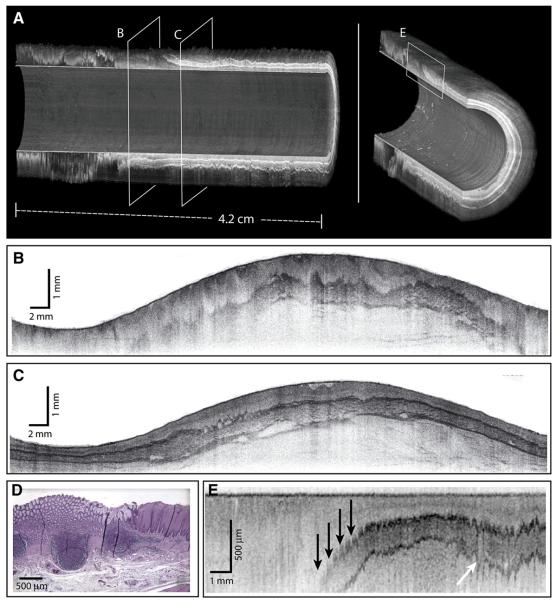
To assess the capability of the OFDI system and the balloon catheter for imaging the squamocolumnar junction (SCJ), we positioned the balloon under endoscopic guidance such that the distal portion extended into the proximal stomach, deinsufflated the esophagus, and pressurized the balloon. Comprehensive imaging was performed from distal to proximal in the same helical scan pattern described above. The resulting data set is shown in Figure 5 (Video 1, available online at www.giejournal.org). In Figure 5A, 3-dimensional renderings of the SCJ are presented. These renderings are presented with a 180° cutout, allowing visualization of longitudinal sections of the esophageal wall. Transverse cross-sectional images at the locations indicated by regions B and C are presented in unwrapped polar coordinates in Figure 5B and C, and a longitudinal cross-section at the transition region as indicated by region E is shown in Figure 5E. Representative histology at the transition region is shown in Figure 5D. The transformation zone is most clearly visualized in the longitudinal presentations. Near the transition region, the muscularis mucosa and deeper layers are seen to descend from the luminal surface (arrows, Fig. 5E). Note the presence of motion artifacts in the longitudinal cross-sectional image of Figure 5E, resulting from the proximity of the SCJ to the heart.
Figure 5.
Imaging of the SCJ. A, Three-dimensional renderings of the SCJ are shown, with planes designating locations of the cross-sectional images. B and C, Unwrapped transverse cross-sectional images spanning 360°. D, Representative histology of (E) (H&E, orig. mag. ×2). E, A longitudinal cross-sectional image; the depth of the muscularis mucosa is observed to vary significantly at the transformation zone (black arrows); residual motion artifacts are indicated by the white arrow. A supplementary video representing a full-volume pull-back sequence is available at www.giejournal.org.
Vascular imaging
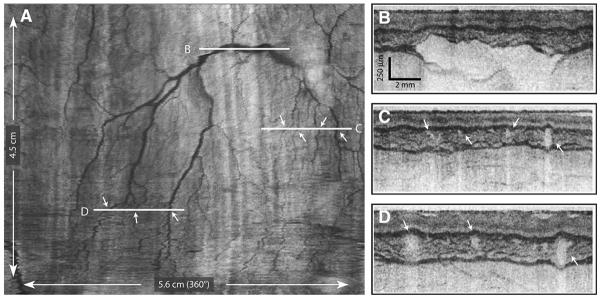
The mucosal vascular network observed in the circular cross-sections in Figure 3B are more readily visualized by using image processing to unwrap the tubular anatomy of the esophagus and display the lumen as if it were opened longitudinally and laid flat with the epithelial surface exposed (Fig. 6). By integrating the log-scaled OFDI signal over depth from the epithelium through the muscularis propria, the vascular network was clearly observed. High-resolution, cross-sectional images along the locations designated by the white horizontal lines in Figure 6A are presented in Figures 6B to D. Doppler imaging,15,16 which allows highly sensitive detection of blood flow, provides additional complimentary contrast for vascular imaging. Comprehensive Doppler imaging was performed with the catheter placed in the tubular esophagus. An image of the unwrapped esophagus similar to that of Figure 6 but with the addition of the measured Doppler-signal magnitude mapped to the indicated color space is shown in Figure 7. Cross-sectional images at locations designated in Figure 7A are shown in Figures 7B to C. The ability to image vasculature comprehensively at high resolutions may serve to increase diagnostic capability and clinical utility.
Figure 6.
A, A comprehensive vascular map derived from the structural image set. B to D, Cross-sectional images at the indicated locations. Arrows indicate corresponding vessels in the vascular map and cross-sectional images.
Figure 7.
A vascular map, including Doppler signal processing. A, The Doppler signal magnitude is displayed by using the indicated color lookup table and overlaid on a structural image. B and C, Cross-sectional images from locations designated in (A).
DISCUSSION
In this pilot study, comprehensive esophageal microscopy in vivo has been demonstrated for the first time by using a prototype OFDI system. High-resolution images were obtained from the distal esophagus and the gastroesophageal junction, which permitted clear visualization of the anatomic layers of the esophagus and of the vascular network of the muscularis mucosa. Procedure times were less than 6 minutes, but the image acquisition speed of the prototype system was limited entirely by the rate at which data could be continuously archived via a standard computer bus to a hard drive. This limitation will be addressed in future systems by implementing hardware-based digital signal processing and, as a result, we anticipate that imaging speed will be increased an additional 10-fold. Comprehensive microscopic imaging of the distal esophagus would be a valuable tool for disease screening and surveillance, particularly in the management of Barrett's esophagus. OCT was previously demonstrated for “optical biopsy” at discrete locations, but fundamental technologic limitations prevented imaging of large tissue areas. In this study, a prototype OFDI system was used to overcome this limitation. The animal studies demonstrated that OFDI operates at a significantly increased image acquisition rate and detection sensitivity and, when coupled with a balloon-centering catheter, can be used for comprehensive imaging with a resolution and image quality identical to OCT.
Although the inflated diameter and the length of the imaging segment of the balloon catheter were appropriate for OFDI, the core diameter (1.5 mm) was significantly larger than required for the drive shaft and the optical fiber. The integration of a centering balloon onto a flexible catheter with a diameter similar to those used for intracoronary OCT imaging17 may permit comprehensive esophageal imaging to be performed less invasively and in a standalone mode, thus significantly reducing the cost of screening and opening the possibility of epidemiologic studies of Barrett's esophagus across a broader segment of the population. In the role of surveillance, comprehensive microscopic imaging may reduce the sampling artifact inherent to random biopsy sampling and could improve the sensitivity of detecting dysplasia and epithelial cancer.
Previous studies identified and prospectively tested OCT criteria for the diagnosis of specialized intestinal metaplasia, dysplasia, and intramucosal cancer of the esophagus.6-8,18 These criteria were specific to imaging with a catheter that did not compress the esophageal wall. It is unclear whether tissue compression arising from the balloon will adversely affect the accuracy of OCT diagnostic criteria; additional studies will be required. From our preliminary results, the balloon catheter appeared to affect imaging in 2 ways. First, it smoothed the tissue surface and thus made epithelial topology difficult to identify. Second, the expansion of the balloon compressed the anatomical layers and increased the OFDI signal. These effects were also noted in prior OCT studies.19 The increased OFDI signal may be advantageous, because compression appears to increase the contrast and the visibility of the architecture of the esophageal wall and permits imaging depths extending to the outer muscularis propria.
Although clinical studies are required to further evaluate the utility of OFDI, the ability to comprehensively image the distal esophagus with the resolution and contrast of OCT may provide a powerful tool for diagnostic screening and surveillance in patients with Barrett's esophagus.
Capsule Summary
What is already known on this topic
• The diagnostic potential of endoscopic OCT has been demonstrated, but the systems have functioned effectively only in a “point-sampling” mode, unable to survey large areas of the GI tract.
What this study adds to our knowledge
• An OFDI system used in a swine model provided high-resolution images from the distal esophagus and gastroesophageal junction, permitting clear visualization of the anatomic layers of the esophagus and of the vascular network of the muscularis mucosa.
Supplementary Material
Acknowledgments
This research was supported, in part, by the National Institutes of Health, contracts R01 CA103769, R33 CA110130, and R01 RR0119768.
Footnotes
DISCLOSURE Some authors (B.J.V., M.S., S.H.Y., W.Y.O., G.J.T., B.E.B.) have patent applications related to the technology used in this research. These patent applications were not supported by a commercial interest, have not been licensed to a company, and generate no revenue.
REFERENCES
- 1.Tearney GJ, Brezinski ME, Bouma BE, et al. In vivo endoscopic optical biopsy with optical coherence tomography. Science. 1997;276:2037–9. doi: 10.1126/science.276.5321.2037. [DOI] [PubMed] [Google Scholar]
- 2.Sergeev A, Gelikonov V, Gelikonov G, et al. In vivo endoscopic OCT imaging of precancer and cancer states of human mucosa. Opt Express. 1997;1:432–40. doi: 10.1364/oe.1.000432. [DOI] [PubMed] [Google Scholar]
- 3.Bouma BE, Tearney GJ. Power-efficient nonreciprocal interferometer and linear-scanning fiber-optic catheter for optical coherence tomography. Opt Lett. 1999;24:531–3. doi: 10.1364/ol.24.000531. [DOI] [PubMed] [Google Scholar]
- 4.Bouma BE, Tearney GJ, Compton CC, et al. High-resolution imaging of the human esophagus and stomach in vivo using optical coherence tomography. Gastrointest Endosc. 2000;51:467–74. doi: 10.1016/s0016-5107(00)70449-4. [DOI] [PubMed] [Google Scholar]
- 5.Sivak MV, Kobayashi K, Izatt JA, et al. High-resolution endoscopic imaging of the GI tract using optical coherence tomography. Gastrointest Endosc. 2000;51:474–9. doi: 10.1016/s0016-5107(00)70450-0. [DOI] [PubMed] [Google Scholar]
- 6.Poneros JM, Brand S, Bouma BE, et al. Diagnosis of specialized intestinal metaplasia by optical coherence tomography. Gastroenterology. 2001;120:7–12. doi: 10.1053/gast.2001.20911. [DOI] [PubMed] [Google Scholar]
- 7.Pfau PR, Sivak MV, Jr, Chak A, et al. Criteria for the diagnosis of dysplasia by endoscopic optical coherence tomography. Gastrointest Endosc. 2003;58:196–202. doi: 10.1067/mge.2003.344. [DOI] [PubMed] [Google Scholar]
- 8.Evans JA, Poneros JM, Bouma BE, et al. Optical coherence tomography to identify intramucosal carcinoma and high-grade dysplasia in Barrett's esophagus. Clin Gastroenterol Hepatol. 2006;4:38–43. doi: 10.1053/S1542-3565(05)00746-9. [DOI] [PMC free article] [PubMed] [Google Scholar]
- 9.Wong RCK, Yazdanfar S, Izatt JA, et al. Visualization of subsurface blood vessels by color Doppler optical coherence tomography in rats: before and after hemostatic therapy. Gastrointest Endosc. 2002;55:88–95. doi: 10.1067/mge.2002.120104. [DOI] [PubMed] [Google Scholar]
- 10.Poneros JM, Tearney GJ, Shiskov M, et al. Optical coherence tomography of the biliary tree during ERCP. Gastrointest Endosc. 2002;55:84–8. doi: 10.1067/mge.2002.120098. [DOI] [PubMed] [Google Scholar]
- 11.de Boer JF, Cense B, Park BH, et al. Improved signal-to-noise ratio in spectral-domain compared with time-domain optical coherence tomography. Opt Lett. 2003;28:2067–9. doi: 10.1364/ol.28.002067. [DOI] [PubMed] [Google Scholar]
- 12.Choma MA, Sarunic MV, Yang CH, et al. Sensitivity advantage of swept source and Fourier domain optical coherence tomography. Opt Express. 2003;11:2183–9. doi: 10.1364/oe.11.002183. [DOI] [PubMed] [Google Scholar]
- 13.Yun SH, Tearney GJ, de Boer JF, et al. High-speed optical frequency-domain imaging. Opt Express. 2003;11:2953–63. doi: 10.1364/oe.11.002953. [DOI] [PMC free article] [PubMed] [Google Scholar]
- 14.Yun SH, Tearney GJ, Vakoc BJ, et al. Comprehensive volumetric optical microscopy in-vivo. Nat Med. 2006 doi: 10.1038/nm1450. In press. [DOI] [PMC free article] [PubMed] [Google Scholar]
- 15.Vakoc BJ, Yun SH, de Boer JF. Phase-resolved optical frequency domain imaging. Opt Express. 2005;13:5483–93. doi: 10.1364/opex.13.005483. [DOI] [PMC free article] [PubMed] [Google Scholar]
- 16.Yang VXD, Tang SJ, Gordon ML, et al. Endoscopic Doppler optical coherence tomography in the human GI tract: initial experience. Gastrointest Endosc. 2005;61:879–90. doi: 10.1016/s0016-5107(05)00323-8. [DOI] [PubMed] [Google Scholar]
- 17.Jang IK, Tearney GJ, MacNeill B, et al. In vivo characterization of coronary atherosclerotic plaque by use of optical coherence tomography. Circulation. 2005;111:1551–5. doi: 10.1161/01.CIR.0000159354.43778.69. [DOI] [PMC free article] [PubMed] [Google Scholar]
- 18.Isenberg G, Sivak MV, Jr, Chak A, et al. Accuracy of endoscopic optical coherence tomography in the detection of dysplasia in Barrett's esophagus: a prospective, double-blinded study. Gastrointest Endosc. 2005;62:825–31. doi: 10.1016/j.gie.2005.07.048. [DOI] [PubMed] [Google Scholar]
- 19.Westphal V, Rollins AM, Willis J, et al. Correlation of endoscopic optical coherence tomography with histology in the lower-GI tract. Gastrointest Endosc. 2005;61:537–46. doi: 10.1016/s0016-5107(05)00084-2. [DOI] [PubMed] [Google Scholar]
Associated Data
This section collects any data citations, data availability statements, or supplementary materials included in this article.


