Abstract
A general approach to high-throughput screening of enantiomeric excess (ee) and concentration was developed by using indicator displacement assays (IDAs), and the protocol was then applied to the vicinal diol hydrobenzoin. The method involves the sequential utilization of what we define herein as screening, training, and analysis plates. Several enantioselective boronic acid-based receptors were screened by using 96-well plates, both for their ability to discriminate the enantiomers of hydrobenzoin and to find their optimal pairing with indicators resulting in the largest optical responses. The best receptor/indicator combination was then used to train an artificial neural network to determine concentration and ee. To prove the practicality of the developed protocol, analysis plates were created containing true unknown samples of hydrobenzoin generated by established Sharpless asymmetric dihydroxylation reactions, and the best ligand was correctly identified.
Keywords: artificial neural networks, catalyst discovery, enantioselective indicator displacement assay, supramolecular chemistry
The unique role of chiral bioactive therapeutic substances is a source of inspiration for the design of efficient asymmetric catalytic processes (1). To this end, combinatorial synthesis and stockpiles of chiral ligands can afford large libraries of molecules as a potential source of new and improved catalysts (2, 3). Traditionally, the search for asymmetric catalysts has relied on iterative approaches wherein a single catalyst is designed, synthesized, tested, and optimized. This cycle is repeated until a catalytically active system is obtained with the desired level of enantioselectivity. In contrast, if a high-throughput screening (HTS) strategy for ee determination existed, it would enable one to rapidly identify effective asymmetric catalysts, thus allowing for a much broader range of catalyst candidates and experimental conditions to be evaluated (4, 5). However, most of these methods require prior derivatization of the analyte or require expensive instrumentation, and many are still quite slow. Herein, we report a colorimetric strategy based on indicator displacement assays (IDAs) for creating HTS protocols that can be used for the rapid determination of molecular chirality as well as the yield of a reaction.
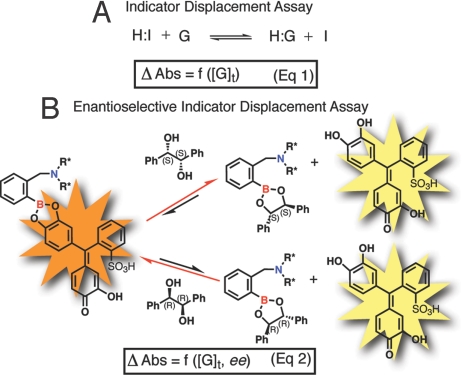
An indicator displacement assay relies on a colorimetric or fluorescent indicator that changes optical or electrochemical properties when bound to a host relative to being free in the bulk medium (6). The most commonly used indicators are pH indicators (7). The competition between an indicator and the guest of interest for the binding site of the host allows the determination of total guest (or analyte) concentration [G]t [Scheme 1 (Eq.1)]. An IDA both eliminates the need to incorporate the chromophore or fluorophore into the structure of the host, thus simplifying the synthesis of the host molecule, and allows one to tune the sensitivity of the assay because of the ability to change the identity and concentration of the indicator (8). Our research group and others have developed multicomponent optical sensors that function on the basis of an indicator displacement assay (9–12).
Scheme 1.
Equilibria involved in our protocol. (A) Indicator displacement assay (IDA). (B) Enantioselective indicator displacement assay (eIDA) using a chiral host for chiral diols with pyrocatechol violet (PV) as the indicator. H, host; I, indicator; G, guest/analyte; Δ Abs, absorbance change; [G]t, total guest concentration; ee, enantiomeric excess. The asterisk indicates the stereogenic center.
We recently expanded the scope of indicator displacement assays to enantioselective indicator displacement assays (eIDAs) by incorporating chirality into the host, which allows us to quantify ee in addition to the concentration of a chiral analyte [Scheme 1 (appropriate to the work described herein for hydrobenzoin in Eq. 2)] (8, 13–16). This approach relies on the energetic difference of the 2 diastereomeric complexes that are formed when a chiral host interacts with the 2 enantiomers of the guest molecule. In our earlier work, chiral and achiral boronic acid hosts were used to determine ee and total guest concentration [G]t for chiral α-hydroxycarboxylic acids in a non-HTS manner (8). We used a dual chamber cuvette that could analyze only 1 sample at a time in conjunction with a supervised pattern recognition method [artificial neural networks (ANNs)] to analyze the data (16).
Herein, we advance our work by presenting a general approach to using eIDAs for HTS of ee and reaction yield [G]t of any chiral vicinal diol using ANN as the data analysis tool. ANN-based approaches have advantages that include a capacity to self-teach and to model complex data without the need for a detailed understanding of the underlying phenomena. There are many types of neural networks for various applications available in the literature. Multilayered perceptron (MLP) is the simplest, and therefore the most commonly used neural network with a feed-forward topology. In this study, a simple 3-layered MLP network is used (17, 18).
As described in the next section, the method involves using a library of chiral receptors for the target analytes along with a series of 3 96-well plates. The first 2 plates create the methodology, whereas a third plate contains unknowns for analysis, and there could actually be as many of these plates as are required to analyze all the samples. To show that the approach leads to a method that is accurate, 16 samples of hydrobenzoin with unknown ee values were determined in <10 min with an average absolute error of ±0.17 mM for [G]t in the range of 3–8 mM and 3.5% for ee values. Next, to show that the technique can be applied to catalyst discovery, the method developed for hydrobenzoin was applied to the analysis of the established Sharpless asymmetric dihydroxylation reactions, where in accordance with literature, the best cinchona alkaloid ligand was correctly identified (19–21).
Results and Discussion
Design Criteria.
In this section, we lay forth our vision for a general approach for creating HTS assays for ee and [G]t, whereas the remainder of this article describes our successful implementation of the approach. We deemed that certain basic criteria must be met in order for the approach to be adopted by others. First, the receptors must be easily synthesized, optimally in only 1 or 2 simple steps from commercially available and inexpensive starting materials (preferably in both enantiomeric forms). Second, the optical signaling should be simple and adaptable to screening and optimization without involving additional synthesis. This criterion is the strength of an IDA, which is modular and thereby allows one to mix and match commercially available pH indicators with the receptors to rapidly reveal the most accurate assays. Third, a general platform for HTS that is inexpensive and fast and allows for the generation of large datasets for both training an ANN and analyzing unknowns is needed. To achieve this criterion, we used a 96-well plate (microtiter plate) analysis system.
Data collection in a 96-well plate format is significantly more rapid than in a standard bench-top UV-vis spectrophotometer. For example, after creation of the protocol (steps 1–3 below), a plate is loaded with host, indicator, buffer, and analyte solution by using a microplate pipetting robotic system in ≈10 min. A full absorption spectrum for each well is generated in ≈30 min. The absorption data are imported into a computer containing a trained ANN, resulting in essentially instantaneous output of the ee and [G]t values, making for a projected overall analysis time of ≈40 min for 96 unknowns.
The creation of our overall protocol starts with the synthesis, characterization, and purification of a series of chiral receptors for the chiral functional group of interest. A small library of chiral receptors targeted to the analyte class of interest is created because it is likely that each and every new chiral analyte will not be best enantioselectively discriminated by a single chiral receptor. Therefore, we anticipate that it will be advantageous to screen each new analyte with a series of receptors to reveal the receptor most enantioselective for that new analyte. One strategy for creating a host–guest-based enantiomeric discrimination protocol would be to target highly enantioselective receptors. Yet, this has historically proven to be challenging, and often requires extensive synthesis in an iterative approach that optimizes a host's enantioselectivity.
Optimizing the host is not our approach. Rather, we aim to purchase our enantioselectivity in the form of simple chiral building blocks that can, in 1 or 2 steps, be incorporated into the receptors. Of course, this limits the potential enantioselectivity, but it does make the protocols more amenable to adoption by other researchers. To compensate for the limitation that we have set for ourselves, we use indicator and host combinations in our displacement assays that have large optical differences at a particular wavelength for enantiomeric analytes, thereby allowing us to make accurate assays, sometimes with even quite poor enantiomeric discrimination.
Once the chiral receptors are in hand, the following protocol is followed:
By using traditional UV-vis titrations and standard binding isotherms, the proper concentrations for combining the receptors and indicators are determined as preparatory work required before screening for enantioselectivity.
The receptors and indicators are then screened in a 96-well plate to reveal the best indicator/receptor combination for reporting the ee of a chiral target. We call this the “screening plate” step.
Once the optimal receptor/indicator combination(s) are revealed, optical data for different concentrations and ee values of the analytes are collected in a 96-well plate format to train an ANN. We call this the “training plate” step.
Unknowns from reactions that were aimed at asymmetric induction or optimization of ee values are robotically loaded into 96-well plates for analysis. We refer to this as the “analysis plate(s)” step.
The data from the analysis plates are imported into a computer, analyzed with the trained ANN, and the values of ee and [G]t for the unknowns are revealed.
Step 1 involves a reasonable amount of work, yet we plan ultimately to automate this step. Importantly, because this step does not involve the analyte, but only the hosts and indicators, it does not need to be repeated when creating assays by using the same respective hosts and indicators for any new analytes. Steps 2 and 3 are those that lead to an analyte-specific assay, and would need to be repeated for each new analyte; yet, they are quick because they involve 96-well plate screens. After steps 2 and 3 are accomplished, steps 4 and 5 can be repeated over and over for the analysis of numerous 96-well plates containing unknowns. We now describe the implementation of this protocol to the analysis of the chiral analyte hydrobenzoin, using boronic acid based chiral receptors.
Synthesis.
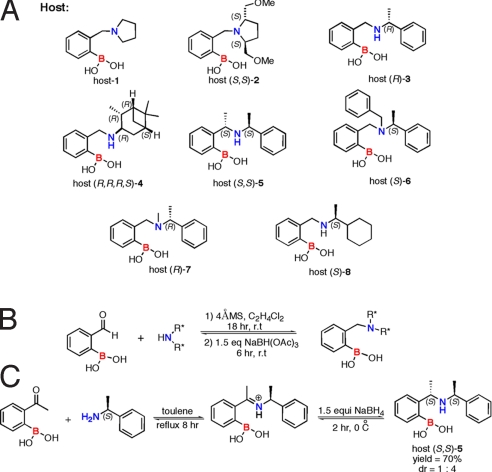
As described above, one criteria we set for ourselves is an easy synthesis of the hosts. Thus, a series of boronic acid hosts (Scheme 2A) were synthesized by reductive amination of 2-formylphenylboronic acid with chiral amines that were commercially available (Scheme 2B). The general 1-pot procedure described in our previous publication (13) was used to make the achiral and chiral hosts (most of which are new), with the exception of host (S,S)-5 (Scheme 2C), which was synthesized in 2 steps. The imine was first isolated by heating 2-acetylphenylboronic acid with the α-methyl benzylamine in toluene by using a Dean Stark trap. The isolated imine was then reduced with NaBH4 in methanol at 0 °C (lower temperatures were used to achieve asymmetric induction). The product was isolated in a 70% yield with a diastereomeric ratio (dr) of 1:4 by using alumina flash chromatography.
Scheme 2.
Host structures and syntheses. (A) Structures of the library of boronic acid hosts. (B) General reductive amination to synthesize chiral boronic acids. (C) Synthesis of host (S,S)-5.
Indicator Displacement Assay Optimization (Step 1).
Our first goal was to determine the optimal concentration of the various boronic acid hosts and indicators to be used in the HTS-eIDA. In our previous experience, we have found that the best enantioselectivity is achieved when the host is 75–90% saturated with an indicator (8). To obtain this information 1:1 binding isotherms of the synthesized boronic acid hosts with various indicators (22) were determined with traditional UV-vis titrations (Fig. 1).
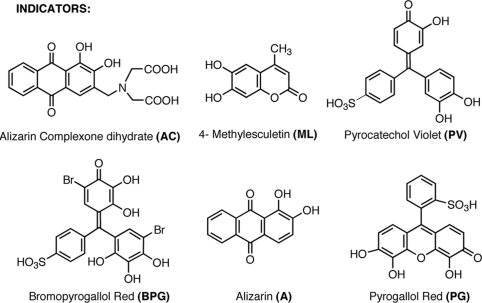
Fig. 1.
Structures of the selected catechol-based indicators.
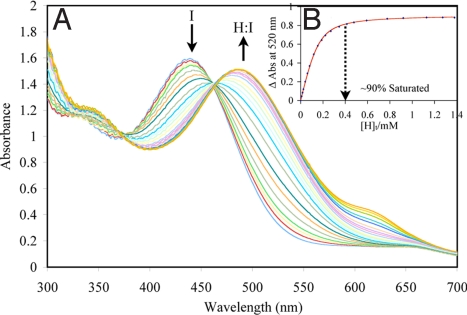
As an example of a UV-vis titration, the 1:1 binding isotherm of host (S)-6 with pyrocatechol violet (PV) is shown in Fig. 2. As shown in Fig. 2B, the ideal concentration of host (S)-6 with PV (≈90% saturation of host with indicator) for eIDA was determined from its 1:1 binding isotherm. In a similar fashion, to determine the optimum ratio of each host to each indicator, UV-vis titrations were performed between the enantioselective hosts and the indicators: alizarin (A), alizarin complexone dihydrate (AC), bromopyrogallol red (BPG), 4-methylesculetin (ML), pyrogallol red (PG), and PV. Their 1:1 binding isotherms with each host were generated (see supporting information (SI) Appendix), and their association constants are listed in Table 1(12). Step 1 in our protocol was time consuming, but it never needs to be repeated again for any new chiral diols (unless for verification and/or for reproducibility). After succeeding in the determination of the optimal ratios of hosts and indicator, we turned to step 2 to reveal the proper host/indicator duo for the enantiodifferentiation of hydrobenzoin.
Fig. 2.
Example of UV/vis titration. (A) UV-vis titration of host (S)-6 with PV (150 μM). (B) The 1:1 binding isotherm (plot of the difference in absorbance at 520 nm with the addition of the host). [H]t, total host concentration. All titrations were carried out in 100% MeOH, 10 mM para-toluenesulfonic acid and Hunig's base buffer (pH 7.4). All measurements were taken at 25 °C. The solid line is the calculated curve resulting from iterative data fitting to a 1:1 binding isotherm (12).
Table 1.
Binding constant KHI (103 M−1) of boronic acid hosts with indicators
| Indicators | Host-1 | Host (S,S)-2 | Host (R,R,R,S)-4 | Host (R)-6 | Host (S)-6 | Host (R)-8 | Host (S)-8 |
|---|---|---|---|---|---|---|---|
| A | 19.0 ± 1.2 | 20.6 ± 2.5 | 32.7 ± 2.8 | 30.5 ± 3.3 | 27.8 ± 2.3 | 36.8 ± 2.6 | 35.7 ± 2.8 |
| AC | 132 ± 20 | 69.9 ± 4.3 | 128 ± 17 | 28.9 ± 4.1 | 22.8 ± 3.3 | 172 ± 55 | 192 ± 36 |
| BPG | 5.40 ± 0.1 | 108 ± 3.8 | 50.1 ± 4.9 | 210 ± 17 | 233 ± 27 | 34.8 ± 1.6 | 35.9 ± 1.9 |
| ML | 11.1 ± 0.1 | 24.1 ± 2.6 | 37.8 ± 1.5 | 118 ± 7.2 | 102 ± 5.4 | 53.6 ± 1.5 | 54.1 ± 1.5 |
| PG | 4.67 ± 0.2 | 24.7 ± 0.5 | 20.6 ± 1.3 | 188 ± 42 | 161 ± 25 | 11.3 ± 0.4 | 11.4 ± 0.4 |
| PV | 3.08 ± 0.01 | 53.2 ± 2.3 | 15.9 ± 0.4 | 27.8 ± 0.4 | 31.0 ± 0.8 | 14.8 ± 0.2 | 17.3 ± 0.3 |
All titrations were carried out in 100% MeOH, 10 mM para-toluenesulfonic acid, and Hunig's base buffer (pH 7.4). All measurements were taken at 25 °C.
Screening for Enantioselectivity (In Preparation of Step 2).
Because we have not previously performed a screen in a 96-well plate to reveal the most enantioselective receptor, we first checked the enantioselectivities of the chiral receptors we have synthesized (Scheme 2A) by using standard eIDA methods. The goal was to check the results we would ultimately obtain in Step 2 of our general protocol, to make sure that the screen reveals the correct receptor. Hence, we checked the enantioselectivity of our new chiral receptors using PV as the indicator.
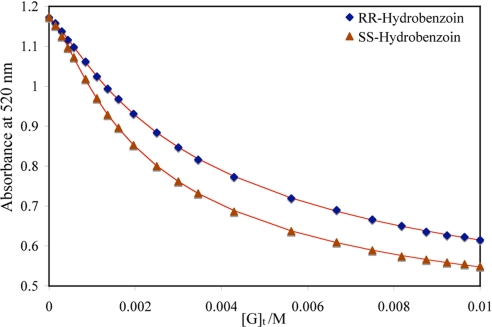
In the displacement assay, the addition of the analyte (hydrobenzoin) to the indicator and the host solution causes a shift in absorbance of the resulting solution because of the displacement of the indicator from the host by the analyte. A representative displacement assay, showing host (S)-6 with the 2 enantiomers of hydrobenzoin is shown in Fig. 3. As expected, the absorbance at 520 nm of the host (S)-6 and PV complex [H/I] decreases to different extents with the 2 enantiomers. The association constants between the hosts and the 2 enantiomers can be calculated by traditional methods (23, 24).
Fig. 3.
A combined graph of 2 enantioselective indicator displacement assay (eIDA) of host (S)-6 (400 μM)/PV (150 μM) with (R,R)-hydrobenzoin and (S,S)-hydrobenzoin, [G]t, concentration of the guest/analyte. All titrations were carried out in 100% MeOH, 10 mM para-toluenesulfonic acid and Hunig's base buffer (pH 7.4). All measurements were taken at 25 °C. The solid lines are calculated curves resulted from iterative data fitting for a displacement assay (8).
Similarly, the association constants of the synthesized boronic acid hosts (1–8) with (R,R)-hydrobenzoin and (S,S)-hydrobenzoin were determined (see SI Appendix). Of the synthesized boronic acid hosts, only host (S,S)-2, host (R,R,R,S)-4, host (S)-6, and host (R)-8 show significant discrimination between the 2 enantiomers of hydrobenzoin. Host (R)-3, host (S,S)-5, and host (R)-7 did not show any enantioselectivity. The association constants [KHG(R,R) KHG(S,S)] of the hosts that did show enantioselectivity with the 2 enantiomers of hydrobenzoin are listed in Table 2. As required by the first principles of stereochemistry, host (R)-6 and host (S)-6 and host (R)-8 and host (S)-8 show equal and opposite enantioselectivity (see SI Appendix). Host (S,S)-2 shows the highest enantioselectivity. Interestingly, this particular host is the only C2 symmetric host, and apparently the CH2OCH3 groups on the pyrrolidine ring create a chiral environment that imparts the best enantioselectivity for C2 symmetric hydrobenzoin. This is not likely the case for other chiral diols.
Table 2.
Binding constant KHG (103 M−1) of boronic acid hosts, KHG(S,S) with (S,S)-hydrobenzoin and KHG(R,R) with (R,R)-hydrobenzoin
| Guest | Host-1 | Host (S,S)-2 | Host (R,R,R,S)-4 | Host (R)-6 | Host (S)-6 | Host (R)-8 | Host (S)-8 |
|---|---|---|---|---|---|---|---|
| KHG(S,S) | 1.42 ± 0.04 | 13.6 ± 0.13 | 3.55 ± 0.04 | 3.78 ± 0.06 | 6.38 ± 0.05 | 5.85 ± 0.06 | 4.17 ± 0.04 |
| KHG(R,R) | 1.26 ± 0.03 | 4.77 ± 0.02 | 5.22 ± 0.07 | 5.93 ± 0.07 | 3.94 ± 0.04 | 3.96 ± 0.05 | 5.55 ± 0.06 |
All titrations were carried out in 100% MeOH, 10 mM para-toluenesulfonic acid, and Hunig's base buffer (pH 7.4). All measurements were taken at 25 °C. The error reported here results from the computer fit to the experimental isotherm. In our previous experience, there is ≈10% error, at most, in the reproducibility in the KHG value.
Given these results, we set out to determine whether a 96-plate analysis would lead to the same conclusion and to find the optimal indicator host combination for hydrobenzoin as a means to use this combination in the HTS assay. This next stage of the study constitutes the implementation of Step 2 of our general protocol.
Screening Plate (Step 2).
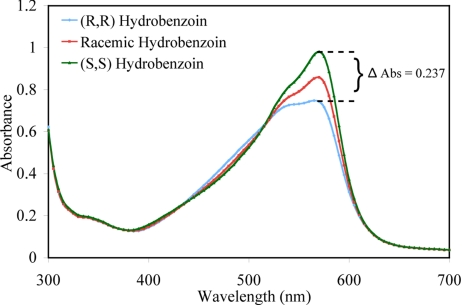
A screening plate was designed to determine which host and indicator combination shows the best discrimination between the 2 enantiomers of hydrobenzoin. Traditionally, acquiring this information would require several UV titrations as described above, which we did in this one case as a means to check the following results. In the future, the plan would be to skip the titrations described above and move directly to a 96-well screening plate as now described. In this study, the screening plate was generated with 1 enantiomer of each host (host (S,S)-2, host (R,R,R,S)-4, host (S)-6, and host (S)-8) (see SI Appendix) and the optimum ratio (≈90% saturation) of each host with each indicator was added to each well of the 96-well plate (see SI Appendix). In our experience (8), the degree of enantioselectivity of a host depends on analyte concentration. Thus, 2 screening plates were designed, one at 5 mM and the other at 10 mM concentration of the hydrobenzoin. The host/indicator combination that showed the best enantiodiscrimination of the 2 enantiomers of hydrobenzoin was determined to be host (S,S)-2, and BPG. A difference in absorbance of 0.237 was recorded at 570 nm with host (S,S)-2 and BPG at 5 mM and 10 mM [G]t (Fig. 4). To validate the absorbance spectrum of each host and indicator combination with (R,R) and (S,S) hydrobenzoin, the absorbance of a racemic mixture of hydrobenzoin was also recorded. The ΔAbs of each host with the indicators are listed in Table 3(see SI Appendix). As described above, host (S,S)-2 was also found to be the most enantioselective host for hydrobenzoin by traditional methods, thereby validating the reliability of the screening process.
Fig. 4.
Results of the screening plate showing displacement of indicator BPG (60 μM) from host (S,S)-2 (200 μM) with (R,R)-hydrobenzoin (5 mM), racemic mixture (5 mM) and (S,S)-hydrobenzoin (5 mM). All solutions were made in 100% MeOH, 10 mM para-toluenesulfonic acid and Hunig's base buffer (pH 7.4). All measurements were taken at 25 °C.
Table 3.
Screening plate ΔAbs between (R,R)-hydrobenzoin and (S,S)-hydrobenzoin (5 mM) calculated for A at 480 nm, AC at 540 nm, ML at 380 nm, BPG at 570 nm, PG at 420 nm, and PV at 520 nm
| Indicators | Host (S,S)-2 | Host (R,R,R,S)-4 | Host (S)-6 | Host (S)-8 |
|---|---|---|---|---|
| A | 0.015 | 0.004 | 0.003 | 0.023 |
| AC | 0.017 | 0.1 | 0.012 | 0.006 |
| BPG | 0.237 | 0.062 | 0.05 | 0.017 |
| ML | 0.103 | 0.064 | 0.048 | 0.027 |
| PG | 0.04 | 0.052 | 0.019 | 0.039 |
| PV | 0.107 | 0.045 | 0.046 | 0.025 |
Host (S)-6 and host (S)-8 also showed good enantioselectivity with BPG at 10 mM concentration of hydrobenzoin with a ΔAbs of 0.095 and 0.139, respectively. Although host (R,R,R,S)-4 showed reasonable enantioselectivity using ML with a ΔAbs of 0.064 at 5 mM concentration of hydrobenzoin. Another chiral 1,2-diol may show a good response with a different indicator and host combination.
Training the ANN (Step 3).
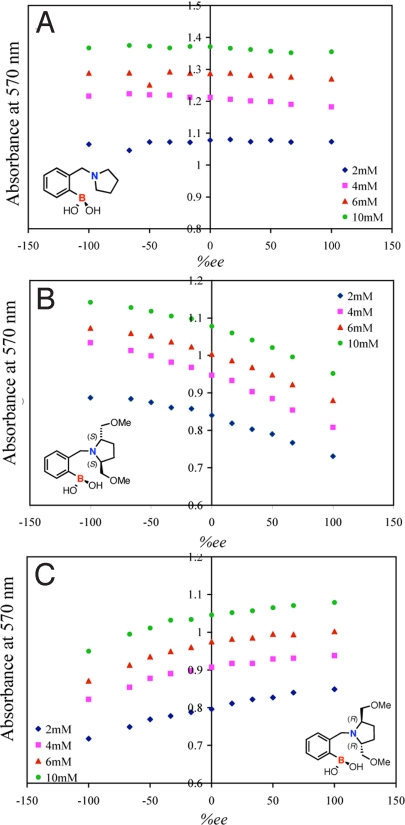
The third step of our protocol calls for the training of an ANN. The results from the screening plate revealed that the enantiomers of host-2 with BPG were the best pair for enantiomeric discrimination of hydrobenzoin. Therefore, 3 training plates with 3 hosts (host-1, host (S,S)-2 and host (R,R)-2) were made, all by using BPG as the indicator. Two enantiomers of host-2 were used in the assay because they are cross-reactive, meaning their responses are equal and opposite to the change in ee of the analyte. For example host (S,S)-2 is selective toward (S,S)-hydrobenzoin over (R,R)-hydrobenzoin, whereas host (R,R)-2 is selective toward (R,R)-hydrobenzoin over (S,S)-hydrobenzoin, and from our previous studies, we know that cross-reactivity enhances the accuracy of the assay (15). A training set consisting of 11 ee values (100, 80, 60, 40, 20, 0, −20, −40, −60, −80, and −100)%, created at 4 different total concentrations of hydrobenzoin (2, 4, 6, and 10 mM) for each host, generated a total of 44 cases. Because host-1 is achiral, it responds only to the change in concentration of the analyte, whereas host (S,S)-2 and host (R,R)-2 respond to both the change in concentration and the change in ee of the analyte. The absorbance values at 570 nm recorded by a 96-well plate reader for the concentrations and ee values of hydrobenzoin described above are shown in Fig. 5. As observed, the absorbance values of the 2 enantiomeric host indicator combinations for the 2 enantiomeric guests is not equal (i.e., the absorbance value of host (S,S)-2 with (R,R) hydrobenzoin differs from the absorbance value of host (R,R)-2 with (S,S) hydrobenzoin at most by ±0.03 Abs). This loss in accuracy is due to the use of a 96-well plate and the robotic plate loader. Therefore, by using both enantiomers of host-2 we are able to compensate for this error in the analysis.
Fig. 5.
ANN training set, ee titration at 570 nm of host-1 (1,200 μM) and BPG (60 μM) (A), host (S,S)-2 (200 μM) with BPG (60 μM) (B), and host (R,R)-2 (200 μM) with BPG (60 μM) (C) at 4 different concentrations of hydrobenzoin (2 mM, 4 mM, 6 mM, and 10 mM). All solutions were made in 100% MeOH, 10 mM para-toluenesulfonic acid, and Hunig's base buffer (pH 7.4). All measurements were taken at 25 °C.
The data from these ee titrations was used as a training set for the development of an ANN (25). The Statistica Neural Networks program has an embedded intelligent problem solver (IPS) function, which automatically generates several neural networks that are suitable for the designated problem. The input layer contains the absorbance of each ee titration from 540 to 580 nm at an interval of 2 nm, thus a total of 21 absorbance values. Multiple wavelengths were used to increase the accuracy of the analysis. When only the 1 wavelength (570 nm shown in Fig. 5) was used in the analysis of unknown samples, the error in [G]t and ee was ±0.89 and 6.5%, respectively). This wavelength range was recorded for the 3 hosts, making a total of 63 absorbance values for each of the 44 cases that differ in ee and [G]t. The outputs were total guest concentration [G]t and percentage of (R,R)-hydrobenzoin (%RR). Because ANN does not work well with negative values, %RR was used instead of ee in the neural network. A 3-layered MLP network with 63 inputs, 46 hidden units, and 2 outputs was used for the current study. Its selection was based on both its performance rating and our experience with MLP neural networks (26, 27). The MLP network is then trained with a back propagation algorithm, where the differences between the desired and the actual output values are minimized.
Final Analysis, Steps 4 and 5.
An analysis plate was made where unknown samples with varying ee and [G]t values were tested. Sixteen unknown samples were made completely independently of the training set. The unknown samples were placed in the same plate as the training set (see SI Appendix) to speed up the analysis. The absorbance values of the unknown samples were entered in the network and the network predicted [G]t and %RR of the unknown sample. The %RR predicted by ANN was then converted into ee (Table 4). The total time involving plate preparation, ANN training, and prediction of ee and [G]t for the 16 unknown samples was ≈32 min. The error for the 16 samples was calculated in the form of average absolute error and was determined to be ±0.17 mM for [G]t in the range of 3–8 mM and ±3.5% for ee. The ee correlation graph between the predicted ee and the known ee at 3 and 8 mM has a regression (R2) of 0.9803 and 0.9956, respectively (see SI Appendix).
Table 4.
Determination of ee and [G]t of 16 unknown samples of hydrobenzoin
| [G]t, mM | ANN [G]t, mM | Absolute error [G]t | Ee, % | ANN ee, % | Absolute error ee, % |
|---|---|---|---|---|---|
| 3.00 | 2.72 | 0.28 | 58.30 | 60.84 | 2.54 |
| 3.00 | 3.05 | 0.05 | 41.66 | 44.34 | 2.68 |
| 3.00 | 2.96 | 0.04 | 25.00 | 24.24 | 0.76 |
| 3.00 | 2.71 | 0.29 | 8.34 | −3.20 | 5.14 |
| 3.00 | 2.99 | 0.01 | −8.34 | −14.12 | 5.78 |
| 3.00 | 3.11 | 0.11 | −25.00 | −30.00 | 5.00 |
| 3.00 | 2.80 | 0.20 | −41.66 | −39.04 | 2.62 |
| 3.00 | 2.92 | 0.08 | −58.34 | −52.86 | 5.48 |
| 8.00 | 7.92 | 0.08 | 58.30 | 54.94 | 3.36 |
| 8.00 | 7.93 | 0.07 | 41.66 | 33.52 | 8.14 |
| 8.00 | 8.07 | 0.07 | 25.00 | 21.92 | 3.08 |
| 8.00 | 8.23 | 0.23 | 8.34 | 4.18 | 4.16 |
| 8.00 | 8.48 | 0.48 | −8.34 | −9.44 | 1.10 |
| 8.00 | 8.05 | 0.05 | −25.00 | −24.18 | 0.82 |
| 8.00 | 8.07 | 0.07 | −41.66 | −38.48 | 3.18 |
| 8.00 | 8.59 | 0.59 | −58.34 | −60.96 | 2.62 |
Average absolute error = (∣actual value∣ − ∣experimental value∣).
Analysis of a Catalytic Asymmetric Dihydroxylation (Application of Steps 4 and 5).
Encouraged by the extremely high accuracy of our HTS protocol for the ee values of hydrobenzoin, we decided to test the method on an actual asymmetric reaction. Because our analysis was designed for a chiral diol, we naturally turned to the Sharpless dihydroxylation reaction.
Two different commercially available cinchona alkaloids ligands, hydroquinidine 1,4-phthalazinediyl diether (DHQD)2PHAL and hydroquinidine 4-chlorobenzoate (DHAD)CLB, were examined. The literature reports that the reaction of trans-stilbene with (DHQD)2PHAL gives (R,R)-hydrobenzoin in 89% yield and 95% ee, and the reaction of trans-stilbene with (DHAD)CLB also gives (R,R)-hydrobenzoin but in a 89% yield and 85% ee (19, 21).
Before using the analytes from Sharpless asymmetric dihydroxylation reactions in the 96-well plate analysis, we wanted to verify the literature-reported ee values of the reactions as a control. James et al. (28) have recently developed a 3-component derivatization protocol for the determination of enantiomeric excess of chiral diols (see SI Appendix). The asymmetric dihydroxylation reactions with the 2 chinconoid ligands were analyzed by this method, and their ees were determined to be 96% ee with (DHQD)2PHAL and 86% ee with (DHAD)CLB, similar to the literature values of 95% and 85% ee before recrystallization. With a confident ee value in hand, we turned to the testing of the optical HTS-method.
In addition to the analysis of the Sharpless reactions using our optical method, we desired to test an expanded training set that covers more concentration values as a means of lowering the error in [G]t and ee determination to increase the reliability of the network, which is inversely related to the number of processing units in the hidden layer. Eleven ee values (100, 80, 60, 40, 20, 0, −20, −40, −60, −80, and −100)% at 6 different concentrations (2, 3, 4, 6, 8, and 10 mM) were placed in the 96-well plate with host-1, host (S,S)-2, and host (R,R)-2 using BPG as the indicator, making a total of 66 training cases for the network (see SI Appendix). With the help of Statistica Neural Network software a 3-layered MLP network was created with 166 inputs per each of the 66 training cases (absorbance values of each host from 550 to 600 nm at an interval of 1 nm), giving 35 hidden units and 2 outputs (%RR, [G]t). As predicted, the number of processing units is significantly lower in this network as compared with the network generated before.
Asymmetric dihydroxylation reactions were performed according to the literature procedure (19, 21). The products were isolated and dissolved in the MeOH buffer solutions. Two samples of each asymmetric dihydroxylation reaction were made at 2 different [G]t (5 and 7 mM). These samples were then evaluated with all 3 hosts [host-1, host-2(S,S), host-2(R,R)], and BPG, and their absorbance values were analyzed by the MLP network generated. The ee and [G]t values predicted by the network are listed in Table 5. The [G]t and ee values predicted by the network were in excellent agreement with actual ee and [G]t values. The average absolute error for [G]t was ±0.40 mM in the range of 5–7 mM and ±2.4% for ee values. The slightly higher [G]t error could be because the unknowns were individually synthesized in the laboratory, and the error may actually reside in the “known value.” Thus, using this optical analysis, we were able to easily discriminate between the 96% and 86% ee. Presumably, dozens to hundreds of unknowns could be similarly analyzed in parallel with similar errors.
Table 5.
Determination of ee and [G]t of Sharpless asymmetric dihydroxylation reaction
| [G]t, mM | ANN [G]t, mM | Absolute error [G]t | ee*, % | ANN ee, % | Absolute error ee |
|---|---|---|---|---|---|
| 5.00 | 4.51 | 0.49 | 96 | 94.44 | 1.56 |
| 7.00 | 7.09 | 0.09 | 96 | 96.42 | 0.42 |
| 5.00 | 4.49 | 0.51 | 86 | 93.24 | 7.24 |
| 7.00 | 6.49 | 0.51 | 86 | 86.28 | 0.28 |
*As determined by 1H NMR.
Summary
In summary, we have introduced a stepwise protocol for the creation of high-throughput screening methods using optical analyses in 96-well plates that exploit enantioselective indicator-displacement assays. The first step involves finding the optimal host-to-indicator ratios, which are set values to be used in any future analysis. The second and third steps are analysis-specific and involve finding the best host/indicator duo for enantiodiscrimination and for training an artificial neural network, respectively. The fourth and fifth steps involve analysis plates containing samples of unknown ee and [G]t values and ANN data analysis. The errors in ee resulting from the analysis of true unknowns were remarkably low, in the 3.4% range for ee and ±0.17 mM for [G]t. Just to prove the utility of the system for analysis of catalytic reactions, the method developed specifically for hydrobenzoin was used to analyze ligands for the Sharpless asymmetric dihydroxylation reaction, and we confirmed the literature values and lowered the errors even further on ee by using a larger training set. This work expands the scope of enantioselective indicator displacement assays to a complete protocol amenable to HTS.
Materials and Methods
Synthesis of the Boronic Acid Host.
Full experimental details and the characterization data for all of the boronic acid hosts synthesized in this work (1–8) are given in SI Appendix.
UV-Vis Titrations.
UV-vis measurements were performed on a Beckman DU-640 UV-vis spectrophotometer. Stock solutions of hosts, indicators, and analytes were made in 10 mM solutions of para-toluenesulfonic acid and Hunig's base (N,N-diisopropylethylamine) in 100% spectral grade degassed methanol, and the pH of all of the solutions was adjusted to 7.4. All measurements were taken at 25 °C.
The binding constant KHI of the host to the indicator was calculated by measuring the change in the absorbance of the indicator with the addition of the host, generating a 1:1 binding isotherm. The concentration of the indicator used was adjusted so that the maximum absorbance from 300 to 600 nm was in the range of 0.2–1.6 over the course of titration (see SI Appendix).
The binding constant between the host and the analyte KHG was calculated by measuring the change in absorbance of the host indicator solution with the addition of the analyte. PV was the selected indicator for this analysis. The optimum ratio of host to PV was used (≈90% saturation) as determined by their 1:1 binding isotherm (see SI Appendix).
The 96-Well Plate Analysis.
Arrays were made by mixing hosts, indicators, and analyte stock solutions within Costar EIA/RIA polystyrene 96-well flat-bottom plates. Absorbance spectra were recorded at ambient temperature on a BioTek Synergy 4 multidetection microplate reader. A BioTek Precision microplate pipetting system was used to add stock solutions to the 96-well plate. Each well contained a total solution volume of 300 μL. After making the plate, it was sealed with a UC-500 sealing film to prevent solvent evaporation.
Two different screening plates were designed at 2 different analyte (hydrobenzoin) concentrations 5 and 10 mM, and the optimum ratios (≈90% saturation) of each chiral host with each indicator was added to each well of the 96-well plate (see SI Appendix). The training and the analysis plate for each host were combined on 1 plate to speed up the analysis (see SI Appendix). Three training/analysis plates were designed. First with host 1 (1,200 μM)/BPG (60 μM), second with host (S,S)-2 (200 μM)/BPG (60 μM), and a third with host (R,R)-2 (200 μM)/BPG (60 μM). The layout for the training set was such that the concentration of the analyte (R,R)-hydrobenzoin and (S,S)-hydrobenzoin would vary along each row of the plate, whereas the ee of the solution varied from 100% to −100%.
Supplementary Material
Acknowledgments.
We gratefully acknowledge Christopher Welch of Merck Pharmaceuticals for helpful discussions. This work was supported by National Institutes of Health Grant 5 R01 GM077437 and Welch Foundation Grant F-1151.
Footnotes
The authors declare no conflict of interest.
This article is a PNAS Direct Submission.
This article contains supporting information online at www.pnas.org/cgi/content/full/0809530106/DCSupplemental.
References
- 1.Jaroch S, Weinmann H, Zietler K. Asymmetric organocatalysis. Chem Med Chem. 2007;2:1261–1264. doi: 10.1002/cmdc.200700109. [DOI] [PubMed] [Google Scholar]
- 2.Hoveyda AH. Catalyst discovery through combinatorial chemistry. Chem Biol. 1998;5:R187–R191. doi: 10.1016/s1074-5521(98)90155-7. [DOI] [PubMed] [Google Scholar]
- 3.Ding K, Du H, Yuan Y, Long J. Combinatorial chemistry approach to chiral catalyst engineering and screening: Rational design and serendipity. Chem Eur J. 2004;10:2872–2884. doi: 10.1002/chem.200305707. [DOI] [PubMed] [Google Scholar]
- 4.Traverse JF, Snapper ML. High-throughput methods for the development of new catalytic asymmetric reactions. Drug Discovery Today. 2002;7:1002–1012. doi: 10.1016/s1359-6446(02)02436-4. [DOI] [PubMed] [Google Scholar]
- 5.Stambuli JP, Hartwig JF. Recent advances in the discovery of organometallic catalysts using high-throughput screening assays. Curr Opin Chem Biol. 2003;7:420–426. doi: 10.1016/s1367-5931(03)00056-5. [DOI] [PubMed] [Google Scholar]
- 6.Anslyn EV. Supramolecular analytical chemistry. J Org Chem. 2007;72:687–699. doi: 10.1021/jo0617971. [DOI] [PubMed] [Google Scholar]
- 7.Rancke-Madsen E. Indicators. 1st Ed. New York: Pergamon; 1972. [Google Scholar]
- 8.Zhu L, Zhong Z, Anslyn EV. Guidelines in implementing enantioselective indicator-displacement assays for alpha-hydroxycarboxylates and diols. J Am Chem Soc. 2005;127:4260–4269. doi: 10.1021/ja0435945. [DOI] [PubMed] [Google Scholar]
- 9.Nguyen BT, Anslyn EV. Indicator-displacement assays. Coord Chem Rev. 2006;250(23+24):3118–3127. [Google Scholar]
- 10.Zhang T, Anslyn EV. A colorimetric boronic acid based sensing ensemble for carboxy and phospho sugars. Org Lett. 2006;8:1649–1652. doi: 10.1021/ol060279+. [DOI] [PubMed] [Google Scholar]
- 11.Mei X, Wolf C. Determination of enantiomeric excess and concentration of unprotected amino acids, amines, amino alcohols, and carboxylic acids by competitive binding assays with a chiral scandium complex. J Am Chem Soc. 2006;128:13326–13327. doi: 10.1021/ja0636486. [DOI] [PubMed] [Google Scholar]
- 12.Piatek AM, Bomble YJ, Wiskur SL, Anslyn EV. Threshold detection using indicator-displacement assays: An application in the analysis of malate in pinot noir grapes. J Am Chem Soc. 2004;126:6072–6077. doi: 10.1021/ja040006e. [DOI] [PubMed] [Google Scholar]
- 13.Zhu L, Anslyn EV. Facile quantification of enantiomeric excess and concentration with indicator-displacement assays: An example in the analyses of alpha-hydroxyacids. J Am Chem Soc. 2004;126:3676–3677. doi: 10.1021/ja031839s. [DOI] [PubMed] [Google Scholar]
- 14.Folmer-Andersen JF, Lynch VM, Anslyn EV. Colorimetric enantiodiscrimination of alpha-amino acids in protic media. J Am Chem Soc. 2005;127:7986–7987. doi: 10.1021/ja052029e. [DOI] [PubMed] [Google Scholar]
- 15.Folmer-Andersen JF, Kitamura M, Anslyn EV. Pattern-based discrimination of enantiomeric and structurally similar amino acids: An optical mimic of the mammalian taste response. J Am Chem Soc. 2006;128:5652–5653. doi: 10.1021/ja061313i. [DOI] [PubMed] [Google Scholar]
- 16.Zhu L, Shabbir SH, Anslyn EV. Two methods for the determination of enantiomeric excess and concentration of a chiral sample with a single spectroscopic measurement. Chem Eur J. 2007;13:99–104. doi: 10.1002/chem.200600402. [DOI] [PubMed] [Google Scholar]
- 17.Burns JA, Whitesides GM. Feed-forward neural network in chemistry: Mathematical system for classification and pattern recognition. Chem Rev. 1993;93:2583–2601. [Google Scholar]
- 18.Jansson PA. Neural networks an overview. Anal Chem. 1991;63:357A–362A. [Google Scholar]
- 19.Jacobsen EN, Marko I, Mungall WS, Schroeder G, Sharpless KB. Asymmetric dihydroxylation via ligand-accelerated catalysis. J Am Chem Soc. 1988;110:1968–1970. [Google Scholar]
- 20.Walsh PJ, Sharpless KB. Asymmetric dihydroxylation (AD) of alpha, beta-unsaturated ketones. Synlett. 1993;8:605–606. [Google Scholar]
- 21.Siedel MC, et al. Studies on the asymmetric dihydroxylation of advance bryostatin C-ring. Synthesis. 2004;9:1391–1398. [Google Scholar]
- 22.Green FJ. The Sigma–Aldrich Handbook of Stains, Dyes and Indicators. Milwaukee: Aldrich Chemical Company, Inc.; 1990. [Google Scholar]
- 23.Zhong Z, Anslyn Eric V. A colorimetric sensing ensemble for heparin. J Am Chem Soc. 2002;124:9014–9015. doi: 10.1021/ja020505k. [DOI] [PubMed] [Google Scholar]
- 24.Connors KA. Binding Constant, The Measurment of Molecular Complex Stability. New York: Wiley; 1987. [Google Scholar]
- 25.StatSoft I. Tulsa, OK: StatSoft, Inc; [Google Scholar]
- 26.McCleskey SC, Floriano PN, Wiskur SL, Anslyn EV, McDevitt JT. Citrate and calcium determination in flavored vodkas using artificial neural networks. Tetrahedron. 2003;59:10089–10092. [Google Scholar]
- 27.Wiskur SL, Floriano PN, Anslyn EV, McDevitt JT. A multicomponent sensing ensemble in solution: Differentiation between structurally similar analytes. Angew Chem Int Ed. 2003;42:2070–2072. doi: 10.1002/anie.200351058. [DOI] [PubMed] [Google Scholar]
- 28.Kelly AM, Perez-Fuertes Y, Arimori S, Bull SD, James TD. Simple protocol for NMR analysis of the enantiomeric purity of diols. Org Lett. 2006;8:1971–1974. doi: 10.1021/ol0602351. [DOI] [PubMed] [Google Scholar]
Associated Data
This section collects any data citations, data availability statements, or supplementary materials included in this article.


