Abstract
We present an analysis of the key steps involved in the DNA-directed assembly of nanoparticles into crystallites and polycrystalline aggregates. Additionally, the rate of crystal growth as a function of increased DNA linker length, solution temperature, and self-complementary versus non-self-complementary DNA linker strands (1- versus 2-component systems) has been studied. The data show that the crystals grow via a 3-step process: an initial “random binding” phase resulting in disordered DNA-AuNP aggregates, followed by localized reorganization and subsequent growth of crystalline domain size, where the resulting crystals are well-ordered at all subsequent stages of growth.
Keywords: DNA materials, SAXS, self assembly
The chemical and physical properties of most materials are determined by the placement of individual atoms relative to one another (1–4). These atom–atom interactions include forces such as covalent and ionic bonds, Van der Waals forces and London dispersion forces. However, in the field of nanomaterials, the length scales of particle assembly are significantly larger and the assembly process is governed by a more complicated set of interactions (5–7). The tailorable arrangement of nanoscale materials through directed-mechanisms has proven to be the most practical method to create ordered arrangements of nanoparticles in solution (8–15); crystalline nanoparticle aggregates have potential implications for the development of materials with unique plasmonic (16, 17), photonic (18, 19), electrical (20), and magnetic properties (21). Previous strategies developed to create well-ordered nanoscale assemblies have used electrostatic interactions (11, 12), hydrogen bonding networks (10, 13), and peptide recognition properties (9). Over a decade ago, we introduced the concept of synthetically programmable particle assembly through the use of DNA and polyvalent oligonucleotide nanoparticle conjugates (22). Recently, we (23, 24) and the Gang group (25) independently used these principles to construct highly-ordered nanoparticle crystallites via DNA hybridization, where crystal type and lattice parameters can be programmed through design of DNA linker.
The formation of these crystals involves multiple types of molecular interactions that are highly dependent and predictable based on the DNA base sequence (22, 26–28), where the hybridization of the DNA linkers drives the crystallization process. Moreover, the ultimate structure formed is typically the one that maximizes the number of hybridization events, and therefore, if enough thermal energy is provided, the system will typically equilibrate to this structure (23, 25, 29, 30). Indeed, only highly-ordered crystalline aggregates present the thermodynamically most stable arrangement of nanoparticles, because they allow for a maximum of nearest-neighbor complementary DNA interactions.
Previous work has shown that the complexity of the nanoparticle systems studied thus far necessitates significant thermal annealing to create the thermodynamically favorable crystal structures (23, 24). Combining particles at 22 °C often yields disordered structures or semicrystalline materials that lack the long-range order observed after the annealing process. Fundamentally, the mechanism by which individual DNA-functionalized nanoparticles (DNA-AuNPs) assemble into crystalline materials is of interest because the forces governing crystal formation are significantly different from their atomic analogues. Herein, we present a study of the formation process for these DNA-linked nanoparticle crystal systems, using synchrotron small angle X-Ray scattering (SAXS) to monitor the initial formation and growth of highly-ordered 3-dimensional assemblies in 3 distinct crystal systems, showing variations in assembly parameters as a function of solution temperature, DNA length and 1- versus 2-component DNA-AuNP systems.
Results and Discussion
Formation of Aggregates via Slow Cooling Through the Melting Temperature.
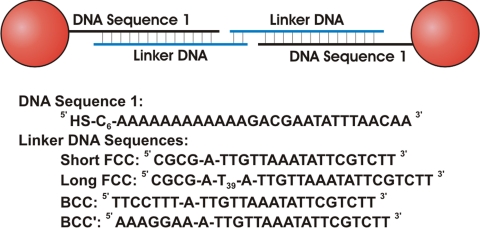
DNA-functionalized gold nanoparticles (DNA-AuNPs) were prepared via the addition of excess synthetic oligonucleotides containing a 5′ hexyl-thiol moiety to a solution of either 5- or 10-nm AuNPs (9.3 ± 0.9 nm, 5.3 nm ± 0.7 nm). This was followed by a slow salting process (see Materials and Methods), which yielded densely functionalized oligonucleotide nanoparticle conjugates (58 ± 5 DNA strands/NP for 10-nm AuNPs, 12 ± 3 DNA strands/NP for 5-nm AuNPs). The salt screens the electrostatic interactions between negatively charged oligonucleotides, allowing for more DNA strands to enter the coordination sphere of the particle (31). All of the DNA sequences used in these experiments have been demonstrated to direct the formation of well-ordered nanoparticle “crystal structures” (Scheme 1) (23, 24). DNA-AuNPs were crystallized via the addition of linker strands containing a region complementary to the AuNP-bound DNA Sequence 1, an unpaired flexor base and a 4- or 7-base linker-linker overlap region. The long FCC linker (Scheme 1, containing a poly dT sequence to increase DNA length) was hybridized with a complementary 39-mer poly dA filler DNA before hybridizing the linker to the DNA-AuNPs. Note that DNA-linkers containing a self-complementary 5′ CGCG end form face-centered cubic (FCC) crystals, whereas DNA-linkers that contain non-self-complementary 5′ ends form body-centered cubic (BCC) crystals and that, individually, these short overlap sequences result in weak binding interactions. Aggregation of the particles is induced because of the polyvalent nature of the DNA-AuNPs, which allows for multiple linker-linker hybridization events per particle. Using the method devised by Marky et al. (32), we can estimate the ΔG of hybridization for these overlaps to be 10.3 and 12.0 kcal/mol, respectively. Given these similarly low estimated values, we can qualitatively state that the slight difference between the 2 calculated free energies of hybridization is negligible for these individually-weak DNA binding interactions. Therefore, the energetics of DNA hybridization can be treated as approximately equivalent for the self- and non-self-complementary systems, meaning that differences in hybridization energies should not play a major factor in these studies.
Scheme 1.
DNA sequences used. AuNPs were functionalized with ≈58 ± 5 (10-nm AuNPs) or 12 ± 3 (5-nm AuNPs) strands of DNA Sequence 1, linked via a 5′ hexyl-thiol moiety. Crystals were formed via the addition of linker sequences with a 3′ end complementary to the Au-bound DNA, a single flexor base used to increase DNA strand flexibility, and a 5′ end that is either self-complementary (FCC crystals) or non-self-complementary (BCC crystals).
All structures were characterized by small angle X-ray scattering (SAXS), using Argonne National Laboratory's Advanced Photon Source. In brief, particles in solution are treated as inelastic Rayleigh scatterers—photons that are scattered by the nanoparticles in solution create distinct 2-dimensional interference patterns that are dependent on the position of the scatterers relative to one another (33). Azimuthal averaging of these 2-dimensional patterns yields 1-dimensional scans that allow for an analysis of DNA-AuNP crystal structures obtained.
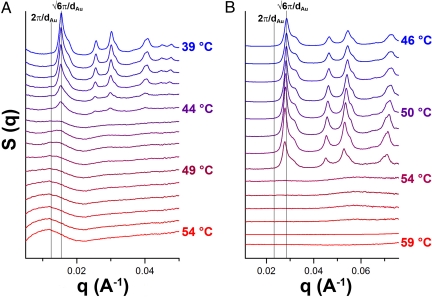
We first studied the effects of increased DNA interconnect length on the rate of crystal formation, using 10-nm DNA-AuNPs and the long FCC and short FCC linkers presented in Scheme 1. Initial aggregates were formed via the addition of linker DNA strands (1.25 μM) to DNA-AuNPs (25 nM) in a microcentrifuge tube. This solution was then transferred to a 2.0-mm quartz capillary tube for annealing and X-ray scattering experiments. The samples were heated to 60 °C (several degrees above the temperature at which the DNA-AuNP aggregates dissociate) and slowly cooled at a rate of 1 °C/min, with images taken at ≈1-min intervals. The scattering experiments show that there is a progression from dispersed (nonaggregated) DNA-AuNPs to an ordered crystal structure that is observable over the monitored time scale (Fig. 1). However, the long FCC linker system reaches the highest-ordered state more slowly (Fig. 1A) than the short FCC linker system (Fig. 1B). As shown in Fig. 1B, the short FCC linker shows a distinct shift between unbound DNA-AuNPs and FCC crystals, with no readily observable intermediates. Maximum intensity peaks appear within 3 minutes of the first observed FCC scattering peak. (The subsequent decrease in intensity can be attributed to both DNA degradation because of X-ray beam exposure and aggregates settling out of the path of the X-ray beam.) However, the long FCC linker system shows an initial weak, diffuse peak, which persists for several minutes before the formation of peaks corresponding to an FCC crystal. The peaks associated with the FCC structure continue to increase in intensity for several minutes after their initial formation. A complete analysis of this transition will be discussed at the end of this section.
Fig. 1.
One-dimensional SAXS profiles of the long FCC (A) and short FCC (B) linker systems. As the DNA-AuNPs are cooled from above their melting temperature (1 °C/min), initial DNA linkages create random aggregates with no long-range order. Given time to anneal, these aggregates then reform into well-ordered crystalline domains. The vertical lines notated as 2π/ΔAu and π/ΔAu indicate the position of predicted q0 peaks corresponding to disordered aggregates and perfect FCC crystals, respectively.
Analogous to the growth of molecular crystals (34), the size of the crystalline domains only increases if the incoming building materials adopt positions in the growing crystal that are an extension of the ordered structure. It is important to make a distinction between growth in the size of the crystalline domain and growth in the size of the DNA-AuNP aggregate. Crystal growth refers to the movement of a DNA-AuNP from a position outside of the crystal lattice to a position in line with the existing crystallographic arrangement. This can occur via binding of a free DNA-AuNP, or via repositioning of an already bound DNA-AuNP from a disordered to an ordered position. Conversely, aggregate growth refers to the binding of a DNA-AuNP to an existing aggregate (regardless of whether or not the AuNP is ordered relative to the crystal lattice). Therefore, crystal growth can occur at a rate different from the rate of aggregate growth.
The rate of crystal growth as a function of DNA length is largely affected by 2 principle factors: an increased flexibility of the DNA interconnects and an increase in the distance between the outer “recognition” end of the DNA strands with increasing DNA linker length. In the long FCC linker system, the increased flexibility of the DNA strands provides a larger number of degrees of freedom for both the DNA and the DNA-AuNP, thereby slowing the rate of crystal growth (although not necessarily aggregate growth). Additionally, an increase in DNA linker length increases the hydrodynamic radius of the DNA-AuNP, resulting in a subsequent increase in the distance between the free ends of the DNA strands (≈6.6 nm for short FCC, ≈11.9 nm for long FCC) on 1 particle, due to surface curvature. In order for a DNA-AuNP to move into a position in line with the existing crystal lattice, the DNA strands linking the AuNP must undergo dehybridization and rehybridization events to allow the AuNP to move to a position where the largest number of DNA duplexes can occur (the most stable crystal formation). If the DNA strands do not undergo this process, the DNA-AuNPs are locked into the initial, disordered structure. Increasing the distance between the free ends of the linking DNA strands decreases the rate at which these subsequent DNA hybridization events can occur during the reorganization process. This in turn results in the long FCC DNA-AuNP aggregates restructuring more slowly than their short FCC linker counterparts.
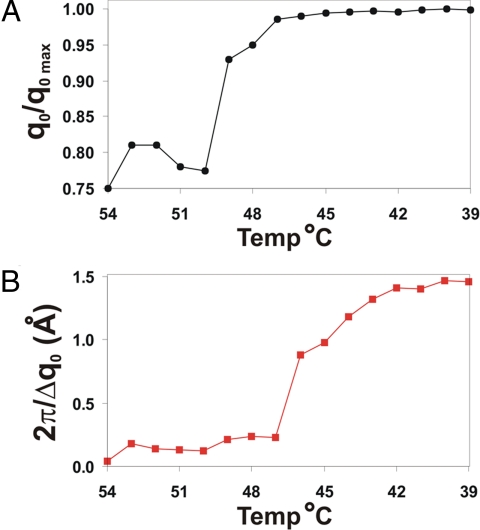
As we state above, a clear delineation of the transition from unbound DNA-AuNPs to crystals can be seen with the long FCC linker system, which allows us to probe the method of crystal formation. In this system, the first appearance of the first-order DNA-AuNP scattering peak (q0) occurs at 54 °C; however, this peak is broad and centered at a q-value noticeably lower than the position of the q0 peak of the highest ordered crystal (T = 39 °C). The breadth and weak intensity of this peak indicates that the aggregates are both small and highly disordered, whereas the position of the q0 peak indicates that the crystallographic arrangement of nanoparticles is different from the aggregates observed at later stages of growth. By plotting the q0 peak positions relative to the q0 peak position of the most ordered crystal (q0/q0 max) (Fig. 2A), we can see that there is a shift in peak position between 50 and 47 °C. We attribute this to a reorganization of the nanoparticles within the aggregate—for FCC crystals and amorphous aggregates, the q0 peak position should occur at values of π/dAu and 2π/dAu, respectively, where dAu is the distance between DNA-AuNP nearest neighbors. Note that, for a system with the same interparticle spacing, the peak positions for FCC and disordered crystals occur at relative values of 1.0 and ≈0.82, further indicating that the structural shift seen in Fig. 2A is due to a transition from amorphous aggregates to a crystalline material. Other possible crystalline arrangements such as hexagonal close-packed (HCP) or random hexagonal close-packed (rHCP) would exhibit a q0 peak position very close to that of FCC. However, we can distinguish between FCC crystals and these other structures by comparing the relative positions of higher order scattering peaks—the appearance of peaks at (/3)q0 and (/3)q0 (along with the positions of other, higher order scattering peaks) confirms that the crystals are FCC.
Fig. 2.
Plots demonstrating the growth of crystalline aggregates in the long FCC linker system. (A) Plot of q0/q0max, showing the appearance of NP scattering peaks at 54 °C and the transition to an FCC formation between 50 and 49 °C. (B) Plot of 2π/Δq0, demonstrating the growth in nanocrystal size at temperatures <47 °C, where larger values of 2π/Δq0 indicate larger crystalline domains.
Furthermore, if we plot the value of 2π/Δq0 (an indicator of crystal size, where Δq0 represents the radial full-width at half maximum of the q0 peak) versus temperature, we see that there is an increase in 2π/Δq0 values starting at a temperature of 46 °C; the larger values indicate growth of the crystalline domain size (Fig. 2B). It is interesting to note that, although we see the presence of noticeable crystalline domains at a temperature of 49 °C, these crystals remain small until a temperature of 46 °C. Because the temperature difference between these 2 phases is minor, it is more probable that the delay in crystal growth is a function of time and not a function of decreased temperature.
From these data, we can project that the method of crystal growth is as follows (Scheme 2): As the DNA-AuNPs cool below their melting temperature, they quickly form aggregates consisting of a small number of nanoparticles in a disordered packing arrangement. As the aggregate size increases slowly with time, the nanoparticles within the aggregates rearrange to form FCC crystalline domains at a rate dependent on the length of the DNA linker strands. These aggregates remain highly ordered as their size increases.
Scheme 2.
DNA-AuNP crystal growth. (A) As the DNA-AuNPs first condense in solution, they form small amorphous aggregates with no observable crystallinity. (B) These aggregates then undergo a structural shift, forming small crystalline domains that are highly ordered at all subsequent stages of crystal growth. (C) The small colloidal crystals grow into larger crystals.
In Situ Measurements of Formation.
Because the nonisothermal behavior of the DNA-AuNPs is affected by the rate of cooling, we also performed an analysis of crystal formation at various constant temperatures. The use of an ultrafast CCD detector coupled with stopped-flow instrumentation allowed us to monitor the in situ formation and early stages of crystal growth at multiple temperatures. To form FCC crystals, solutions of DNA-AuNPs and linker strands were transferred to separate chambers of a stopped-flow apparatus, heated to the appropriate temperature and subsequently combined via simultaneous injection into a 2.0 mm capillary in the path of the X-Ray beam. There was a <0.25-s delay between the 2 solutions' combination and their reaching the capillary. The same procedure was followed to form BCC crystals; however, solutions of DNA-AuNPs and either linker strand BCC or BCC′ were combined in separate microcentrifuge tubes and heated to 45 °C for 30 min to allow the linkers to hybridize onto the DNA-AuNPs. The solutions were then injected simultaneously into the capillary to induce particle aggregation.
Solutions of 200 nM DNA-AuNPs with 5.3 ± 0.7-nm cores, 2 μM DNA linkers were used for these studies. Smaller particles prevented the DNA-AuNP aggregates from settling out of solution, thereby giving more uniform SAXS patterns over the time scales studied. Higher concentrations of nanoparticles were necessary (as compared with the aforementioned studies), because 5-nm AuNPs exhibit an 8-fold weaker scattering of the X-rays than 10-nm AuNPs. DNA-AuNP crystals made from 10-nm Au particles were also analyzed using the same methods described here, with results that are comparable to those discussed below. However, the data were of lesser quality because of the previously-mentioned issue of aggregates settling out of the path of the X-ray beam. These data are presented in Figs. S1 and S2.
Upon combination of DNA-AuNPs and linkers, X-ray diffraction scans were taken with 10-ms exposures at a rate of 0.25 s per scan for 3 min. Then, additional scans were taken at 5-s intervals. These shorter exposure times resulted in weaker scattering intensities but were necessary to prevent substantial DNA degradation due to X-ray beam exposure.
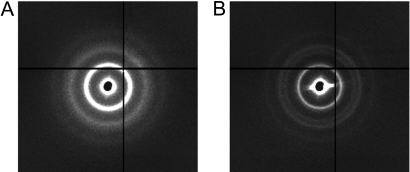
As was previously determined, high temperatures are necessary to form the most ordered crystal structures (23–25). Shown in Fig. 3 are the 2-dimensional SAXS patterns obtained for the short FCC linker system, combined and allowed to aggregate at 22 and 40 °C, respectively. The 22 °C structure is typical of a close-packed amorphous aggregate that shows no long range order, whereas the 40 °C structure is characteristic of a FCC arrangement of nanoparticles. It is clear that the kinetic product is the close-packed amorphous aggregate, whereas the ordered crystal is thermodynamically more favorable; when combined at lower temperatures, the DNA-AuNPs quickly aggregate in a disordered arrangement. Indeed, highly-ordered crystals are formed only when enough thermal energy is present to allow for rearrangement of the linking DNA strands.
Fig. 3.
Crystal structures obtained at different temperatures. (A) SAXS pattern obtained for the 1-component (short FCC) system obtained after 5 min at 22 °C. (B) SAXS pattern of the same system as in A after combination and 5 min of annealing at 40 °C. Note that A demonstrates a more diffuse scattering pattern that is associated with a random or close-packed arrangement of particles, whereas B demonstrates a sharp FCC scattering pattern.
Interestingly, we have shown that the dynamics of both initial DNA hybridization and crystal formation are remarkably fast for the DNA-AuNPs with shorter interconnects (the short FCC and BCC systems) at 40 °C. Nanoparticles formed aggregates in <0.3 s and the largest crystalline domains were observed within ≈20 and 60 s for the BCC and short FCC systems, respectively. The long FCC system forms ordered crystals more slowly, as previously demonstrated—disordered aggregates form quickly, but they are not transformed into appreciable crystalline domains during the time scale of analysis. Indeed, they exhibit only the beginnings of rearrangement at the end of the 5-min data collection period (Fig. S3).
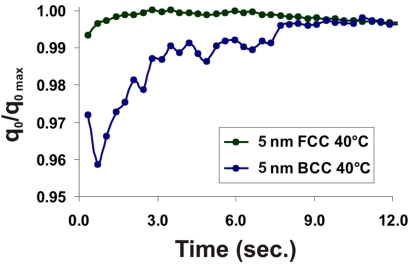
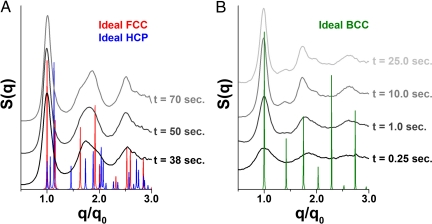
To compare the differences in the rates of formation between 1- and 2-component crystal systems, we plotted the shift of q0 peak position of both BCC and short-linker FCC systems as a function of time (Fig. 4; 10-nm data in Fig. S4). We can see that for BCC systems, the q0 values increase slightly during the first few seconds of formation, reaching a maximum in <12 s. The 1-component FCC system demonstrates only a small shift in q0 peak position, even at early stages of crystal growth. However, an analysis of the 1-dimensional SAXS patterns (Fig. 5A and Fig. S5) shows that, at early stages of growth, the DNA-AuNPs form highly disordered HCP crystals that readjust to the more densely-packed FCC crystals over time. The HCP and FCC crystallographic arrangements are structurally and energetically (35) similar (with FCC being slightly favored), because both consist of planes of close-packed particles, differing only in the stacking arrangement of these planes relative to one another. This small transition explains the nearly constant value of q0 for the 1-component system, where the slight shift in q0 position is indicative of “tightening” of the DNA interconnects as the DNA pulls the AuNPs into their maximally ordered state. This most likely represents the final stages of reorganization observed when the nanoparticles were cooled from above their melting temperature. At the lower temperatures observed here (40 °C, compared with 46–53 °C for the slow cooling data), the DNA interconnects are more thermodynamically stable. Therefore, the initial products of aggregation are readily observable and allow one to monitor the transition from initial close-packed aggregates without significant long range order to well-defined FCC crystals. This was not seen at the higher temperatures of the slow-cooling experiment, where the thermodynamically less-favorable HCP crystals likely only formed transiently before the DNA-AuNPs dissociated or reorganized, thereby preventing them from being seen, given the temporal resolution of the slow-cooling data.
Fig. 4.
Plots of the progression of q0 peak position for FCC (green trace) and BCC (blue trace) crystals. The q0 peak position of maximally ordered crystals is assigned a value of 1.00; the shifts in peak position indicate that DNA-AuNPs designed to give FCC crystals exhibit only a slight shift in q0 position (<1%), whereas those designed to give BCC crystals transition from a more disordered phase on a very quick time scale, but do not reach maximal order for ≈10 s.
Fig. 5.
Structural transition for 1- and 2-component systems. (A) SAXS profiles for the 1-component (short FCC) system show that early stages of crystal growth (t = 38 s; data at t < 38 s present the same pattern with broader peaks) exhibit a scattering pattern more closely resembling an HCP arrangement, whereas later stage crystals correspond to an FCC arrangement (t = 70 s). A mixture of the crystal systems is observed at intermediate time points (t = 50 s). Modeled scattering profiles for FCC and HCP crystals are shown in red and blue, respectively. (B) One-dimensional scans for the 2-component DNA-AuNP system, with an initial formation of disordered aggregates that quickly rearranges to a BCC crystal lattice. After this initial restructuring, the peaks grow in intensity and sharpen, indicating the growth of well-ordered crystals. The modeled scattering pattern for a perfect BCC crystal is shown in green.
The slower rate of q0 shift for the BCC structure coincides with a greater amount of initial reorganization being required for more complex, 2-component DNA-AuNP systems to form large crystalline aggregates (Fig. 5B and Fig. S6). In the 1-component FCC system, the self-complementary DNA linker-linker overlap allows all DNA-AuNPs to participate in every particle additive step in the crystal growth process. In the 2-component BCC system, there is a competition between correct BCC–BCC′ linker-linker hybridization and mismatched BCC–BCC/BCC′–BCC′ interactions, resulting in a slower rate of aggregation. This dissimilarity can also be noted by the differences in the progression of the scattering profiles (Fig. 5). We can clearly see that the scattering pattern for an FCC crystal structure “grows in” on top of the close-packed amorphous scattering pattern, which results in an obscuring of the higher order FCC peaks during initial DNA-AuNP aggregation. The BCC system does not exhibit this phenomenon, because the 2nd order peak is clearly observable (although weak), even at initial stages of crystal growth.
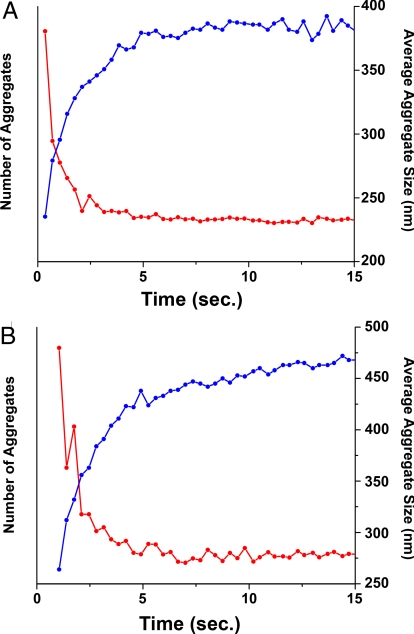
We can further elucidate the mechanism of crystal growth at early stages, as well as the kinetic differences in crystal growth for FCC and BCC systems, by analyzing the size and number of aggregates in solution. Fig. 6 shows plots of both DNA-AuNP aggregate size and number of DNA-AuNP aggregates as a function of time. (Information regarding the methods of calculation of these values can be found in SI Text.) As can be observed for both the short FCC and BCC systems, there is a steep rise in aggregate size that corresponds with a steep drop in the number of aggregates during the very early stages of crystal growth. This sharp transition is then followed by a slower rate of growth occurring with a constant number of aggregates. This indicates that the first phase of crystal growth (t < 1s) involves the formation of multiple small DNA-AuNP clusters with average sizes <100 nm. During the second phase of crystal growth (t ≈ 1–3 s), these small DNA-AuNP clusters coalesce to form much larger DNA-AuNP aggregates. A third, slower phase (t > 5 s) then occurs without significant changes in either the number of aggregates in solution or the position of the q0 peak.
Fig. 6.
Size and Number of DNA-AuNP Aggregates as a Function of Time. In both the 1-component (FCC) (A) and 2-component (BCC) (B) systems, there is an initial rapid drop in the number of nanoparticle aggregates (red traces) immediately after combining the solutions. This coincides with a rapid increase in the average aggregate size (blue traces). Although the 1-component system reaches maximum aggregate size in ≈5 s, the 2-component system is still increasing in size after 15 s. Note that the number of aggregates in solution is a relative value, because the cross-sectional area of the X-ray beam does not allow simultaneous probing of the entire sample.
Based on this analysis, we can further develop a complete method of crystal growth, as shown in Scheme 3. Initially, there is a very rapid aggregation of DNA-AuNPs into a large number of small clusters. The 1-component system forms clusters in a close-packed arrangement, whereas the 2-component system clusters exhibit a different, non-close-packed non-crystalline arrangement—this difference can be attributed to the previously-mentioned increased probability of correct DNA linker-linker hybridization interactions for the 1-component system, which allows for closer packing of the DNA-AuNPs and a less-significant thermodynamic difference between the HCP and FCC crystallographic arrangements. Once formed, these small clusters then rearrange to create small crystalline domains—the small crystals formed after reorientation of DNA-AuNPs then coalesce into polycrystalline aggregates. As time progresses, these aggregates (which initially are comprised of several crystalline domains that are not ordered relative to one another), transition into crystalline aggregates with larger crystal domains within them, as is evidenced by a very slow sharpening of q0 peaks at the last stages of the experiments. The polycrystalline aggregates at the end of the annealing process reached sizes on the order of several mm. Previous work by our group has focused on the growth of nanoparticle aggregates via thermal annealing, determining that non-crystalline aggregates grow through an Ostwald ripening-like process (36). Based on this previously-collected data and the SAXS data presented here, it is probable that both attached reorientation and Ostwald ripening processes are occurring simultaneously during the final phase of crystal growth and that both contribute to the growth of the final crystal structure.
Scheme 3.
Phases of early stage crystal growth. Initial nanoparticle aggregates are small and form quickly (phase 1). After forming, these small clusters then rearrange to a crystalline formation and begin to coalesce into large aggregates with multiple discrete crystalline domains (phase 2). After formation of large aggregates, these small domains slowly reorient to form a large DNA-AuNP crystal (phase 3). The data presented in Scheme 2 represent growth phases 1 and 3, because phase 2 occurred on a time scale unobservable with the previous experimental setup.
Conclusions
Understanding the mechanism of crystal growth for DNA-AuNPs synthesized via a bottom-up synthesis approach, where system design can be used to control the final structure obtained, is essential for the design of highly-ordered 3-dimensional structures. In this work, we have presented the mechanism of formation of these systems to follow the 3-step process of initial DNA-AuNP aggregation, localized restructuring into small, well-ordered crystalline domains, and small crystal-crystal aggregation and subsequent rearrangement to form large crystal systems with significant long-range order. We also have shown that higher temperatures are necessary for the formation of maximally ordered crystals and that increased DNA-interconnect length decreases the rate of crystal formation. Finally, we noted that there is a difference in both the rate of crystal formation and the rate of crystal-crystal aggregate restructuring obtained for 1- and 2-component systems, with 1-component systems creating initial aggregates more quickly, but requiring more time to create the most ordered crystals. These findings should allow for a more rational design of both DNA interconnects and formation methodologies for future DNA-AuNP crystal systems.
Materials and Methods
All AuNPs (5.3 ± 0.7 nm, 9.3 ± 0.9 nm) were obtained from BB International. All oligonucleotides were synthesized on an Expedite 8909 Nucleotide Synthesis System (ABI) and all reagents, including 5′ C6-thiol phosphoramidites, were obtained from Glen Research. After synthesis, oligonucleotides were purified by reverse-phase high performance liquid chromatography (RP-HPLC) on a Varian Microsorb C18 column (10 μm, 300 × 10 mm) with 0.03 M triethylammonium acetate (TEAA) at pH 7 and a 1% per minute gradient of acetonitrile at a flow rate of 3 mL/min with simultaneous monitoring of the UV signal of DNA at 254 nm.
DNA functionalized gold nanoparticles (DNA-AuNPs) were prepared according to procedures described in ref. 37. Before AuNP conjugation, 5′-thiol terminated oligonucleotides (DNA sequence 1) were reduced with DTT (obtained from Sigma-Aldrich), then purified using a NAP5 column (Amersham Pharmacia). The purified oligonucleotides were then added to solutions of gold nanoparticles and allowed to rest overnight. The solutions were then slowly salted over the course of several hours to final buffer concentrations of 0.5 M sodium chloride, 10 mM sodium phosphate (pH = 7.4), and 0.01% SDS. Unbound oligonucleotides were purified from solution via repeated centrifugation at 21,000 × g for 60 min (10-nm AuNPs) or 75,000 × g for 60 min (5-nm AuNPs), followed by removal of supernatant and redispersal in 0.02% SDS. After discarding the final supernatant, nanoparticles were redispersed in 0.5 M PBS.
SAXS measurements for crystal aggregate formation via slow cooling were performed at the DuPont-Northwestern-Dow Collaborative Access Team (DND-CAT) beamline of Argonne National Laboratory's Advanced Photon Source (APS) with X-rays of wavelength 0.83 Å (15 keV), calibrated using silver behenate as a standard. Two sets of slits were used to define and collimate the X-ray beam and a pinhole was used to remove parasitic scattering. Samples were irradiated with a 1.0 × 1.0 mm2 beam with exposure times of 0.2 s and scattered radiation was detected with a CCD area detector. One-dimensional SAXS data were obtained by azimuthally averaging the 2-dimensional scattering data and transformed into profiles of scattering intensity as a function of scattering vector, q = 4π(sinθ)/λ. All data were corrected for background scattering. In the presented data, X-ray scattering by DNA, buffer and windows is negligible compared with the scattering of the AuNPs.
In situ SAXS measurements were performed at beamline 12 of the APS with X-rays of wavelength 1.03 Å (12 keV). Each solution was transferred to a separate chamber of a Hamilton ML540 stopped-flow apparatus and heated to the appropriate temperature. The 2 samples were then combined via simultaneous injection at a rate of 1.0 mL/s into a 1.5-mm capillary placed in the path of the X-ray beam. Ten-millisecond exposures were used to prevent significant DNA degradation over the course of the experiments. Sample transmission was measured with a photodiode embedded in a beamstop, and the scattering pattern of a buffer solution was used as a background, subtracted from the collected data. CCD data were corrected following standard procedures such as dark current subtraction and incident flux normalization.
Supplementary Material
Acknowledgments.
This work was supported by the National Science Foundation Nanoscience and Engineering Center, the Air Force Office of Scientific Research, the National Cancer Institute Center for Cancer Nanotechnology Excellence, and a National Institutes of Health Director's Pioneer Award (to C.A.M.) and a U.S. Department of Homeland Security Graduate Fellowship under the DHS Scholarship and Fellowship Program (to H.D.H.). Portions of this work were performed at the DuPont-Northwestern-Dow Collaborative Access Team (DND-CAT) located at Sector 5 of the Advanced Photon Source. The DuPont-Northwestern-Dow Collaborative Access Team is supported by E. I. DuPont de Nemours & Co., The Dow Chemical Company, and the State of Illinois. Use of the Advanced Photon Source was supported by U.S. Department of Energy, Office of Science, Office of Basic Energy Sciences, under Contract DE-AC02-06CH11357.
Footnotes
The authors declare no conflict of interest.
This article is a PNAS Direct Submission.
This article contains supporting information online at www.pnas.org/cgi/content/full/0900630106/DCSupplemental.
References
- 1.Atkins P, de Paula J. Physical Chemistry. New York: W.H. Freeman and Company; 2006. [Google Scholar]
- 2.Lalena JN, Cleary DA. Principles of Inorg Mater Design. Hoboken, New Jersey: John Wiley and Sons; 2004. [Google Scholar]
- 3.Latimer WM, Hildebrand JH. Reference Book of Inorganic Chemistry. The MacMillan Company; 1947. [Google Scholar]
- 4.Newnham RE. Properties of Materials. New York: Oxford Univ Press; 2005. [Google Scholar]
- 5.Love JC, Estroff LA, Kriebel JK, Nuzzo RG, Whitesides GM. Self-assembled monolayers of thiolates on metals as a form of nanotechnology. Chem Rev. 2005;105:1103–1170. doi: 10.1021/cr0300789. [DOI] [PubMed] [Google Scholar]
- 6.Zhang H, Edwards EW, Wang D, Mohwald H. Directing the self-assembly of nanocrystals beyond colloidal crystallization. Phys Chem Chem Phys. 2006;8:3288–3299. doi: 10.1039/b604745a. [DOI] [PubMed] [Google Scholar]
- 7.Pileni MP. Self-assembly of inorganic nanocrystals: Fabrication and collective intrinsic properties. Acc Chem Res. 2007;40:685–693. doi: 10.1021/ar6000582. [DOI] [PubMed] [Google Scholar]
- 8.Niemeyer CM, Simon U. DNA-based assembly of metal nanoparticles. Eur J Inorg Chem. 2005:3641–3655. [Google Scholar]
- 9.Boal AK, et al. Self-assembly of nanoparticles into structured spherical and network aggregates. Nature. 2000;404:746–748. doi: 10.1038/35008037. [DOI] [PubMed] [Google Scholar]
- 10.Hao E, Lian T. Layer-by-layer assembly of CdSe nanoparticles based on hydrogen bonding. Langmuir. 2000;16:7879–7881. [Google Scholar]
- 11.Kalsin AM, et al. Electrostatic self-assembly of binary nanoparticle crystals with a diamond-like lattice. Science. 2006;312:420–424. doi: 10.1126/science.1125124. [DOI] [PubMed] [Google Scholar]
- 12.Leunissen ME, et al. Ionic colloidal crystals of oppositely charged particles. Nature. 2005;437:235–240. doi: 10.1038/nature03946. [DOI] [PubMed] [Google Scholar]
- 13.Lu C, Wu N, Jiao X, Luo C, Cao W. Micropatterns constructed from Au nanoparticles. Chem Comm. 2003;9:1056–1057. doi: 10.1039/b301059g. [DOI] [PubMed] [Google Scholar]
- 14.Xia Y, Rogers JA, Paul KE, Whitesides GM. Unconventional methods for fabricating and patterning nanostructures. Chem Rev. 1999;99:1823–1848. doi: 10.1021/cr980002q. [DOI] [PubMed] [Google Scholar]
- 15.Storhoff JJ, Mirkin CA. Programmed materials synthesis with DNA. Chem Rev. 1999;99:1849–1862. doi: 10.1021/cr970071p. [DOI] [PubMed] [Google Scholar]
- 16.Maier SA, et al. Local detection of electromagnetic energy transport below the diffraction limit in metal nanoparticle plasmon waveguides. Nat Mater. 2003;2:229–232. doi: 10.1038/nmat852. [DOI] [PubMed] [Google Scholar]
- 17.Tao A, Sinsermsuksakul P, Yang P. Tunable plasmonic lattices of silver nanocrystals. Nat Nano. 2007;2:435–440. doi: 10.1038/nnano.2007.189. [DOI] [PubMed] [Google Scholar]
- 18.Chuang CM, Lu WB, Su WF, Lin CM, Chen YF. Manipulation of luminescence from CdSe nanoparticles by three-dimensional photonic crystal. J Appl Phys. 2005;97 096104. [Google Scholar]
- 19.Xia D, Zhang J, He X, Brueck SRJ. Fabrication of three-dimensional photonic crystal structures by interferometric lithography and nanoparticle self-assembly. Appl Phys Lett. 2008;93 071105–071103. [Google Scholar]
- 20.Urban JJ, Talapin DV, Shevchenko EV, Kagan CR, Murray CB. Synergism in binary nanocrystal superlattices leads to enhanced p-type conductivity in self-assembled PbTe/Ag2Te thin films. Nat Mater. 2007;6:115–121. doi: 10.1038/nmat1826. [DOI] [PubMed] [Google Scholar]
- 21.Hoinville J, et al. High density magnetic recording on protein-derived nanoparticles. J Appl Phys. 2003;93:7187–7189. [Google Scholar]
- 22.Mirkin CA, Letsinger RL, Mucic RC, Storhoff JJ. A DNA-based method for rationally assembling nanoparticles into macroscopic materials. Nature. 1996;382:607–609. doi: 10.1038/382607a0. [DOI] [PubMed] [Google Scholar]
- 23.Park SY, et al. DNA-programmable nanoparticle crystallization. Nature. 2008;451:553–556. doi: 10.1038/nature06508. [DOI] [PubMed] [Google Scholar]
- 24.Hill HD, et al. Controlling the lattice parameters of gold nanoparticle FCC crystals with duplex DNA linkers. Nano Lett. 2008;8:2341–2344. doi: 10.1021/nl8011787. [DOI] [PMC free article] [PubMed] [Google Scholar]
- 25.Nykypanchuk D, Maye MM, van der Lelie D, Gang O. DNA-guided crystallization of colloidal nanoparticles. Nature. 2008;451:549–552. doi: 10.1038/nature06560. [DOI] [PubMed] [Google Scholar]
- 26.Mucic RC, Storhoff JJ, Mirkin CA, Letsinger RL. DNA-directed synthesis of binary nanoparticle network materials. J Am Chem Soc. 1998;120:12674–12675. [Google Scholar]
- 27.Taton TA, Mucic RC, Mirkin CA, Letsinger RL. The DNA-mediated formation of supramolecular mono- and multilayered nanoparticle structures. J Am Chem Soc. 2000;122:6305–6306. [Google Scholar]
- 28.Li Z, Mirkin CA. G-quartet-induced nanoparticle assembly. J Am Chem Soc. 2005;127:11568–11569. doi: 10.1021/ja053547s. [DOI] [PubMed] [Google Scholar]
- 29.Storhoff JJ, et al. What controls the optical properties of DNA-linked gold nanoparticle assemblies? J Am Chem Soc. 2000;122:4640–4650. [Google Scholar]
- 30.Park SY, Lee J-S, Georganopoulou D, Mirkin CA, Schatz GC. Structures of DNA-linked nanoparticle aggregates. J Phys Chem B. 2006;110:12673–12681. doi: 10.1021/jp062212+. [DOI] [PubMed] [Google Scholar]
- 31.Hurst SJ, Lytton-Jean AKR, Mirkin CA. Maximizing DNA loading on a range of gold nanoparticle sizes. Anal Chem. 2006;78:8313–8318. doi: 10.1021/ac0613582. [DOI] [PMC free article] [PubMed] [Google Scholar]
- 32.Breslauer KJ, Frank R, Blocker H, Marky LA. Predicting DNA duplex stability from the base sequence. Proc Natl Acad Sci. 1986;83:3746–3750. doi: 10.1073/pnas.83.11.3746. [DOI] [PMC free article] [PubMed] [Google Scholar]
- 33.Guinier A, Fournet G. Small Angle Scattering of X-Rays. New York: John Wiley and Sons; 1955. [Google Scholar]
- 34.Ward MD. Bulk crystals to surfaces: Combining X-ray diffraction and atomic force microscopy to probe the structure and formation of crystal interfaces. Chem Rev. 2001;101:1697–1726. doi: 10.1021/cr000020j. [DOI] [PubMed] [Google Scholar]
- 35.Bolhuis PG, Frenkel D, Mau S, Huse DA. Entropy difference between crystal phases. Nature. 1997;388:235–236. [Google Scholar]
- 36.Jin RC, Wu GS, Li Z, Mirkin CA, Schatz GC. What controls the melting properties of DNA-linked gold nanoparticle assemblies? J Am Chem Soc. 2003;125:1643–1654. doi: 10.1021/ja021096v. [DOI] [PubMed] [Google Scholar]
- 37.Hill HD, Mirkin CA. The bio-barcode assay for the detection of protein and nucleic acid targets using DTT-induced ligand exchange. Nature Protocols. 2006;1:324–336. doi: 10.1038/nprot.2006.51. [DOI] [PubMed] [Google Scholar]
Associated Data
This section collects any data citations, data availability statements, or supplementary materials included in this article.


