

Abstract
Shear-induced melting and crystallization were investigated by confocal microscopy in concentrated colloidal suspensions of hard-sphere-like particles. Both silica and polymethylmethacrylate suspensions were sheared with a constant rate in either a countertranslating parallel plate shear cell or a counterrotating cone-plate shear cell. These instruments make it possible to track particles undergoing shear for extended periods of time in a plane of zero velocity. Although on large scales, the flow profile deviated from linearity, the crystal flowed in an aligned sliding layer structure at low shear rates. Higher shear rates caused the crystal to shear melt, but, contrary to expectations, the transition was not sudden. Instead, although the overall order decreased with shear rate, this was due to an increase in the nucleation of localized domains that temporarily lost and regained their ordered structure. Even at shear rates that were considered to have melted the crystal as a whole, ordered regions kept showing up at times, giving rise to very large fluctuations in 2D bond-orientational order parameters. Low shear rates induced initially disordered suspensions to crystallize. This time, the order parameter increased gradually in time without large fluctuations, indicating that shear-induced crystallization of hard spheres does not proceed via a nucleation and growth mechanism. We conclude that the dynamics of melting and crystallization under shear differ dramatically from their counterparts in quiescent suspensions.
The majority of complex fluids are non-Newtonian liquids. That is, when subjected to a shear flow, they exhibit shear thinning or shear thickening behavior. It has long been established that the macroscopic properties of a material are coupled to its microstructure. To understand the macroscopic behavior of flowing complex fluids, much research has been done on revealing the microstructure under shear.
Apart from shear thinning and shear thickening, also shear banding, which is characterized by a discontinuous jump in the flow profile, is observed for many complex fluids (1). For worm-like micellar systems this has been extensively studied (2–5). Shear banding has also been observed in rod-like colloidal suspensions (6) and in crystallizing suspensions of spherical colloids (7–10), but for the latter, the number of studies is limited. Zukoski and coworkers (11–14) found the origin of shear banding with rheometry and small angle neutron scattering. They found that colloidal crystals shear thin discontinuously and that this is associated with a transition from a polycrystalline structure to a sliding layer structure. For not too soft potentials, these sliding layers have a hexagonal symmetry (15, 16). By using microscopy, it has been shown that this transition also leads to a shear banded flow (7).
Shear has a dual influence on the order in colloidal suspensions. At high shear rates, it can disorder, or melt, a colloidal crystal (17–19), but at low shear rates or at low-amplitude oscillatory shear, it can induce order (20–22). Shear changes the growth kinetics, i.e., the induction time, density of nuclei, and crystal growth rate (23). This has been studied on soft spheres both with experiments (24, 25) and computer simulations (26–28). One of the characteristics reported for crystallization under flow is that the crystals align in 1 direction. Crystals with a different orientation are destroyed, after which they recrystallize in the preferred direction. Third, the nucleation rate depends on the stability of the crystal and liquid under shear. For soft spheres, the melting line shifts when a shear flow is applied (25, 26). For hard spheres, it is unknown whether or how the melting phase transition changes by shear, but a disordering transition is clearly evident from scattering experiments (16, 17).
Most studies of complex fluids under shear have been done with light, X-ray, or neutron scattering. Scattering techniques have the disadvantage that the data are averages over the sampled volume; information about local processes cannot be obtained. Real-space experiments, using microscopy, have been undertaken to study behavior under shear in more detail. Two-dimensional colloidal crystals at a liquid interface were observed in real-space (29, 30) showing the motion of strings of particles past each other when sheared. Shear-induced crystallization has been observed in 3 dimensions in hard sphere suspensions under low-frequency oscillatory shear by taking snapshots at the extremes of the oscillation cycle (31). When crystals were confined to a narrow gap by applying oscillatory shear, several unusual crystal structures were found (32). Finally, Palberg et al. (33) used a special microscopy method in which positional correlations of particles could be directly imaged but not individual particles themselves. For confined, very soft colloids, these authors observed a zig-zag motion of sliding hexagonal layers as well as a disordering transition at higher shear rates (34, 35). Despite these efforts, a unified picture of the structural transitions of colloidal crystals under shear is still far from complete. Shear alignment of colloids has already been used to align large colloidal crystals for photonic applications (36) even on a semiindustrial scale (37–39), and it has also been reported in the related process of spin-coating (40–43).
In previous work we examined sheared colloidal crystals in 3D using confocal microscopy and a counter rotating cone-plate shear cell (44, 45). The zig-zag motion of sliding hexagonal layers could be clearly observed and the local flow profile could be determined. As the shear rate was increased displacements of particles from their lattice positions grew larger, and particle diffusivity increased. The instrument used enables one to determine structure on a single-particle level. The counterrotation principle creates a plane of zero velocity in which a collection of particles can be tracked for an extended time. In the present work, we also used a counter translating parallel plate shear cell with a small enough plate separation that we could observe individual particles throughout the gap with a confocal microscope (46). This enabled us to obtain local information about the complete system. As we will show, local information is valuable in characterizing the sliding-layer structure and the observation of shear banding. Moreover, it reveals interesting differences between the local ordering and disordering dynamics in shear-induced melting and shear-induced crystallization. By looking at 2 different hard-sphere colloidal systems, we have tried to make sure that our observations were independent of system details of the interactions such as a short-ranged repulsion or the density mismatch with the solvent.
Results and Discussion
Flow Profile of Crystalline Suspensions.
In the parallel plate shear cell, flow throughout the gap can be observed. Previously, Derks et al. (44) noticed that locally the shear rate in a hard-sphere suspension that crystallizes completely at rest can be approximately twice as large as the overall applied shear rate. With the cone-plate shear cell that was used, it was only possible to image the lower 100 μm of the gap, which was 0.4 mm or 1.7 mm depending on the cone used. But the shear rate in the top part of that shear cell could not be measured.
We set the gap width of our parallel plate shear cell at <100 μm. This enabled us to measure the complete flow profile. Previous measurements showed that in the parallel plate shear cell, the flow profile of a dilute colloidal suspension of these silica particles in ETPTA at a volume fraction of φ = 0.22 was linear as expected (46). However, the flow profile of a partially crystallized suspension deviated from linearity.
Fig. 1A shows the flow profiles of a φ = 0.5 dispersion of 1.2-μm diameter silica particles in ETPTA. The profile shows 3 regions: 2 close to the plates where the shear rate was significantly higher than the overall applied shear rate and 1 in the middle of the cell where the shear rate was lower. Because the flow profiles are more or less antisymmetric, this cannot be explained by sedimentation of the silica particles (density 2 g/mL) in its medium (density 1.1 g/mL). The origin of the higher shear rate can be traced to the presence of ≈10 aligned crystal layers present at both walls, as seen from Fig. 1B, which is an xz-image taken right after cessation of the shear. In the middle of the cell, the particles were disordered or formed only small crystalline domains. This suspension was in the fluid–crystal coexistence part of the phase diagram, and the crystal phase is known from computer simulations to “wet” the wall (47); as was seen repeatedly in the experiments. Most likely, the hexagonal layers parallel to the walls slide over each other relatively easily, decreasing the local viscosity. This was also suggested earlier by rheological measurements (11, 13, 14).
Fig. 1.

Flow profiles of a φ = 0.5 dispersion of 1.2-μm diameter silica particles in ETPTA. (A) Flow profiles measured at several overall applied shear rates. The profiles were not linear; the local shear rate was significantly higher at both the top and bottom plate. (B) Confocal microscopy image of the velocity-gradient plane taken immediately after cessation of the flow and aligned with the flow profiles in A. At both walls, the particles arranged in crystalline layers, but in the middle, the structure was liquid like. Horizontal dashed lines indicate these boundaries and show the correspondence with the flow profiles. The gap width was 53 μm, the bottom plate was at 0 μm.
Note that the flow profiles have a common point of intersection located in the crystalline part of the suspension. The height of this point coincided with the zero-velocity plane in the case of a dilute suspension with a linear flow profile measured under the same shear conditions. In the case of a linear flow profile, it is obvious that the curves should intersect at the zero-velocity plane. It is not straightforward that bent flow profiles also cross in 1 point. They do so only when they have the same shape.
From the flow profiles in Fig. 1, the relative viscosities of the 3 bands can be deduced from the inverse of the slopes. The flow profiles were fitted to a third-order polynomial, and the local shear rate was calculated in the 3 bands. The shear rate in the top and bottom bands was 1.4 times and 1.6 times, respectively, as large as in the middle band. Thus, the viscosity of the sliding layer structure was ≈1.5 times lower than that of the disordered structure.
Because of the different viscosities of the ordered and disordered regions, the flow profile, and thus the local shear rate, may be expected to vary somewhat during melting and crystallization. The shear rates in the parallel plate shear cell mentioned in the remainder of this article are the overall applied shear rates. However, for the PMMA system in the cone-plate shear cell, the reported shear rates are the local shear rates determined by measuring the velocity of a few adjacent layers.
Shear-Induced Melting.
When a sufficiently high shear rate was applied to a crystallized suspension, the particles became disordered. The overall applied shear rate needed to induce shear melting was ≈2 s−1 for the silica suspension and ≈3 s−1 for the PMMA suspension. Snapshots of particles in the zero-velocity plane in Fig. 2 show how shear-induced melting of the silica system evolved in time at a shear rate of 2 s−1. In these experiments, the particles in the zero-velocity plane were fully crystalline at time 0, after which the shear was started. The order then decreased within the first 10–20 s. But after that, the state of the system remained highly dynamic: Local order now and then increased strongly, after which it decreased again and vice versa. At lower shear rates, the particles mostly remained ordered but sometimes formed local disordered domains that reordered after a few seconds. Thanks to the zero-velocity plane, we can be certain that it is the order in a fixed collection of particles that is fluctuating and not different collections with fixed but varying degrees of order passing the field of view.
Fig. 2.

Confocal microscopy images taken in the velocity–vorticity plane of an initially crystalline suspension of 1.2-μm diameter silica particles in ETPTA sheared with γ̇ = 2 s−1. Initially, the structure was crystalline, but it became largely disordered, although ordered domains kept forming temporarily. (Scale bars, 2 μm.)
To quantify the degree of order we calculated for each particle the 2D local bond-orientational order parameter ψ6.
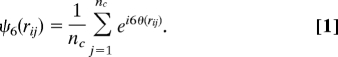 |
The order parameter ψ6 of particle i is a summation over all its nc nearest neighbors. θ(rij) is the angle between the vector connecting particle i to j and an arbitrary fixed reference axis. In a perfect hexagonal layer, the angles between the 6 nearest neighbors are multiples of 60° and ∣ψ6∣ = 1. Fig. 3 shows histograms of the ∣ψ6∣ values of the particles in an unsheared sample before it had crystallized (Fig. 3A) and after complete crystallization (Fig. 3B). Before crystallization, the histogram was broad and had a maximum of approximately ∣ψ6∣ = 0.5. After crystallization, almost all particles had a ∣ψ6∣ >0.8.
Fig. 3.

Histograms of ψ6 values of particles in an unsheared system before (A) and after (B) crystallization had set in. The data were collected on a suspension at the same volume fraction as in the shear melting and crystallization experiments.
Fig. 4 shows the average value of ∣ψ6∣ of all ≈100 particles in a frame as a function of time for the silica and the PMMA systems, respectively. For easy comparison, data taken at various shear rates are shown in the same graph with an offset in time. The silica system was always ordered at the start of an experiment, whereas the PMMA system had already been shearing at a constant rate for several minutes. When an initially crystalline suspension was sheared, the order showed a nearly instant decrease, after which 〈∣ψ6∣〉 kept fluctuating wildly around a certain average value. The same fluctuations in order parameter were observed in suspensions that had already been shearing for some time. The snapshots in Fig. 2 are accompanied by their ∣ψ6∣ to illustrate the large fluctuations in order. At higher shear rates, this time-averaged value decreased, but at the same time, the fluctuations became larger, making it difficult to say at which shear rate a suspension had completely melted. Even at the highest shear rates, ordered domains regularly nucleated and melted again.
Fig. 4.

The average order, quantified by ψ6, of initially crystalline suspensions sheared at increasing shear rates. (A) The results of a system of 1.2-μm silica particles in ETPTA. (B) The results for PMMA particles in CHB/decaline. The graphs at the different shear rates are shifted horizontally for clarity.
We further analyzed the distribution of ∣ψ6∣ values by determining ∣ψ6∣ for each individual particle over the whole time span and making histograms of these values (Fig. 5). The histograms of systems sheared at low shear rates (γ̇ < 2 s−1 for the silica system and γ̇ up to 2.3 s−1 for the PMMA system) show that the majority of particles had an order above ∣ψ6∣ = 0.9, similar to the histogram of a pure crystal (Fig. 3B) but that this majority shrinks with increasing shear rate. The overall features were the same for the 2 systems, except that the PMMA system was even more ordered than the silica system, probably owing to a higher volume fraction. When the shear rate was so high that the crystal had largely melted, a clear signature of ordered domains remained present, which is shown by the almost bimodal distribution. Otherwise, the broadness of the peak of ∣ψ6∣ values of the disordered particles is very similar to that of the particles in a pure unsheared liquid (Fig. 3A).
Fig. 5.

Histograms of the individual ψ6 values of particles during shear-induced melting. (A) The histograms for the silica system. (B) The histograms for the PMMA system.
Shear-Induced Crystallization.
In a different set of experiments, we started with a disordered suspension, which would have spontaneously crystallized had it been given sufficient time. Upon applying a low shear rate, the particles started to order much more rapidly. For the silica system, we first applied a very high shear rate to a suspension with a volume fraction in the fluid–crystal coexistence region to completely melt the system. Immediately after that, a low continuous shear rate of γ̇ = 0.45 s−1 was applied. We then monitored the local ordering of the particles in the zero-velocity plane. Snapshots of a time series are shown in Fig. 6. It can be seen that the order increased gradually until a hexagonal layer had been formed, of which the order did not change significantly in time. The orientation of the hexagonal layer was such that a close-packed line was always parallel to the flow direction. Crystallization of the PMMA system at a shear rate of 0.50 s−1 occurred in much the same way. In neither of the systems was the formation of locally ordered nuclei observed. Rather, the suspensions gradually ordered as a whole, i.e., without nucleation and growth. The gradual way of crystallization is also seen in a plot of the average absolute value of ψ6 versus time (Fig. 7). For both systems, 〈∣ψ6∣〉 showed a clear increasing trend, with relatively minor fluctuations. The only difference between the 2 systems is that the PMMA system needed less time to crystallize.
Fig. 6.

Confocal microscopy snapshots of a concentrated suspension of 1.2-μm diameter silica particles in ETPTA sheared with γ̇ = 0.45 s−1 starting as a disordered suspension. (Scale bars, 2 μm.)
Fig. 7.

Average order, quantified by ψ6, of 2 concentrated suspensions: (i) of 1.2-μm diameter silica particles in ETPTA, when it was sheared with a shear rate of 0.45 s−1 and (ii) of 1.67-μm diameter PMMA particles in a 1:1 mixture of CHB/decaline at 0.5 s−1. A horizontal line at a ψ6 value of 0.7 is drawn to show how long it takes the system to crystallize.
Fig. 8 again shows a histogram of the ∣ψ6∣ values of the individual particles after crystallization, i.e., when 〈∣ψ6∣〉 has surpassed a value of 0.7. The distribution peaks at a high ∣ψ6∣ value just as the histograms of the crystals that were sheared at a low shear rate and that of a pure crystal (Fig. 3B). However, the maximum appeared at a slightly lower ∣ψ6∣ value than that of the quiescent crystal. This is probably because the particles move along a zigzag path (15, 16, 45, 48, 49). During this motion, they undergo more collisions than without shear. Together with the hydrodynamics under shear, this leads to a larger mean square displacement and thus larger deviations from hexagonal symmetry within the layers (45).
Fig. 8.

Histogram of the individual ψ6 values of particles during shear-induced crystallization after the transition into a crystal.
Conclusions
We studied shear-induced melting and crystallization in 2 systems of hard-sphere-like colloidal suspensions above their crystallization volume fraction. By using confocal microscopy and specialized shear cells, it was possible to track individual particles for extended periods of time while the suspension was undergoing a constant shear rate. This made it possible to observe that shear melting proceeds by temporary melting of localized domains of particles. At increasing shear rate, particles spend more and more time in disordered environments, but even at the highest shear rates probed, ordered domains keep nucleating and melting indefinitely, whereas the suspension as a whole must be considered to have shear-melted. This was observed in snapshots of the system and reflected by the bond-orientational order parameter 〈∣ψ6∣〉 averaged over ≈100 particles, which showed a decreasing trend with shear rate but with large fluctuations.
These large local fluctuations in crystalline order are quite unexpected and have never been observed in earlier experiments using scattering methods, which may be explained by the insensitivity of scattering to local fluctuations. They were also not found in computer simulations, but some recent work hints at their presence: Molecular dynamics simulations of the interface between a sheared liquid and a strained crystal show large fluctuations in the crystalline order but only of the few particle layers near the interface, whereas fluctuations in the bulk phases remained small (50). Similarly, Brownian dynamics simulations of a pair of crystalline monolayers driven past each other show that the system alternates between liquid and crystalline states, with the system spending more time in the liquid state at higher drive (51, 52). This result is reminiscent of the melting scenario that we find, but it remains to be seen whether the fluctuations survive in bulk systems and when hydrodynamic interactions (HI) are included.
The melting scenario that we describe suggests that for hard spheres, it is difficult, if not impossible, to pinpoint a shear melting transition, such as has been described for soft-sphere suspensions on the basis of nonequilibrium Brownian dynamics simulations (26, 27, 48, 49) and scattering experiments (25). Why this should be so different is unclear. It is possible that the behavior is sensitive to the balance between electrostatic forces and hydrodynamic interactions. The nonequilibrium Brownian dynamics simulations do not include HI, but Stokesian dynamics simulations show that for hard spheres, HI strongly influence shear-induced structure (23, 53). It would be very interesting, therefore, to do particle-tracking experiments similar to ours on soft spheres.
Shear-induced crystallization of initially disordered suspensions followed a different scenario than shear melting. Here, the order parameter increased much more gradually in time with only small fluctuations. Localized ordered domains growing in a surrounding fluid, as would be expected in a nucleation and growth-type of mechanism, were not observed. This is again different from the picture painted by Brownian dynamics simulations on soft spheres (26, 28).
It is remarkable that the scenarios for shear melting and shear crystallization appear to be so different. Shear-induced melting is apparently a local process in which small ordered or disordered domains appear and disappear. Conversely, in shear-induced crystallization, the particles ordered collectively, without much local or temporal fluctuation. Strikingly, the scenario of melting and crystallization induced by shear described here are approximately opposite to that without shear. In the latter case, which is well established, it is crystallization that takes place through nucleation and growth, whereas melting proceeds uniformly from the surface of a crystal inward.
Materials and Methods
Colloidal Suspensions.
We studied 2 types of colloidal suspensions: a system with silica spheres and one with polymethylmethacrylate (PMMA) spheres. The silica system consisted of 1.2-μm diameter silica particles dispersed in ethoxylated trimethylolpropane triacrylate (EPTA) [MW 428, viscosity 0.072 Pa·s (measured with a TA Instruments AR1000-N rheometer), density = 1.1 × 10³ kg/m3); Aldrich]. This polar solvent matches the refractive index of the particles. In this system, the interparticle distance in a crystal formed by sedimentation was 1.1 times the particle diameter. The particle volume fraction was φ = 0.50, which is in the fluid–crystal coexistence region. A 0.4-μm diameter core of the particles had been labeled with FITC by the method described in ref. 54. This made it possible to image the particles with a confocal microscope after excitation of the dye with the 488-nm line of the Ar laser of the confocal microscope.
The PMMA system consisted of 1.67-μm diameter rhodamine labeled PMMA particles that were made by dispersion polymerization and sterically stabilized by a layer of poly(12-hydroxystearic acid) (PHS) (55, 56). They were dispersed in a 3:1 wt/wt mixture of cyclohexylbromide and cis-decalin, saturated with tetrabutylammoniumbromide (TBAB). In this mixture, the particles were nearly density- and refractive index-matched, and they behaved hard-sphere like (44). The particle volume fraction was φ = 0.57, which is in the crystal part of the phase diagram.
Shear Cells.
The experiments with the silica particles were performed in the parallel plate shear cell described and characterized in ref. 46. The PMMA system was sheared with the cone-plate shear cell described in detail in ref. 44. These shear cells could be mounted on top of an inverted confocal microscope (TCS-SP2; Leica).
For the parallel plate shear cell, the dimensions of the top glass plate were 30 mm in the x (velocity)-direction and 15 mm in the y (vorticity)-direction. The bottom glass plate was a standard no. 1 (thickness 0.13–0.16 mm) microscopy glass slide of size 50 × 24 mm. Because the working distance of the objective lens was 100 μm, when imaging through a no. 1 glass slide, the gap width was set <100 μm. This allowed us to image particles over the complete gap width of the cell. A parallel plate geometry is used in an oscillatory mode by necessity, but the large plates and small gap allowed a constant shear to be sustained unidirectionally for several minutes in the present experiments. To prevent unwanted capillary forces that might disturb the flow of the suspension, we overfilled the cell and used as much as 100 μL of dispersion for each experiment. The dispersion was placed on the bottom glass plate after which the top glass plate was lowered onto the droplet.
The cone of the cone-plate shear cell had an angle of 1° or 4°. The bottom plate was a no. 1 glass plate with a diameter of 6.5 cm. At the position of imaging, the gap width was 0.4 or 1.7 mm depending on the cone used.
In both shear cells, the bottom plate and top plate (cone) translated (rotated) in opposite directions. This established a plane of zero velocity with respect to the microscope. Particles in this plane had no net velocity and could therefore be imaged over a long period. In most experiments, the zero-velocity plane was a few layers above the bottom plate. This distance was such that wall effects were negligible.
Imaging.
Imaging was done with an inverted Leica TCS-SP2 confocal scanning laser microscope. We used a 100× Leica immersion objective with N.A. 1.4. The 488-nm laser line of an Argon laser was used for imaging the FITC-labeled silica particles and the 543-nm laser HeNe line for the rhodamine-PMMA particles. Scanning along the z-axis was done by using a piezo focusing drive (Physik Instrumente). This direction coincided with the gradient direction of the shear flow field. The positions of the particles were determined by using algorithms similar to those of Crocker and Grier (57).
There are various methods to determine the flow profile. We used the method introduced by Derks et al. (44). Images were taken in the velocity-gradient (xz)-plane at a slow scan rate. Such an image is built up by sequential scanning of horizontal lines along the x (velocity)-direction. While a particle is being scanned, it translates because of the shear and therefore appears deformed in the image. The local velocity is then calculated from the deformation by cross-correlating consecutive image lines, assigning the average particle displacement to the maximum correlation.
Acknowledgments.
We thank the Instrumentele Groep Fysica (Utrecht University) and, in particular, Joost Brand for the design and construction of the shear cells. This work is part of the research program of the Stichting voor Fundamenteel Onderzoek der Materie, which is supported by the Nederlandse Organisatie voor Wetenschappelijk Onderzoek.
Footnotes
The authors declare no conflict of interest.
This article is a PNAS Direct Submission.
References
- 1.Vermant J. Large-scale structures in sheared colloidal dispersions. Curr Opin Colloid Interface Sci. 2001;6:489–495. [Google Scholar]
- 2.Spenley NA, Cates ME, McLeish TCB. Nonlinear rheology of wormlike micelles. Phys Rev Lett. 1993;71:939–942. doi: 10.1103/PhysRevLett.71.939. [DOI] [PubMed] [Google Scholar]
- 3.Mair RW, Callaghan PT. Observation of shear banding in worm-like micelles by NMR velocity imaging. Europhys Lett. 1996;36:719–724. [Google Scholar]
- 4.Britton MM, Callaghan PT. Two-phase shear band structures at uniform stress. Phys Rev Lett. 1997;78:4930–4933. [Google Scholar]
- 5.Salmon JB, Colin A, Manneville S, Molino F. Velocity profiles in shear-banding wormlike micelles. Phys Rev Lett. 2003;90:228303. doi: 10.1103/PhysRevLett.90.228303. [DOI] [PubMed] [Google Scholar]
- 6.Dhont JKG, et al. Shear-banding and microstructure of colloids in shear flow. Faraday Discuss. 2003;123:157–172. doi: 10.1039/b205039k. [DOI] [PubMed] [Google Scholar]
- 7.Imhof A, van Blaaderen A, Dhont JKG. Shear melting of colloidal crystals of charged spheares studied with rheology and polarizing microscopy. Langmuir. 1994;10:3477–3484. [Google Scholar]
- 8.Volkova O, Cutillas S, Bossis G. Shear banded flows and nematic-to-isotropic transition in ER and MR fluids. Phys Rev Lett. 1999;82:233–236. [Google Scholar]
- 9.Palberg T, Würth M. Multiphase coexistence of non-linear rheology of colloidal dispersions as observed in a model capillary viscosimeter. J Phys I. 1996;6:237–244. [Google Scholar]
- 10.Cohen I, Davidovitch B, Schofield AB, Brenner MP, Weitz DA. Slip, yield and bands in colloidal crystals under oscillatory shear. Phys Rev Lett. 2006;97:215502. doi: 10.1103/PhysRevLett.97.215502. [DOI] [PubMed] [Google Scholar]
- 11.Chen LB, Zukoski CF. Discontinuous shear thinning in ordered suspensions. Phys Rev Lett. 1990;65:44–47. doi: 10.1103/PhysRevLett.65.44. [DOI] [PubMed] [Google Scholar]
- 12.Chen LB, et al. Structural changes and orientational order in a sheared colloidal suspension. Phys Rev Lett. 1992;69:688–691. doi: 10.1103/PhysRevLett.69.688. [DOI] [PubMed] [Google Scholar]
- 13.Chen LB, Chow MK, Ackerson BJ, Zukoski CF. Rheological and microstructural transitions in colloidal crystals. Langmuir. 1994;10:2817–2829. [Google Scholar]
- 14.Chen LB, Ackerson BJ, Zukoski CF. Rheological consequences of microstructural transitions in colloidal crystals. J Rheol. 1994;38:193–216. [Google Scholar]
- 15.Ackerson BJ, Hayter JB, Clark NA, Cotter L. Neutron scattering from charge stabilized suspensions undergoing shear. J Chem Phys. 1986;84:2344. [Google Scholar]
- 16.Ackerson BJ. Shear induced order and shear processing of model hard sphere suspensions. J Rheol. 1990;34:553. [Google Scholar]
- 17.Hoffman RL. Discontinuous and dilatant viscosity behavior in concentrated suspensions. II. Theory and experimental tests. J Colloid Interface Sci. 1974;46:491–506. [Google Scholar]
- 18.Ackerson BJ, Clark NA. Shear-induced melting. Phys Rev Lett. 1981;46:123–126. [Google Scholar]
- 19.Tomita M, van de Ven TGM. The structure of sheared ordered lattices. J Colloid Interface Sci. 1984;99:374–386. [Google Scholar]
- 20.Ackerson BJ, Pusey PN. Shear-induced order in suspensions of hard spheres. Phys Rev Lett. 1988;61:1033–1036. doi: 10.1103/PhysRevLett.61.1033. [DOI] [PubMed] [Google Scholar]
- 21.Ackerson BJ. Shear induced order of hard-sphere suspensions. J Phys Condens Matter. 1990;2:SA389–SA392. [Google Scholar]
- 22.Panine P, Narayanan T, Vermant J, Mewis J. Structure and rheology during shear-induced crystallization of a latex suspension. Phys Rev E. 2002;66:022401. doi: 10.1103/PhysRevE.66.022401. [DOI] [PubMed] [Google Scholar]
- 23.Vermant J, Solomon MJ. Flow-induced structure in colloidal suspensions. J Phys Condens Matter. 2005;17:R187–R216. [Google Scholar]
- 24.Tsuchida A, Takyo E, Taguchi K, Okubo T. Kinetic analysis of colloidal crystallization in shear flow. Colloid Polymer Sci. 2004;282:1105–1110. [Google Scholar]
- 25.Holmqvist P, Lettinga MP, Buitenhuis J, Dhont JKG. Crystallization kinetics of colloidal spheres under stationary shear flow. Langmuir. 2005;21:10976–10982. doi: 10.1021/la051490h. [DOI] [PubMed] [Google Scholar]
- 26.Butler S, Harrowell P. Kinetics of crystallization in a shearing colloidal suspension. Phys Rev E. 1995;52:6424–6430. doi: 10.1103/physreve.52.6424. [DOI] [PubMed] [Google Scholar]
- 27.Butler S, Harrowell P. The shear-induced disordering transition in a colloidal crystal—Nonequilibrium Brownian dynamic simulations. J Chem Phys. 1995;103:4653–4671. [Google Scholar]
- 28.Blaak R, Auer S, Frenkel D, Löwen H. Crystal nucleation of colloidal suspensions under shear. Phys Rev Lett. 2004;93:068303. doi: 10.1103/PhysRevLett.93.068303. [DOI] [PubMed] [Google Scholar]
- 29.Stancik EJ, et al. Structure and dynamics of particle monolayers at a liquid–liquid interface subjected to shear flow. Faraday Discuss. 2003;123:145–156. doi: 10.1039/b204382c. [DOI] [PubMed] [Google Scholar]
- 30.Stancik EJ, Hawkinson AL, Vermant J, Fuller GG. Dynamic transitions and oscillatory melting of a two-dimensional crystal subjected to shear flow. J Rheol. 2004;48:159–173. [Google Scholar]
- 31.Haw MD, Poon WCK, Pusey PN. Direct observation of oscillatory-shear-induced order in colloidal suspensions. Phys Rev E. 1998;57:6859–6864. [Google Scholar]
- 32.Cohen I, Mason TG, Weitz DA. Shear-induced configurations of confined colloidal suspensions. Phys Rev Lett. 2004;93:046001. doi: 10.1103/PhysRevLett.93.046001. [DOI] [PubMed] [Google Scholar]
- 33.Palberg T, Biehl R. Sheared colloidal crystals in confined geometry: A real space study on stationary structures under shear. Faraday Discuss. 2003;123:133–143. doi: 10.1039/b204821c. [DOI] [PubMed] [Google Scholar]
- 34.Biehl R, Palberg T. Modes of motion in a confined colloidal suspension under shear. Europhys Lett. 2004;66:291–295. [Google Scholar]
- 35.Stipp A, et al. Heterogeneous nucleation of colloidal melts under the influence of shearing fields. J Phys Condens Matter. 2004;16:S3885–S3902. [Google Scholar]
- 36.Kanai T, Sawada T, Toyotama A, Kitamura K. Air-pulse-drive fabrication of photonic crystal films of colloids with high spectral quality. Adv Funct Mater. 2005;15:25–29. [Google Scholar]
- 37.Ruhl T, Hellmann GP. Colloidal crystals in latex films: Rubbery opals. Macromol Chem Phys. 2001;202:3502–3505. [Google Scholar]
- 38.Ruhl T, Spahn P, Hellmann GP. Artificial opals prepared by melt compression. Polymer. 2003;44:7625–7634. [Google Scholar]
- 39.Ruhl T, Spahn P, Winkler H, Hellmann GP. Large area monodomain order in colloidal crystals. Macromol Chem Phys. 2004;205:1385–1393. [Google Scholar]
- 40.Jiang P, McFarland MJ. Large-scale fabrication of wafer-size colloidal crystals, macroporous polymers and nanocomposites by spin-coating. J Am Chem Soc. 2004;126:13778–13786. doi: 10.1021/ja0470923. [DOI] [PubMed] [Google Scholar]
- 41.Jiang P, Prasad T, McFarland MJ, Colvin VL. Two-dimensional nonclose-packed colloidal crystals formed by spincoating. Appl Phys Lett. 2006;89:011908. [Google Scholar]
- 42.Mihi A, Ocaña M, Míguez H. Oriented colloidal-crystal thin films by spin-coating microspheres dispersed in volatile media. Adv Mater. 2006;18:2244. [Google Scholar]
- 43.Xia DY, Brueck SRJ. A facile approach to directed assembly of patterns of nanoparticles using interference lithography and spin coating. Nano Lett. 2004;4:1295–1299. [Google Scholar]
- 44.Derks D, Wisman H, van Blaaderen A, Imhof A. Confocal microscopy of colloidal dispersions in shear flow using a counter-rotating cone-plate shear cell. J Phys Condens Matter. 2004;16:S3917–S3927. [Google Scholar]
- 45.Derks D, Wu YL, van Blaaderen A, Imhof A. Dynamics of colloidal crystals in shear flow. Soft Matter. 2009;5:1060–1065. [Google Scholar]
- 46.Wu YL, et al. A new parallel plate shear cell for in situ real-space measurements of complex fluids under shear flow. Rev Sci Intrum. 2007;78:103902. doi: 10.1063/1.2794226. [DOI] [PubMed] [Google Scholar]
- 47.Dijkstra M. Capillary freezing or complete wetting of hard spheres in a planar hard slit? Phys Rev Lett. 2004;93:108303. doi: 10.1103/PhysRevLett.93.108303. [DOI] [PubMed] [Google Scholar]
- 48.Stevens MJ, Robbins MO, Belak JF. Shear melting of colloids: A nonequilibrium phase diagram. Phys Rev Lett. 1991;66:3004–3007. doi: 10.1103/PhysRevLett.66.3004. [DOI] [PubMed] [Google Scholar]
- 49.Stevens MJ, Robbins MO. Simulations of shear-induced melting and ordering. Phys Rev E. 1993;48:3778–3792. doi: 10.1103/physreve.48.3778. [DOI] [PubMed] [Google Scholar]
- 50.Butler S, Harrowell P. Structure and stability of the interface between a strained crystal and a shearing liquid. Phys Rev E. 2003;67:051503. doi: 10.1103/PhysRevE.67.051503. [DOI] [PubMed] [Google Scholar]
- 51.Das M, Ramaswamy S, Ananthakrishna G. Melting–freezing cycles in a relatively sheared pair of crystalline monolayers. Europhys Lett. 2002;60:636–642. [Google Scholar]
- 52.Das M, Ananthakrishna G, Ramaswamy S. Collective stochastic resonance in shear-induced melting of sliding bilayers. Phys Rev E. 2003;68:061402. doi: 10.1103/PhysRevE.68.061402. [DOI] [PubMed] [Google Scholar]
- 53.Gray JJ, Bonnecaze RT. Rheology and dynamics of sheared arrays of colloidal particles. J Rheol. 1998;42:1121–1151. [Google Scholar]
- 54.van Blaaderen A, Vrij A. Synthesis and characterization of colloidal dispersions of fluorescent, monodisperse silica spheres. Langmuir. 1992;8:2921–2931. [Google Scholar]
- 55.Antl L, et al. The preparation of poly(methyl methacrylate) latices in non-aqueous media. Colloids Surf. 1986;17:67–78. [Google Scholar]
- 56.Bosma G, et al. Preparation of monodisperse, fluorescent PMMA-latex colloids by dispersion polymerization. J Colloid Interface Sci. 2002;245:292–300. doi: 10.1006/jcis.2001.7986. [DOI] [PubMed] [Google Scholar]
- 57.Crocker JC, Grier DG. Methods of digital video microscopy for colloidal studies. J Colloid Interface Sci. 1996;179:298–310. [Google Scholar]