

Abstract
OBJECTIVE
The objective of our study was to evaluate the feasibility of virtual unenhanced images reconstructed from a dual-energy CT scan to depict urinary stones in an iodine solution in a phantom study.
MATERIALS AND METHODS
Twenty urinary stones of different sizes (1.4-4.2 mm in short-axis diameter) were placed in plastic containers. The containers were consecutively filled with different concentrations of iodine solution (21, 43, 64, 85, and 107 mg/dL; CT attenuation value range, 510-2,310 H at 120 kVp). Dual-energy CT was repeated with 80-140 and 100-140 kVp pairs, two collimation-slice thickness combinations, and the presence or absence of a 4-cm-thick oil gel around the phantom. The iodine-subtraction virtual unenhanced images were reconstructed using commercial software. The images were evaluated by three radiologists in consensus for the visibility of the stones and the presence of residual nonsubtracted iodine. Stone visibility rates were compared between the 80-140 and 100-140 kVp pairs and the five different iodine concentrations.
RESULTS
Stone visibility rates with the 80-140 kVp pair were 99%, 93%, 96%, 94%, and 3% and those with the 100-140 kVp pair were 98%, 95%, 99%, 94%, and 99% for an iodine concentration of 21, 43, 64, 85, and 107 mg/dL, respectively. The poor visibility rate with 80-140 kVp and 107 mg/dL iodine concentration was due to the failure of iodine subtraction.
CONCLUSION
Dual-energy CT iodine-subtraction virtual unenhanced technique is capable of depicting urinary stones in iodine solutions of a diverse range of concentrations in a phantom study.
Keywords: dual-energy CT, genitourinary imaging, iodine-subtraction imaging technique, reconstructed images, urinary stones
Characterization of tissue and materials using dual-energy CT was first described in the late 1970s when CT technology was still in its infancy [1, 2]. The technique was not adapted widely for clinical use except for bone densitometry [3] due to immature CT technology. With new dual-source CT systems, dual-energy CT scans can be obtained simultaneously using two orthogonally positioned X-ray tube and detector sets. This capability eliminates the need for two separate scans with two different energy X-ray spectra and, therefore, eliminates misregistration due to patient motion or change in the contrast distribution between the two scans [4, 5].
The use of dual-source CT scanners has been shown to be effective in improving temporal resolution in coronary CT angiography [4, 6-8]. Subtraction of bone or calcium plaques from vessels on CT angiography using the dual-energy CT technique also appears promising [4]. Outside the realm of cardiovascular imaging, little experimentation with current dual-energy scanning techniques and subtraction imaging has been performed.
As a routine component of CT urograms for hematuria or suspected urothelial tumor, unenhanced scans are routinely obtained mainly to evaluate for the presence of urinary stones, and pyelographic phase scans are obtained after administration of iodinated contrast material to evaluate for the presence of urothelial carcinoma [9-12]. If virtual unenhanced scans reconstructed from pyelographic phase scans would allow the detection of urinary stones by means of automated subtraction of the iodine from the collecting system and ureters, one of the main purposes of unenhanced scans could be achieved without obtaining true unenhanced scans.
Thus, the purpose of our investigation was to evaluate the feasibility of virtual unenhanced images reconstructed from a dualenergy CT scan for the detection of urinary stones in iodine solutions in a phantom study.
Materials and Methods
Calibration Scans
Five different concentrations of iodine solution (21, 43, 64, 85, and 107 mg/dL) were created to simulate urine in the collecting system during the pyelographic phase of CT urography. The iodine solutions were created by diluting iodine contrast medium (iohexol [Omnipaque 350, GE Healthcare]) with saline. The iodine solution mixtures were placed in 3-mL syringes (9-mm diameter) and were then scanned with a dual-source CT scanner (Somatom Definition, Siemens Medical Solutions). First, a single-energy scan was obtained using 120 kVp. CT attenuation values of the iodine solution mixtures were measured by placing a circular region of interest (ROI). Dual-energy scans were then obtained with an 80-140 kVp pair, and scanning was repeated with a second 100-140 kVp pair. CT attenuation values of the iodine solution mixtures were again measured by placing a circular ROI. CT attenuation values versus iodine concentrations were plotted for each kVp pair scan. When the CT attenuation value was greater than 3,050 H, the data were discarded because the maximal measurable CT attenuation value was 3,070 H.
Slope from the best-fit linear regression line (CT attenuation value = A × iodine concentration + B), where A is slope and B is intercept, was calculated for each kVp pair scan, and the ratios of the two slopes—referred to as the “dual-energy ratios” [A (80 kVp) / A (140 kVp)] and [A (100 kVp) / A (140 kVp)]—were calculated.
Phantom Study
Twenty urinary stones of different compositions were used in this phantom study: seven uric acid stones, seven calcium hydroxyapatite stones, and six calcium oxalate stones. Each stone was placed in a 5 × 20 mm plastic container, and the container was filled with either saline or one of the five different concentration iodine solutions used in the calibration scan (Fig. 1). The plastic containers were placed in a renal proxy made from pork meat arranged in four rows of five containers. The long axes of the plastic containers were perpendicular to the CT gantry plane. The renal proxy was placed in a 32-cm water bath to simulate the attenuation of the body cavity (Fig. 2).
Fig. 1.
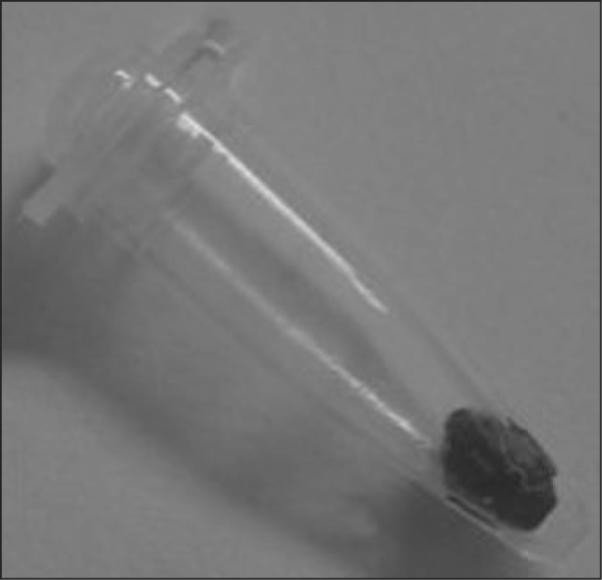
Photograph shows 5 × 20 mm plastic container containing stone.
Fig. 2.
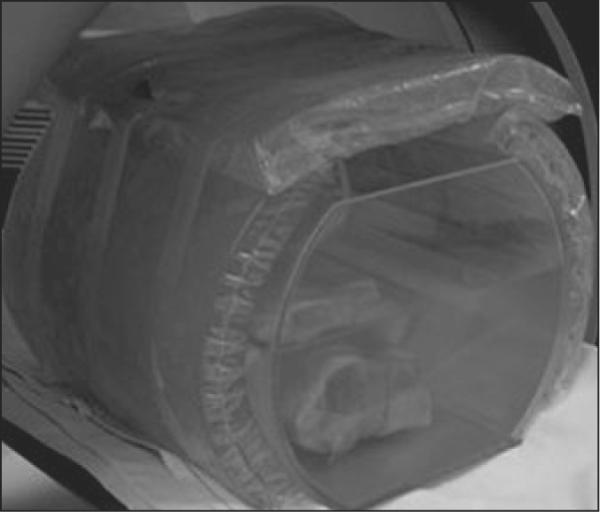
Photograph shows phantom. Twenty plastic containers were placed in renal proxy made from pork meat, and renal proxy was placed in 32-cm water bath to simulate body cavity. Phantom was surrounded by 4-cm-thick oil gel to simulate large patient.
A single-energy CT scan was obtained of the phantom first when the containers were filled with saline. The scan was obtained with 120 kVp and 240 mAs using a 64 × 0.6 mm collimation and 1-mm reconstruction slice thickness. This scan served as a standard-of-reference “true” unenhanced scan. The size and CT attenuation of each stone were measured by a single unblinded radiologist. Stone size was measured in the axial plane using electronic calipers, while the CT window width and level were fixed at 1,000 and 200 H, respectively. CT attenuation was measured by placing an elliptic ROI that encompassed approximately 80% of the stone's diameter.
The saline in all the plastic containers was then replaced with the lowest concentration iodine solution (i.e., 21 mg/dL). Dual-energy CT scans of the phantom were obtained using various scanning parameters: 80-140 kVp pair and 100-140 kVp pair; and collimation of 14 × 1.2 mm with reconstruction slice width of 1.5 mm and collimation of 64 × 0.6 mm with reconstruction slice width of 1.0 mm. These scans were obtained through the phantom without and with a 4-cm-thick oil gel (Superflab, Radiation Product Design) surrounding the phantom to simulate a large patient (Fig. 2). The acquisition time of the CT scan to cover a 13-cm-long kidney phantom including stones in containers was approximately 6 seconds.
Automatic exposure control (CaseDose4D, GE Healthcare) was used with quality reference mAs values of 100 mAs for 140 kVp, 275 mAs for 100 kVp, and 425 mAs for 80 kVp. These values were chosen to approximate the noise levels of the three different voltage settings. The image reconstruction kernel was D30, and the reconstruction field of view was 24 cm. Thus, eight scans (two different kVp pairs × two different collimation-slice thickness combinations × without and with a thick oil gel surrounding the phantom) were obtained for a single iodine concentration solution in the container. These scans were then repeated each time after refilling all the containers with a different iodine concentration solution in a consecutive fashion (43, 64, 85, and 107 mg/dL). Therefore, a total of 40 data sets were obtained.
Iodine-Subtraction Virtual Unenhanced Image Reconstruction
Iodine-subtraction virtual unenhanced images were reconstructed for each of the 40 scans obtained on an independent workstation (Syngo MultiModality Workplace, Siemens Medical Solutions) using commercially available software (Syngo, Dual Energy Viewer, Siemens Medical Solutions). Reconstruction took less than 1 minute per series. For reconstruction of the 80-140 kVp dual-energy scan sets, which was the vendor's recommended dual-energy pair, the default dual-energy ratio (2.00) was used. For reconstruction of the 100-140 kVp dual-energy scan sets, the DICOM data tag of the 100-kVp scan had to be modified to 80 kVp because the software accepted only the 80-140 kVp pair. The dual-energy ratio also had to be adjusted for optimal iodine subtraction, and the data from the calibration scan were used.
Image Interpretation
Forty iodine-subtraction virtual unenhanced image sets, each with the 20 stones, were reviewed by three abdominal radiologists in consensus who were blinded to the scanning parameters, the concentration of the iodine solution, and the composition of the stones. Images were reviewed on a workstation (Advantage Window 4.2, GE Healthcare) using a multiplanar reconstruction. The default display window width and level settings were 1,000 and 200 H, respectively, but the reviewers were allowed to change the window settings as necessary. Radiologists evaluated for visibility of the stones (n = 20 stones × 8 sets of scanning parameters × 5 sets of iodine concentrations = 800 observations). When evaluating each data set to determine stone visibility, readers placed the virtual unenhanced image on one screen and the true unenhanced image on an adjacent screen to ensure that detected high attenuation was, indeed, the real stone. Each image set (n = 40) was also evaluated for the presence of nonsubtracted iodine within the containers (1, no residual iodine; 2, mild; 3, moderate; 4, severe).
Statistical Analysis
Stone visibility rates were compared between scans obtained with 80-140 and 100-140 kVp pairs and with different iodine concentration solutions used to fill the containers across other different scanning parameters (two different collimation-slice thickness combinations × without and with a thick oil gel surrounding the phantom) and 20 different stones. The mean scores of nonsubtracted iodine within the containers were calculated for the 80-140 and 100-140 kVp pairs and with different iodine concentrations across other different scanning parameters (two different collimation-slice thickness combinations × without and with a thick oil gel surrounding the phantom). This was performed to identify outliers. After excluding outliers, scanning parameters (i.e., 80-140 or 100-140 kVp pair, collimation of 0.6 or 1.2 mm, with or without a 4-cm-thick oil gel around the phantom), the iodine concentration of the solutions, and the stone size (short-axis diameter) and composition (uric acid, calcium hydroxyapatite, or calcium oxalate) were also analyzed to determine whether they affected the stone visibility rate. Univariate and multivariate logistic regression analyses were performed using generalized estimating equations to account for the correlated data. A p value of less than 0.05 was considered statistically significant.
Results
Calibration Scans
The CT attenuation values of the five different iodine solutions were 510 H for 21 mg/dL, 970 H for 43 mg/dL, 1,410 H for 64 mg/dL, 1,860 H for 85 mg/dL, and 2,310 H for 107 mg/dL measured using the single-energy 120-kVp CT scan. Dual-energy ratios (ratios of the slope [A (80 kVp) / A (140 kVp)] and [A (100 kVp) / A (140 kVp)] were 2.19 and 1.54, respectively. CT attenuation values of the 85 and 107 mg/dL iodine solutions were more than 3,050 H measured using 80-kVp CT, and these values were discarded for calculation of the dual-energy ratio.
Phantom Study
The size of the stones measured on the reference scan (i.e., single-energy 120-kVp scan) ranged from 1.5 to 4.2 mm (mean, 2.8 mm) in short-axis diameter and from 2.6 to 6.4 mm (mean, 4.4 mm) in long-axis diameter. The mean short-axis diameter for uric acid stones, calcium hydroxyapatite stones, and calcium oxalate stones were 2.7, 2.8, and 3.0 mm, respectively. CT attenuation of the stones measured on the reference scan at 120 kVp ranged from 242 to 863 H (mean, 590 H) for uric acid stones, from 732 to 2,422 H (mean, 1,541 H) for calcium hydroxyapatite stones, and from 784 to 1,529 H (mean, 1,185 H) for calcium oxalate stones.
Stone visibility rates and the mean nonsubtracted iodine score with regard to the different kVp pairs and iodine concentration solutions are summarized in Tables 1 and 2 (Fig. 3). The poor visibility rate with the combination of 80-140 kVp and 107 mg/dL iodine concentration was due to failure of iodine subtraction (high nonsubtracted iodine). Consequently, CT scans obtained with the 80-140 kVp pair and the highest iodine concentration (107 mg/dL) were excluded as an outlier in univariate and multivariate analyses of scanning parameters, iodine concentrations of solutions, and stone size and composition if they affected the stone visibility rate. Using univariate logistic regression analysis, we found that larger stone size (p < 0.0001) and a narrower collimation of 0.6 mm (p = 0.02) were associated with a higher stone visibility rate. Stone compositions, the presence or absence of a 4-cm-thick oil gel around the phantom, kVp setting, and urine density did not influence the stone visibility rate (p > 0.05). Using multivariate analysis, larger stone size (p = 0.0005), narrow collimation of 0.6 mm (p = 0.001), and the absence of a 4-cm-thick oil gel around the phantom (p = 0.03) were associated with a higher stone visibility rate. Stone compositions, kVp, and urine density did not influence the stone visibility rate (p > 0.05). All stones that were 3 mm or larger in short-axis diameter were visible, and 92% of the stones that were smaller than 3 mm in short-axis diameter were visible.
TABLE 1.
Stone Visibility with Different Iodine Concentrations and Peak Kilovoltage Pairs
| kVp Pair | Iodine Concentration |
||||
|---|---|---|---|---|---|
| 21 mg/dL | 43 mg/dL | 65 mg/dL | 85 mg/dL | 107 mg/dL | |
| 80-140 (n = 80) | 79 (99) | 74 (93) | 77 (96) | 75 (94) | 2 (3) |
| 100-140 (n = 80) | 78 (98) | 76 (95) | 79 (99) | 75 (94) | 79 (99) |
Note—Data are number of visible stones and visibility rate (%) in parentheses across four CT scans with two different collimations and with or without oil gel around the phantom of 20 stones.
TABLE 2.
Residual Nonsubtracted Iodine Score with Different Iodine Concentrations and Peak Kilovoltage Pairs
| kVp Pair | Iodine Concentration |
||||
|---|---|---|---|---|---|
| 21 mg/dL | 43 mg/dL | 65 mg/dL | 85 mg/dL | 107 mg/dL | |
| 80-140 (n = 80) | 1.0 | 1.8 | 1.8 | 2.5 | 4.0 |
| 100-140 (n = 80) | 1.0 | 1.5 | 2.0 | 2.8 | 2.5 |
Note—Data are mean score of residual nonsubtracted iodine (1 = lowest, 4 = highest) across four CT scans with two different collimations and with or without oil gel around the phantom.
Fig. 3.

CT scans of phantom with multiplanar reconstruction parallel to long axis of cone-shaped plastic container in right lower quadrant of phantom containing calcium hydroxyapatite stone (arrows) that is 3.8 mm in short-axis diameter. Constant scanning parameters were 64 × 0.6 mm collimation with 1-mm reconstruction slice thickness and without 4-cm-thick oil gel surrounding phantom. Stone in plastic container in right lower quadrant (arrows) is detectable on all scans except scan obtained with 80-140 kVp pair and 107 mg/dL iodine solution combination (D). Note severe degree of residual nonsubtracted iodine with this combination obscures stone. Scan with 100-140 kVp pair and 107 mg/dL iodine solution combination (E) shows mild degree of residual nonsubtracted iodine, but stone is visible. Note stone appears smaller on dual-energy CT scans with virtual unenhanced iodine subtraction (B, C, and E) than on true unenhanced scan (A). Due to slight difference in orientation of phantom between scans, other stones and plastic containers are variably seen.
A, Single-energy CT scan (120 kVp) with plastic container filled with saline (true unenhanced scan).
B-D, Dual-energy CT scans (80-140 kVp pair) with plastic container filled with 21 (B), 64 (C), and 107 (D) mg/dL iodine solution, respectively, with virtual unenhanced iodine subtraction.
E, Dual-energy CT scan (100-140 kVp pair) with plastic container filled with 107 mg/dL iodine solution with virtual unenhanced iodine subtraction.
Discussion
In this phantom study, iodine-subtraction virtual unenhanced images allowed the detection of most urinary stones except with the combination of the highest iodine concentration of 107 mg/dL and the 80-140 kVp pair. There was a severe degree of nonsubtracted iodine with that combination. The nonsubtracted iodine was probably due to the breakdown of the iodine-subtraction virtual unenhanced algorithm. The maximal CT attenuation measurable with the current CT scanner was 3,070 H. Theoretic CT attenuation of the iodine solution with concentrations of 85 and 107 mg/dL were 3,390 and 4,230 H, respectively, with 80 kVp, whereas those with 100 kVp were 2,440 and 3,030 H, respectively. Because of the maximal measurable CT attenuation, the CT attenuation values saturated at 3,070 H when they were, in reality, greater than 3,070 H. Thus, the calculated dual-energy ratio of the high-concentration iodine solution became artificially lowered with the 80-140 kVp pair, and the iodine-subtraction algorithm did not recognize the high-concentration iodine as iodine. With an iodine concentration of 85 mg/dL or lower, the visibility rate of the stones was similar between the 80-140 and 100-140 kVp pairs.
A small collimation was associated with a higher stone visibility rate probably because less partial volume artifact along the z-axis enabled more accurate measurement of CT attenuation of the stones and iodine, thus successfully separating them. The absence of a 4-cm-thick oil gel around the phantom was associated with a higher stone visibility rate with multivariate analysis but not with univariate analysis.
An advantage of the 80-140 kVp pair over the 100-140 kVp pair is a wider separation of the dual-energy ratio between iodine and urinary stones or other soft tissue. Disadvantages of the 80-140 kVp are saturation of CT attenuation at a high iodine concentration and higher image noise with the 80-kVp scan given the same exposure because of the effect of photon depletion. Scans of large patients or scans through the pelvis may potentially benefit from the 100-140 kVp pair; but our study failed to show an advantage of the 100-140 kVp pair except at the highest iodine concentration.
Virtual unenhanced images detected 92% of the stones that were less than 3 mm and 100% of the stones that were 3 mm or larger in short-axis diameter in this phantom study when the scans obtained with the combination of an iodine concentration of 107 mg/dL and the 80-140 kVp pair were excluded. Some of the small stones were not visible, probably because small stones were oversubtracted as iodine or there was residual undersubtracted iodine surrounding the small stones with the virtual unenhanced iodine-subtraction technique. Is this visibility rate for small stones acceptable in a clinical setting? Although most ureteral stones less than 3 mm pass spontaneously [13], detection of such stones is often clinically important. Small intrarenal stones seldom cause symptoms, but they can be the cause of microscopic hematuria. The technique needs further investigation and refinement.
The stone visibility rate was not affected by stone composition in this phantom study. The dual-energy ratio of stones at imaging with the 80-140 kVp pair was 1.12 for uric acid stones, 1.60 for calcium oxalate stones, and 1.69 for calcium hydroxyapatite stones from a previous study [14], whereas that of iodine solution was 2.19. Theoretically, the larger the separation of the dual-energy ratio of a stone and iodine, the easier it is to separate a stone from iodine.
When implementing this technique in a clinical study, one must be aware that oversaturation of the CT attenuation with high-concentration iodine may cause breakdown of the iodine-subtraction algorithm. Attention must be paid to avoid oversaturation of the CT attenuation of more than 3,000 H while still providing adequate opacification and distention of the collecting system to allow detection of tumors as filling defects. The CT attenuation of iodine solution reaches 3,000 H at 80 kVp with an iodine concentration of 75.3 mg/dL, which corresponds to approximately 1,650 H at 120 kVp. Options to decrease the concentration of iodine in the urinary tract may include the use of the split contrast material injection technique, with a smaller dose of contrast material administered for the first of two injections [10, 15], and the use of vigorous hydration or diuretics [16, 17]. The other option is to use the 100-140 kVp pair instead of the 80-140 kVp pair.
Dual-energy CT performed after the administration of iodinated contrast material has the potential to characterize enhancement of a renal mass using virtual unenhanced technique (Graser A et al. and Carter CL et al., presented at the 2007 annual meeting of the Radiological Society of North America). Therefore, virtual unenhanced images reconstructed from pyelographic phase CT urograms have the potential to detect urinary stones and to characterize a renal mass without obtaining a true unenhanced CT scan. If unenhanced CT could be eliminated from CT urography, the radiation dose to the patient could be reduced. The radiation dose of a dual-energy scan at 80-140 kVp is comparable to that of a single-energy scan at 120 kVp to achieve similar image quality or noise level [5].
Some physical limitations of the scanner that we used need to be taken into account. Currently, the second tube and detector have a maximum field of view of 26 cm in the gantry plane. The primary tube and detector have a full 40-cm field of view. Because of this configuration, the dual-energy iodine-subtraction virtual unenhanced images have a maximum field of view of 26 cm. The scanning area needs to be carefully positioned to ensure full coverage of the kidneys, ureters, and bladder using anteroposterior and lateral topograms.
In conclusion, dual-energy CT iodine-subtraction virtual unenhanced images are capable of depicting urinary stones in iodine solution. The dual-energy CT iodine-subtraction technique requires further optimization and validation with a clinical study.
Acknowledgments
A. N. Primak, O. P. Dzyubak, J. G. Fletcher, and C. H. McCollough receive partial research funding from a grant from Siemens Medical Solutions, whose equipment and software were used in the study.
References
- 1.Millner MR, McDavid WD, Waggener RG, Dennis MJ, Payne WH, Sank VJ. Extraction of information from CT scans at different energies. Med Phys. 1979;6:70–71. doi: 10.1118/1.594555. [DOI] [PubMed] [Google Scholar]
- 2.Chiro GD, Brooks RA, Kessler RM, et al. Tissue signatures with dual-energy computed tomography. Radiology. 1979;131:521–523. doi: 10.1148/131.2.521. [DOI] [PubMed] [Google Scholar]
- 3.Kalender WA, Klotz E, Suess C. Vertebral bone mineral analysis: an integrated approach with CT. Radiology. 1987;164:419–423. doi: 10.1148/radiology.164.2.3602380. [DOI] [PubMed] [Google Scholar]
- 4.Johnson TR, Nikolaou K, Wintersperger BJ, et al. Dual-source CT cardiac imaging: initial experience. Eur Radiol. 2006;16:1409–1415. doi: 10.1007/s00330-006-0298-y. [DOI] [PubMed] [Google Scholar]
- 5.Johnson TR, Krauss B, Sedlmair M, et al. Material differentiation by dual energy CT: initial experience. Eur Radiol. 2007;17:1510–1517. doi: 10.1007/s00330-006-0517-6. [DOI] [PubMed] [Google Scholar]
- 6.Scheffel H, Alkadhi H, Plass A, et al. Accuracy of dual-source CT coronary angiography: first experience in a high pre-test probability population without heart rate control. Eur Radiol. 2006;16:2739–2747. doi: 10.1007/s00330-006-0474-0. [DOI] [PMC free article] [PubMed] [Google Scholar]
- 7.Flohr TG, McCollough CH, Bruder H, et al. First performance evaluation of a dual-source CT (DSCT) system. Eur Radiol. 2006;16:256–268. doi: 10.1007/s00330-005-2919-2. [DOI] [PubMed] [Google Scholar]
- 8.Achenbach S, Ropers D, Kuettner A, et al. Contrast-enhanced coronary artery visualization by dual-source computed tomography—initial experience. Eur J Radiol. 2006;57:331–335. doi: 10.1016/j.ejrad.2005.12.017. [DOI] [PubMed] [Google Scholar]
- 9.McNicholas MM, Raptopoulos VD, Schwartz RK, et al. Excretory phase CT urography for opacification of the urinary collecting system. AJR. 1998;170:1261–1267. doi: 10.2214/ajr.170.5.9574598. [DOI] [PubMed] [Google Scholar]
- 10.Chow LC, Sommer FG. Multidetector CT urography with abdominal compression and three-dimensional reconstruction. AJR. 2001;177:849–855. doi: 10.2214/ajr.177.4.1770849. [DOI] [PubMed] [Google Scholar]
- 11.Kawashima A, Glockner JF, King BF., Jr CT urography and MR urography. Radiol Clin North Am. 2003;41:945–961. doi: 10.1016/s0033-8389(03)00073-3. [DOI] [PubMed] [Google Scholar]
- 12.Nolte-Ernsting C, Cowan N. Understanding multislice CT urography techniques: many roads lead to Rome. Eur Radiol. 2006;16:2670–2686. doi: 10.1007/s00330-006-0386-z. [DOI] [PubMed] [Google Scholar]
- 13.Takahashi N, Kawashima A, Ernst RD, et al. Ureterolithiasis: can clinical outcome be predicted with unenhanced helical CT? Radiology. 1998;208:97–102. doi: 10.1148/radiology.208.1.9646798. [DOI] [PubMed] [Google Scholar]
- 14.Bellin MF, Renard-Penna R, Conort P, et al. Helical CT evaluation of the chemical composition of urinary tract calculi with a discriminant analysis of CT-attenuation values and density. Eur Radiol. 2004;14:2134–2140. doi: 10.1007/s00330-004-2365-6. [DOI] [PubMed] [Google Scholar]
- 15.Chai RY, Jhaveri K, Saini S, Hahn PF, Nichols S, Mueller PR. Comprehensive evaluation of patients with haematuria on multi-slice computed tomography scanner: protocol design and preliminary observations. Australas Radiol. 2001;45:536–538. doi: 10.1046/j.1440-1673.2001.00978.x. [DOI] [PubMed] [Google Scholar]
- 16.Nolte-Ernsting CC, Wildberger JE, Borchers H, Schmitz-Rode T, Günther RW. Multi-slice CT urography after diuretic injection: initial results. Rofo. 2001;173:176–180. doi: 10.1055/s-2001-11847. [DOI] [PubMed] [Google Scholar]
- 17.Silverman SG, Akbar SA, Mortele KJ, Tuncali K, Bhagwat JG, Seifter JL. Multi-detector row CT urography of normal urinary collecting system: furosemide versus saline as adjunct to contrast medium. Radiology. 2006;240:749–755. doi: 10.1148/radiol.2403050233. [DOI] [PubMed] [Google Scholar]