

Abstract
An ideal preparation for investigating events during synaptogenesis would be one in which synapses are sparse, but can be induced at will using a rapid, exogenous trigger. We describe a culture system of immunopurified subplate neurons in which synaptogenesis can be triggered, providing the first homogeneous culture of neocortical neurons for the investigation of synapse development. Synapses in immunopurified rat subplate neurons are sparse, and can be induced by a 48-h exposure to feeder layers of neurons and glia, an induction more rapid than any previously reported. Induced synapses are electrophysiologically functional and ultrastructurally normal. Microarray and real-time PCR experiments reveal a new program of gene expression accompanying synaptogenesis. Surprisingly few known synaptic genes are upregulated during the first 24 h of synaptogenesis; Gene Ontology annotation reveals a preferential upregulation of synaptic genes only at a later time. In situ hybridization confirms that some of the genes regulated in cultures are also expressed in the developing cortex. This culture system provides both a means of studying synapse formation in a homogeneous population of cortical neurons, and better synchronization of synaptogenesis, permitting the investigation of neuron-wide events following the triggering of synapse formation.
Keywords: culture, immunopurification, microarray, neocortex, synapse
Introduction
The precise connectivity of the cerebral cortex is of great interest to many developmental neurobiologists, yet very little is known about how layer- and cell type–specific synaptogenesis occurs in the developing cortex. Due to the fact that synaptogenesis in vivo occurs over a protracted period, beginning at embryonic day 15 (E15) in the rodent temporal neocortex (Konig et al. 1975) and continuing into the postnatal period (Welker and Woolsey 1974; Micheva and Beaulieu 1996), culture preparations are a useful entry for examining cellular events and mechanisms of synapse formation. Although in vitro studies allow a more controlled investigation of synaptogenesis, much of our understanding derives from studies of either noncortical neuronal cultures, or cortical cultures containing an undefined mixture of neurons and nonneuronal cells from several cortical layers. Mixed cultures limit what can be learned about how particular neuronal types form synapses; there is thus a need for a method allowing the study of synapses in purified populations of cortical neurons.
The subplate, a layer of neurons underlying layer VI of the developing mammalian cortical plate (Marin-Padilla 1978; Luskin and Shatz 1985), is an attractive cell type for in vitro analysis of cortical neuron synaptogenesis. In the developing neocortex, subplate neurons are among the first to be generated, becoming postmitotic around E12 in rat (Konig and Marty 1981), and participating in early circuits establishing thalamocortical architecture and function (Ghosh et al. 1990; Ghosh and Shatz 1992, 1993; Lein et al. 1999; Kanold et al. 2003; Dupont et al. 2006; Price et al. 2006). They form some of the first synapses in cortex (Molliver et al. 1973; Konig et al. 1975; Kostovic and Rakic 1980; Konig and Marty 1981; Blue and Parnavelas 1983a, 1983b; Chun and Shatz 1988), with synaptic partners that include afferents from the thalamus and cholinergic basal forebrain, cortical plate neurons, and importantly, other subplate neurons (Wahle and Meyer 1987; Friauf et al. 1990; Callaway and Katz 1992; Herrmann et al. 1994; Hanganu et al. 2002; Hanganu and Luhmann 2004; Hirsch and Luhmann 2008). At P0-P3 in the rat, a higher proportion of subplate neurons (79%) have been found to receive monosynaptic excitatory input from other subplate neurons than from thalamocortical afferents (68%) or cortical plate inputs (72%) (Hanganu et al. 2002), showing that subplate neurons likely receive synapses from several partners but that intrasubplate synapses represent an important source of input. Intrasubplate inputs in mouse cortical slices at these times have more mature functional properties than synaptic inputs from the thalamus (Hirsch and Luhmann 2008).
The proportion of synapses with these different partners is altered over the course of development, but at earlier, prenatal stages, may be dominated by subplate–subplate synapses to an even greater extent. Electron microscopy reveals that the first synapses begin to appear in the subplate as early as E15 in the rat temporal cortex (Konig et al. 1975), yet functional inputs from thalamocortical projections to the subplate cannot be detected until E19, as seen by optical recording (Higashi et al. 2002). Inputs from the cholinergic basal forebrain only arrive around birth (Hohmann and Berger-Sweeney 1998). Likewise, projections from the subplate only innervate the cortical plate gradually over development; axon terminals remain largely within the subplate layer at early embryonic times (Friauf et al. 1990; Friauf and Shatz 1991). Thus subplate–subplate synapses may predominate at early stages. In contrast, the most commonly used immunopurified neurons for the study of synaptogenesis, retinal ganglion cells (RGCs), do not regularly form synapses with each other in vivo (Dacey 1985). Subplate neurons thus represent an attractive system for studying mechanisms of synapse formation and maturation in a defined cortical population that normally can form synapses within the same cell layer.
The subplate is the only cortical neuronal cell type that has been cultured at high purity to date. Subplate neurons can be purified by immunopanning with an antibody to p75-NTR, a neurotrophin receptor that promotes survival of the cultures in the presence of exogenous neurotrophins, although the cultures can also be maintained without added neurotrophins (DeFreitas et al. 2001). Immunopanning yields cultures composed almost entirely of subplate neurons, as determined by p75-NTR staining and BrdU birthdating (DeFreitas et al. 2001).
Although the first steps of synaptogenesis are known to occur very rapidly following new contact between growing neurites, with presynthesized proteins being clustered within minutes (McAllister 2007), existing culture systems have shown that a bulk increase in synapses is only detectable gradually over many days. In mixed cortical cultures, synapses appear in a highly asynchronous fashion (Romijn et al. 1981) as they do in the brain, and cannot be triggered at will. In the noncortical culture preparations where methods have been found for triggering synaptogenesis, responses are also delayed. For example, synaptogenesis triggered by glia in immunopurified RGCs or spinal motor neurons is only detectable after a 6-day exposure (Ullian et al. 2001, 2004). The clustering of pre- and postsynaptic specializations in mixed cortical neurons by aggregated ephrinB takes place over 3 days (Dalva et al. 2000). These delays may be caused by an absence of normal synaptic targets or a lack of necessary factors in the cultures. This discrepancy between the timescales for fast initial clustering of synaptic proteins (at individual sites of contact) and the long delay before there is a quantifiable increase in synapses might be resolvable in a system where synaptogenesis is more synchronized.
To date, it has been difficult to study longer-term events of synaptic development with temporal precision in anything other than single neurons. An example of a longer-term process in synaptic maturation is the development of specialized presynaptic active zones in cultured Xenopus motor neurons, which are only detectable by electron microscopy a day after a neuron contacts its target (Takahashi et al. 1987; Buchanan et al. 1989), although postsynaptic potentials can be observed in less than a minute (Kidokoro and Yeh 1982; Chow and Poo 1985; Xie and Poo 1986). Other, neuron-wide changes during synapse development may include cellular regulation of how many synapses can form on one cell, how dense those synapses can become for a given area of neurite, how synapses are stabilized or eliminated, and how new synapses attain mature functionality. These are all questions that would benefit from more synchronized synaptogenesis, as gene and protein expression could be investigated across the cultures, to discover regulatory events controlling these processes.
We report here a culture system of immunopurified subplate neurons in which synaptogenesis can be triggered. We find that purified subplate neurons form very few synapses in a basal culture medium, and then can be stimulated to do so by culturing in a medium exposed to other cell types. The time course of synaptogenesis triggered in this way is rapid, with morphological and functional synapses induced within 48 h. We demonstrate that it is feasible to use this system to study gene expression during synapse development, and find that synaptogenesis is accompanied by a new program of gene expression. This system addresses both the need for a purified cortical population for the in vitro study of synapse development, and the outstanding need for more synchronized, triggerable synaptogenesis in neurons that are normally capable of forming synapses with one another in the brain.
Materials and Methods
Animals
Animal procedures were performed in accordance with protocols approved by the Harvard University Animal Research Committee. The day following mating was considered embryonic day 0 (E0), and the day of birth postnatal day 0 (P0). Cultures were made from Long Evans rats (Charles River Laboratories, Wilmington, MA), or where specified, from transgenic Sprague Dawley rats carrying enhanced green fluorescent protein (EGFP) under the control of the cytomegalovirus enhancer and the chicken β-actin promoter (EGFP rats) (Ito et al. 2001), a gift of Dr Jeffery Kocsis (Yale University). In situ hybridization was carried out on brain sections from C57BL/6 mice (Charles River Laboratories).
Immunopurification and Cell Culture
Subplate neuron purification was carried out as described previously (DeFreitas et al. 2001), with certain modifications. Dissociated cells from the posterior neocortex (primarily visual cortex) from E17 pups were immunopanned on a petri dish coated with goat anti-mouse (Jackson Immunoresearch, West Grove, PA) then 1.13 μg/cm2 of monoclonal mouse anti-rat p75 NTR, clone 192.1, a gift of Dr Eric Shooter (Stanford University). Nonadherent cells were washed off and plated as cortical feeder layers (described below). Cells adhering to the antibody (subplate neurons) were trypsinized off the panning plate, washed, and plated on poly-ornithine (Sigma, St Louis, MO) and fibronectin (BD Biosciences, Bedford, MA)-coated 12-mm glass coverslips (Fisher Scientific, Pittsburgh, PA) in 24-well plates, at 22,100 cells per well. Cultures were grown in serum-free conditions, in “basal medium,” Neurobasal with B27 supplement (Invitrogen, Carlsbad, CA) plus 50μg/ml chondroitin sulfate A (Sigma). Hippocampal cultures were made from E17 rats in the same manner, without immunopanning after the enzymatic digestion. Glia were obtained by trypsinizing P0 cortices and plating in 0.6% glucose, 10% fetal calf serum in Minimum Essential Medium with Earle's salts, L-glutamine and penicillin–streptomycin (Invitrogen), and grown for several weeks to allow glia to divide and outcompete neurons. Astrocytes become the primary cell type in these culture conditions (Noble and Mayer-Proschel 1998). Glia were then trypsinized, washed, and plated in basal medium.
Feeder Layer Exposure
Feeder layers of cortical cells were grown in basal medium at 650,000 cells per well, on 24-well plates coated with poly-ornithine and fibronectin, with paraffin wax dots as spacers to prevent direct contact between the feeder layer and a coverslip of subplate neurons above, similar to a Banker-style culture (Goslin et al. 1998). Control feeder wells contained no cells. Wells were fed with fresh media at 4 days in vitro (d.i.v.). Twenty-four hours later, coverslips of subplate neurons were added to feeder wells and exposed for varying durations. Feeder layers of hippocampal cells or glia were employed in the same manner. Conditioned medium consisted of basal medium exposed to feeder layers for 24 h, then spun and used directly on subplate cultures.
Immunocytochemistry
For synaptic staining, cultures were fixed in 4% paraformaldehyde/2% sucrose in 0.1 M sodium phosphate buffer for 8 min at room temperature and washed in phosphate-buffered saline (PBS). Fixed cells were blocked in 10% donkey serum in PBS, and stained in 4 channels, for synapsin (rabbit anti-synapsin I, Chemicon, Temecula, CA, followed by a Cy2-donkey anti-rabbit secondary antibody, Jackson); PSD-95 (mouse anti-PSD-95, Affinity Bioreagents, Golden, CO, followed by a Cy3-donkey anti-mouse, Jackson); actin (Alexa 647 phalloidin, Molecular Probes, Eugene, OR); and Hoechst 33342 nuclear staining (Sigma) in block. The Hoechst channel was used to count pyknotic nuclei to determine the percent survival in each coverslip; neurons were counted as alive if they had smooth, rounded nuclei, and as dead if they had shrunken, pyknotic nuclei. Antibodies used in other experiments were rabbit anti-Tau (Sigma), mouse anti-vimentin (Chemicon), rabbit anti-glutamate (Chemicon), mouse anti-GAD65 (Chemicon), mouse anti-GAD67 (a gift of Dr Daniel Kaufman, UCLA), rabbit anti-GluR1 (Chemicon), and goat anti-GFP (Abcam, Cambridge, UK). Staining was carried out as above, with the exception that for glutamate staining, cells were fixed in 2% paraformaldehyde/2.5% gluteraldehyde/2% sucrose in 0.1 M sodium phosphate buffer, and for Tau and vimentin staining, cells were fixed in 100% methanol at −20°C for 15 min.
Image Acquisition and Quantification
Immunostained coverslips were imaged for synaptogenesis experiments using a 60x objective on a Nikon Eclipse E800 epifluorescence microscope with a Spot camera (Diagnostic Instruments, Sterling Heights, MI). Each image was thresholded, and synapsin- and PSD-95–immunostained puncta were counted if they fell within a predefined size range, using an automated routine in MetaMorph software (Universal Imaging, Downington, PA). Layer masks were used to determine colocalization. Synapse density was quantified as colocalized puncta per square micron, of the neurite area visible in the thresholded phalloidin-stained actin channel. Cell somata were omitted from the analyses. Eight fields were imaged per coverslip, with 3 replicate coverslips per experiment in multiple experiments. Treated conditions were normalized to controls. Statistical analyses were performed using a Student's t-test assuming a 2-tailed distribution and unequal variation.
Cell Type Quantification
The percentage of neuronal versus nonneuronal cells in the cultures was assayed by immunostaining for Tau and vimentin, which were found to label nonoverlapping populations. These were counted in a minimum of 100 cells per preparation, with counts averaged across preparations. The percentage of inhibitory neurons was similarly quantified following staining for the inhibitory markers glutamic acid decarboxylase 65 (GAD-65) and GAD-67 (combined to ensure that all GABAergic cells would be labeled).
Measurements of Cell Morphology
Subplate neurons purified from EGFP heterozygote rats and wild-type littermate controls were mixed such that approximately 1 in 100 neurons was labeled with EGFP, allowing tracing of its processes without interfering label from surrounding cells. Neurons grown from 5 to 7 d.i.v. in control wells or above feeder layers were immunostained for GFP to visualize cell morphology, and counterstained with Hoechst to assess cell health. A montage of each cell was assembled from images taken with a 10× objective. Neuronal morphology was traced for 18 cells/condition and subjected to Sholl analysis (Sholl 1953) in Neurolucida software (MicroBrightField, Williston, VT), which counts the number of branches and intersection points of neurites crossing concentric rings a given distance out from the soma, and also calculates total neurite length/cell.
Electrophysiology
Whole-cell recordings of spontaneous miniature excitatory postsynaptic currents (mEPSCs) were made at room temperature from control or feeder layer–exposed subplate cultures, using borosilicate pipettes of approximately 5 MΩ (VWR, West Chester, PA). The bath solution was a HEPES (4-(2-hydroxyethyl)-1-piperazineethanesulfonic acid)-based ACSF (artificial cerebrospinal fluid) containing (in mM): 10 glucose, 115 NaCl, 2.5 KCl, 10 HEPES, 2 MgCl2, 2 CaCl2. The pipette solution contained (in mM): 95 cesium methanesulfonate, 10 HEPES, 4 MgCl2, 10 EGTA (ethylene glycol tetraacetic acid), 10 phosphocreatine, 4 ATP, 0.4 GTP. For the isolation of AMPAergic events (events mediated by the alpha-amino-3-hydroxy-5-methyl-4-isoxazolepropionic acid receptor) the bath contained 0.5 μM TTX (tetrodotoxin), 20μM bicuculline methiodide, and 50 μM APV ((2R)-amino-5-phosphonovaleric acid) (Sigma). Using an Axopatch 200B amplifier and pClamp software (Molecular Devices, Sunnyvale, CA), mEPSCs were recorded at a holding potential of –70 mV, with low pass filtering at 2 kHz and digital sampling at 20.41 kHz. Recordings were discarded if access resistance exceeded 25 MΩ or leak currents exceeded 50pA. mEPSCs were quantified using template-based event detection in pClamp software, with a noise cutoff of 6pA. Frequency and amplitude were averaged per cell, with approximately 10, but no less than 6, cells recorded per condition. To confirm that mEPSCs were AMPAergic, 10 μM NBQX (Sigma) in ACSF was perfused, then washed out to observe recovery.
Electron Microscopy
Samples were fixed for 30 min in 2.5% gluteraldehyde and 2% paraformaldehyde in 0.1 M sodium cacodylate buffer (pH 7.4), washed in 0.1 M cacodylate buffer, postfixed with a mixture of 1% osmium tetroxide (OsO4) + 1.5% potassium ferrocyanide 1 h, washed in water, stained in 1% aqueous uranyl acetate 30 min, dehydrated in grades of alcohol, and then embedded in TAAB Epon (Marivac Canada, St. Laurent, Canada). Ultrathin sections (approx. 60–80 nm) were cut on a Reichert Ultracut-S microtome (Leica, Wetzlar, Germany), picked up on copper grids, stained with lead citrate, and examined in a Tecnai Spirit BioTwin Transmission electron microscope (FEI Company, Hillsboro, OR). Synapses were quantified by counting clusters of 10 or more vesicles in a radius approximately 5 μm out from each soma.
RNA Isolation and Hybridization to Microarrays
Coverslips of subplate neurons were cultured 5 days, then moved to cortical feeder layers or control wells. Following 24 or 96 h exposure, RNA was isolated from ∼6 coverslips per condition using an RNAqueous Micro kit (Ambion, Austin, TX). Five independent experiments were used as biological replicates in each of the 4 conditions: 24 h control, 24 h feeder layer-treated, 96 h control, and 96 h feeder layer-treated, for a total of 20 arrays. RNA (100 ng per condition) was amplified through 2 cycles of cDNA synthesis and in vitro transcription to give biotin-labeled cRNA, according to the Affymetrix “GeneChip Expression Analysis Technical Manual” protocol (www.affymetrix.com). RNA quality was assessed on an Agilent Bioanalyzer (Agilent Technologies, Santa Clara, CA) before and after amplification and fragmentation. Hybridization, washing and scanning of Rat Genome 230 2.0 GeneChip Arrays (Affymetrix, Santa Clara, CA) were performed at the Harvard Medical School Biopolymers Facility, according to Affymetrix protocols (www.affymetrix.com). The rat genome array contains 31,099 probe sets, with 11 perfect match and 11 1-base mismatch oligonucleotide probes per probe set, representing over 30,000 transcripts.
Microarray Data Analysis
Images of probe hybridization intensity on the scanned chips were quantified and scaled by Affymetrix Microarray Suite 5.0 software, using default settings. Statistical methods are described in detail in the Affymetrix document: http://www.affymetrix.com/support/technical/whitepapers/sadd_whitepaper.pdf. The software uses normalized intensities from the 11 probe pairs per sequence to report a detection confidence score (Present, Absent or Marginal) and a signal intensity value representing expression level. Data were then analyzed in GeneSpring software (Agilent Technologies), normalizing with an RMA (Robust Multi-array Analysis) file preprocessor and then dividing each gene by the median of its measurements in all samples. The data have been deposited in the Gene Expression Omnibus (www.ncbi.nlm.nih.gov/geo) of the National Center for Biotechnology Information (NCBI) (Edgar et al. 2002; Barrett et al. 2007), accession number GSE8318. The mean expression of a gene was calculated as the geometric mean of normalized expression signals on 5 replicate arrays. The regulation of an individual gene is reported here as an expression ratio of the mean normalized expression on microarrays from feeder layer-treated versus control subplate neurons. Where fold change is reported, it is defined as follows:
Candidate genes with significantly altered expression between conditions were found through ANOVAs (with multiple testing correction by Benjamini and Hochberg False Discovery Rate) (Benjamini and Hochberg 1995) on genes that were called as Present in at least 10 of 20 arrays, and that showed a minimum of 1.6-fold regulation.
Gene Ontology Analysis
The distribution of genes among Gene Ontology (GO) (Ashburner et al. 2000) annotation categories was examined using GeneSpring software, which compares the proportion of regulated genes in a category to the proportion of all genes in that category, to infer whether a particular category is preferentially activated by feeder layer treatment. Benjamini and Hochberg multiple testing correction was applied. (Note that not all genes on the arrays have GO annotations, and annotations may be subject to error.) To create a more detailed set of categories relevant to synapse function, we compiled and annotated a master list of putative synaptic genes, using the GO Biological Process categories of “synaptogenesis,” “synaptic transmission,” and “synapse organization and biogenesis” plus information from the proteomics literature (see Results). Annotation information was derived from published information, or in some cases, from homology to known synaptic proteins, or presence in a particular subcellular fraction such as synaptosomes; we thus refer to this list as “putative synaptic genes.” (Although there are examples of proteins in synaptic proteome papers that are unlikely to be directly synaptic, such as mitochondrial enzymes, Peng et al. 2004; Morciano et al. 2005; Cheng et al. 2006, these cases were not excluded here, to maintain impartiality.) The master synaptic list was analyzed to determine whether a higher fraction of probes from any of the 14 synaptic categories (omitting “other”) was regulated than would be expected by chance, based on the proportion found in the list of all expressed synaptic genes, using counts based on Entrez Gene identifiers. A category is considered overrepresented if P < 0.05, where P = 1 - (hypergeometric cumulative distribution probability), using Matlab statistical software (MathWorks, Natick, MA) and a Benjamini and Hochberg correction for multiple testing. If an Entrez Gene identifier referred to probe sets on both the up- and downregulated lists (possibly due to different splice variant transcripts), that identifier was omitted from the analysis.
Real-Time Quantitative PCR
RNA was isolated from rat subplate cultures as in 24-h microarray experiments, then reverse-transcribed using a RETROscript kit (Ambion) primed with both Oligo(dT) and random decamers. Amplification and detection were carried out on a Smart Cycler system (Cepheid, Sunnyvale, CA), using iQ SYBR Green Supermix (Bio-Rad, Hercules, CA) to detect PCR product quantity in real time. The cycle threshold (CT), the first cycle in which fluorescence rises significantly above background, was used to detect relative expression with respect to beta actin as a normalizing gene by the standard method:
 |
The expression ratio thus gives the expression of a gene in subplate neurons exposed to the feeder layer for 24 h with respect to control, normalized to actin. Actin was chosen because it was not significantly regulated in 24-h microarray experiments. A melt curve verified that each reaction gave a single product. Oligonucleotide primer sequences are given in Supplemental Table 1.
In Situ Hybridization
In situ hybridization was performed for the localization of candidate mRNAs in sections of mouse brain rather than rat, to facilitate the transition to future in vivo studies using knockout mice. The stages of synapse development are expected to be similar to rat. In situ hybridization was carried out as described (Lein and Shatz 2000). An [α-35S]UTP-labeled riboprobe (1250 Ci/mmol, New England Nuclear, Boston, MA) was hybridized to 12-μm sagittal cryostat sections, which were dipped in NTB-2 emulsion (Eastman Kodak, Rochester, NY) and developed after 1–5 weeks. Silver grains were imaged using dark-field optics and a Spot camera. Probes were created by PCR amplification from perinatal rat or mouse visual cortex cDNA, using primers chosen to amplify regions of coding sequence with high homology between rat and mouse, and low homology with other genes. Primer sequences are given in Supplemental Table 1. T7 and SP6 sites were added to primers for in vitro transcription of probes. Probes were verified by restriction digests.
Results
Immunopanned Subplate Cultures are Highly Enriched for Glutamatergic Neurons
Dissociated cells from the visual cortex can be “panned” on a dish coated with p75 NTR antibody to immunopurify a population of subplate neurons (DeFreitas et al. 2001). In prenatal rat neocortex (peaking at embryonic day 17, E17), the p75 NTR neurotrophin receptor is expressed across the subplate layer but not in other layers (Allendoerfer et al. 1990; Meinecke and Rakic 1993; DeFreitas et al. 2001); see Supplemental Figure 2 (available at http://cercor.oxfordjournals.org as supplemental material). Here, we investigate the composition of immunopanned subplate cultures further and find that very few glial cells are present: cultures stained for Tau to label neurons and vimentin to label nonneuronal cells contained approximately 99% neurons (98.9% ± 0.43 SEM Tau-positive cells; 1.1% ± 0.43 SEM vimentin-positive cells; N = 693 cells counted in 5 independent cultures) (Fig. 1A). The neurons in the purified population are virtually all immunopositive for glutamate (Fig. 1B), so are most likely a subpopulation of the subplate, as subplate neurons in vivo show a range of transmitter phenotypes, including glutamate, GABA (gamma-aminobutyric acid), and neuropeptides (Allendoerfer and Shatz 1994). To reveal how many GABAergic neurons might be present, cultures were immunostained for GAD-65 + GAD-67. Less than 1% of cells were immunopositive for GAD-65 + GAD-67 (0.95% ± 0.25 SEM, of 963 cells counted in 4 preps) (Fig. 1C). Subplate immunopurification therefore produces extremely pure cultures of glutamatergic neurons.
Figure 1.

Subplate neuron cultures contain highly purified, glutamatergic neurons but few synapses. (A) Subplate cultures immunostained at 7 d.i.v. for Tau (pseudocolored green) to label neurons and vimentin (red) to label nonneuronal cells. (B) Subplate cultures immunostained for glutamate (green) with a Hoescht counterstain for nuclei (blue). (C) Immunofluorescence for GAD-65 and GAD-67 (combined in red) to label GABAergic neurons, with all neurons counterstained for Tau (green). (D) Subplate or (E) hippocampal neurons cultured for 10 days then immunostained for synapsin (red) and PSD-95 (green); counterstained using phalloidin to detect actin (blue). Synapses are defined as puncta colocalizing synapsin and PSD-95 (arrowheads), which appear yellow (or white in the presence of the blue phalloidin counterstain). Inset: magnified view of a portion of dendrite from each image. (F) Quantification of colocalized puncta per square micron of phalloidin-labeled neurite in subplate versus hippocampal neurons at indicated times in culture. Mean ± SEM, compiled from 3 experiments. Asterisks = P < 0.05, Student's t-test.
The presence of synapses in subplate cultures was first assessed morphologically by immunostaining for synapsin and PSD-95, known pre- and postsynaptic components, respectively (De Camilli et al. 1990; Garner et al. 2000; Kennedy 2000), and scoring the number of colocalized puncta. Despite the extensive network of processes established by subplate neurons, the cultures contained strikingly few sites where synapsin and PSD-95 were colocalized, when grown in basal medium (Fig. 1D). This situation contrasts significantly with a classical heterogeneous neuronal culture system such as hippocampal neurons (grown here in identical serum-free conditions), which develop many colocalized synaptic puncta (Fig. 1E). Subplate neurons do have puncta of either synapsin or PSD-95, but they are very small and few are colocalized, even up to 10 days of culture (Fig. 1F). In contrast, there is a large increase in the density of colocalized puncta in cultures of hippocampal neurons during the same time period (Fig. 1F).
Synaptogenesis by Subplate Neurons is Induced by a Feeder Layer
It is possible that the low density of synapses in purified subplate cultures is due to a lack of some factor from the subplate's environment in the embryonic brain. To investigate this idea, the neighboring cortical cells removed during immunopanning were added back in the form of a feeder layer. These neocortical cells, including both neurons and glia, do not bind to the antibody-coated panning plate because they do not express p75 NTR. They can be collected from the unbound fraction and plated at high density in tissue culture wells. Glass coverslips containing subplate neuron cultures were then placed above this cortical feeder layer, with spacers to prevent direct contact (see Methods). Remarkably, after just 48 h, subplate neurons exposed to the medium above the feeder layer underwent extensive synaptogenesis with one another, showing a 16-fold increase above control in the density of colocalized synapsin and PSD-95 puncta (Fig. 2A,B,D). A cumulative fraction plot of all compiled data demonstrates the strong divergence in synapse density between control versus feeder layer-treated subplate neurons (Kolmogorov–Smirnoff P < 0.001) (Fig. 2E). Glutamate receptors can also be found clustered at sites of PSD-95 puncta, as revealed by double immunostaining for PSD-95 and the glutamate receptor subunit GluR1 (Fig. 2C). Over these short times in culture (5 days in basal medium, then 2 days exposed to the feeder layer), subplate neurons (like hippocampal cultures at comparable stages) (Papa et al. 1995) do not form spines; colocalized puncta appear along dendritic shafts (Fig. 2B).
Figure 2.

Synaptogenesis can be induced by a cortical feeder layer. (A, B) Subplate neurons on coverslips, cultured for 5 days then placed on spacers above either an empty well (“ctrl”) or a well containing a feeder layer (FL) of cortical neurons and glia (“FL-treated”) for 2 days. Subplate coverslips are immunostained for synapsin (pseudocolored red) and PSD-95 (green), counterstained with phalloidin for actin (blue) (synapses: yellow or white puncta). Scale bar = 10 μm. (C) Feeder layer-treated subplate neurons immunostained for PSD-95 (green) and GluR1 (red). Scale bar = 5 μm. (D) Fold synaptogenesis = number of colocalized synapsin and PSD-95 puncta per μm2 of neurite (actin-stained) for subplate neurons grown from 5 to 7 d.i.v. in wells above cortical feeder layers (FL-treated) or using medium removed from the feeder layers (CCM), normalized to respective controls. Mean ± SEM, compiled from 9 or 4 experiments, respectively. P < 0.001, Student's t-test. (E) Cumulative fraction plot showing full distribution of normalized data for fold synaptogenesis, compiled from 64 to 208 separate images per condition. Kolmogorov–Smirnov P < 0.001 between each treatment and its control. (F) Percent survival of subplate neurons grown in control wells or above cortical feeder layers from 5 d.i.v. until indicated ages. Mean ± SEM, compiled from 10 experiments. (G, H) Example tracings of EGFP-filled cells in control (G) and feeder layer-treated (H) subplate neurons. Scale bar = 100 μm. (I) Sholl analysis of control and feeder layer-treated subplate neurons, demonstrating number of processes crossing rings drawn at the indicated distances from soma. Scale is logarithmic following break. N = 18 cells from 3 preps, in each condition. Asterisks = P < 0.05, Student's t-test. (J) Total length of all neurites/cell in control and feeder layer-treated subplate neurons. Asterisks = P < 0.05, Student's t-test.
Because the subplate neurons are not in direct contact with the cells comprising the feeder layer, it is likely that clustering and colocalization of synaptic proteins is caused by one or more diffusible factors released from the feeder layer. To examine this possibility, medium was conditioned over a feeder layer (cortical-conditioned medium, CCM), then removed and applied directly to subplate cultures. CCM also induced colocalization of synaptic proteins (Fig. 2D,E). Together, results show that subplate neurons can be induced to form morphologically defined synapses rapidly, by means of diffusible factor(s) released from a cortical feeder layer.
To examine whether the induction of synaptogenesis in subplate neurons is a property unique to cortical feeder layers, other cell types were tested as feeder layers. Feeder cultures made from the hippocampus, not a synaptic target of the subplate, can also induce synaptogenesis (Supplemental Fig. 1). A common element between the cortical and hippocampal feeder layers is the presence of glia, which are known to induce synaptogenesis in immunopurified RGCs (Pfrieger and Barres 1997; Ullian et al. 2001) and spinal motor neurons (Ullian et al. 2004). Indeed, a feeder layer of cortical glia increased synapse density on subplate coverslips (Supplemental Fig. 1).
The increase in synapses caused by feeder layer treatment is not secondary to an effect on cell survival, as control and treated subplate neurons have similar survival rates (Fig. 2F). Although brain-derived neurotrophic factor (BDNF) and neurotrophin 3 can increase the survival of subplate cultures (DeFreitas et al. 2001), the control neurons show survival rates over 50% after a week in serum-free media, without addition of any exogenous neurotrophins (Fig. 2F). This survival stands in contrast to other systems of immunopurified CNS neurons; purified RGCs, hippocampal neurons, and cerebellar neurons are kept alive by a cocktail that includes BDNF, ciliary neurotrophic factor, plus forskolin (Meyer-Franke et al. 1995; Steinmetz et al. 2006).
In addition to causing a large increase in colocalized synapsin and PSD-95 puncta, treatment with the feeder layer causes a change in cell morphology. Subplate neurons without the feeder layer extend processes (Fig. 2G), but treated cells appear to undergo more directed outgrowth, with fewer branches overall but with individual processes extending much longer distances from the soma (Fig. 2H–J). The morphology of these treated neurons is reminiscent of mature subplate neurons in the rodent brain (Valverde et al. 1989; Hanganu et al. 2001, 2002), which also have processes extending many cell diameters from the soma, rarely curving back on themselves as is often seen in untreated subplate neurons (Fig. 2G). The increased number of synapses in feeder layer–exposed subplate neurons is unlikely due simply to increased outgrowth, resulting in more frequent contact between neighboring neurons, because we observe that untreated subplate neurons contact one another, but rarely have synapses at points of contact. The dual effects of the feeder layer on both synapse formation and cell morphology highlight the fact that these processes are closely intertwined (McAllister et al. 1995, 1996, 1997).
Feeder Layer Exposure Induces Functional Synapses
To ascertain if the increase in colocalized synapsin and PSD-95 puncta reflects functional synaptogenesis, control cultures and cultures exposed to a feeder layer were used for whole-cell patch clamp recording to observe synaptic currents. In control cultures, where few synapses are detected by immunostaining, spontaneous mEPSCs were also extremely rare. In contrast, feeder layer–exposed subplate neurons had a significantly higher frequency of mEPSCs (Fig. 3A); over time mEPSC frequency increased progressively (Fig. 3B). After 3 days of feeder layer exposure, mEPSC frequency was 11-fold higher than in control neurons. An effect on frequency was visible but not significant at 2d, potentially because these young cultures have events of very small amplitudes (Fig. 3C); mEPSCs are thus undetectable in some cells, contributing to a higher standard error in frequency. mEPSC amplitudes were small in both conditions, but were significantly larger after 4 days of feeder layer exposure than in control neurons, demonstrating that newly created synapses are presumably being strengthened over time. Cumulative fraction plots show the compiled raw data for mEPSC frequency after 3 days of feeder layer exposure (Fig. 3D) and mEPSC amplitude after 4 days exposure (Fig. 3E) (the times at which these values first diverged significantly from controls in Fig. 3B,C). Note that although mean amplitudes did not differ greatly between control and treated cells, the range of amplitudes was much higher in treated cells. The mEPSCs recorded were AMPAergic, as they could be blocked by the AMPA receptor antagonist NBQX (Fig. 3F). Although individual neurons were not used for both electrophysiology and synaptic staining, the results of these electrophysiological experiments demonstrate that colocalized puncta seen by staining likely represent functional synapses.
Figure 3.

Feeder layer exposure induces functional synapses that are ultrastructurally normal. (A) Whole-cell patch clamp recordings from subplate neurons grown in control wells (ctrl) or above cortical feeder layers from 5 to 8 d.i.v. (FL-treated). Downward deflections represent mEPSCs. Magnified event shows characteristic mEPSC shape. (B) Frequency and (C) amplitude of mEPSCs in subplate neurons in control wells or above feeder layers for the durations shown, beginning at 5 d.i.v. (In both control and, less frequently, FL-treated conditions, some cells had no detectable mEPSCs, leading to higher variability in the mean frequencies.) Mean ± SEM, compiled from 6 to 16 cells per time point. Asterisks = P < 0.05, Student's t-test between control and FL-treated conditions. (D) Cumulative fraction plot of mEPSC frequency in neurons grown in control wells or above feeder layers d5–8, N = 10 and 16 cells, respectively. Kolmogorov–Smirnov P < 0.001. (E) Cumulative fraction plot of mEPSC amplitude in neurons grown in control wells or above feeder layers d5–9, N = 279 and 1075 mEPSCs, from 11 and 12 cells, respectively. Kolmogorov–Smirnov P < 0.001. (F) Example traces from a control neuron, or a FL-treated neuron before, during and after perfusion of the AMPA receptor blocker NBQX (10μM) to demonstrate blockade followed by recovery of mEPSCs. Blockade and recovery observed in 6 of 6 cells tested; 1 example shown. (G, H) Electron micrographs demonstrating typical diffuse scattering of synaptic vesicles in 7 d.i.v. control cells (G) and a typical synapse in a neuron exposed to a cortical feeder layer from 5 to 7 d.i.v. (H). Arrowheads: examples of vesicles. Arrow: postsynaptic density. Scale bar = 500nm. (I) Numbers of clusters of 10 or more vesicles in a radius approximately 5 μm out from each soma. Mean ± SEM. N = 21 cells per condition in 3 experiments, P < 0.01, Student's t-test.
The synaptogenesis caused by feeder layer treatment can also be observed at the ultrastructural level. The synaptic vesicles seen in electron micrographs of control neurons were mainly diffusely scattered in axons (Fig. 3G), whereas treated neurons displayed a number of ultrastructurally normal synapses, at which many vesicles were clustered in apposition to a postsynaptic density (Fig. 3H). A quantification of vesicle clusters in a 5 μm radius around each soma revealed that feeder layer–exposed neurons receive significantly more synapses than do control neurons (Fig. 3I). In sum, feeder layer treatment causes rapid synaptogenesis in subplate cultures than can be observed at morphological, functional, and ultrastructural levels.
A Program of Gene Expression is Induced by Feeder Layer Exposure
With a system in which synaptogenesis can be synchronized and controlled, molecular or biochemical techniques can be used to examine cellular events across many neurons as synapses develop. As a proof of principle of the utility of this culture system, Affymetrix rat GeneChip microarrays were used to assess whether feeder layer exposure induces detectable changes in gene expression in subplate neurons. It is expected that the developmental events occurring in the cultures, including synaptogenesis, neurite outgrowth, and cell survival, may all contribute to changes in gene expression following feeder layer treatment. The value of such a culture system therefore arises not from an artificial isolation of synaptogenesis from other developmental processes, but from improved synchronization of synaptogenesis, to track the regulation of known and/or new synaptic genes or proteins in a population rather than an individual cell.
To examine how the expression of synaptic genes is influenced by the triggering of synaptogenesis in subplate cultures, a list of known synaptic genes was first created using data from proteomics literature, and from GO annotations, which categorize genes according to a structured vocabulary (Ashburner et al. 2000). Proteins that have been found by subcellular fractionation and mass spectrometry to be associated with synaptic vesicles, synaptosomes or the postsynaptic density (Peng et al. 2004; Morciano et al. 2005; Cheng et al. 2006) were compiled with the primary high-level GO categories of synaptic development and function (“synaptogenesis,” “synaptic transmission,” and “synapse organization and biogenesis”) to form an extensive list of putative synaptic genes, that we hereafter call the “master synaptic list.” This list covers 1501 probe sets on the microarrays, corresponding to 613 unique Entrez Gene IDs (Supplemental Table 2). These genes were then each assigned to one of 15 classes of synaptic functions, such as “cell adhesion” or “scaffolds” (or “other”), by literature-based annotation.
To select time points for a study of the expression of these genes during synaptogenesis, subplate neurons were exposed to cortical feeder layers for varying durations. Subplate synapses develop rapidly following this treatment. An exposure to the feeder layer of only 48 h is sufficient to detect a significant increase in the density of synapses, and is as effective as longer durations (Fig. 4A). A time point of 24 h of treatment was therefore selected to represent a time following the first exposure to the trigger of the feeder layer, but before the large wave of synaptogenesis seen between 24 and 48 h of exposure. Additional microarrays were also performed after 96 h of exposure to assess gene expression changes at a time when the increase in synapse density has reached a plateau, but synapses may be undergoing turnover, maturation or stabilization. Microarrays experiments were performed, comparing gene expression in subplate neurons exposed to feeder layers for these durations of 24 and 96 h, along with age-matched controls, with 5 biological replicates per condition.
Figure 4.

Rapid synaptogenesis enables microarray experiments, validated by QPCR. (A) Subplate neurons exposed to a cortical feeder layer for increasing durations, beginning at 5 d.i.v. Fold synaptogenesis = number of colocalized synapsin and PSD-95 puncta per μm2 of actin-stained neurite, normalized to control cultures. Asterisks = P < 0.05, N.S. = nonsignificant, Student's t-test between FL-treated and respective control. Compiled from 4 experiments, 8 images per coverslip. (B) Validation of microarray results by comparison of expression ratio of selected genes in control and feeder layer-treated cultures, in microarray versus QPCR experiments (plotted logarithmically), using separate biological replicates of experiments. Microarrays: 5 replicates, QPCR: 3–4 replicates per gene. Expression ratio = expression in feeder layer-treated cells versus control cells. Note that data points fall only in the 2 quadrants, indicating that gene expression changed in the same direction on microarrays as in QPCR for every gene.
Before determining the synaptic genes regulated by feeder layer exposure, 10 genes showing small degrees of regulation on the microarrays were chosen to determine the sensitivity of the arrays at low fold changes; these 10 ranged from absolute values of 1.46- to 2.84-fold regulation at 24 h (Supplemental Table 1). These 10 were chosen arbitrarily because of known or likely roles in neurons, but no known roles to date as triggers in synaptic development, and were subjected to real-time quantitative PCR (QPCR) to validate microarrays (Fig. 4B). Although the magnitude of a gene's expression ratio could differ between QPCR and microarrays, all 10 genes showed changes by QPCR in the same direction as on microarrays (Fig. 4B and Supplemental Table 1). The population of expression ratios from QPCR was significantly correlated with that of the microarrays (correlation coefficient r = 0.56, t distribution P < 0.05). QPCR results thus showed good agreement with microarray results, and demonstrated that the microarray experiments can detect biological changes with good sensitivity.
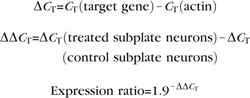
To determine whether the genes identified in microarray experiments might be candidates involved in synaptic development in vivo, the mRNA expression patterns of the genes verified by QPCR were assessed by in situ hybridizations on brain tissue sections at times and places of known synapse development in the cortex. If any of these genes function in synapse development in the brain, they might be expected to show expression comparable to that of known pre- or postsynaptic components such as synapsin and PSD-95 (De Camilli et al. 1990; Garner et al. 2000; Kennedy 2000), shown for reference in Supplemental Figure 2. The presence of synapsin and PSD-95 mRNAs in the outermost zones of the cortex at E15, E18, and P7 is consistent with the timing and pattern of synapse appearance in the cortex; synapses can be detected by electron microscopy in the preplate (future subplate and marginal zones) beginning at E15 (Molliver et al. 1973; Konig et al. 1975), then in each uppermost layer as it is generated, with the highest density of synapses found in the most recently generated upper layers by P7 (Blue and Parnavelas 1983b). Indeed, 2 of the 10 genes that were tested by QPCR have known expression patterns that are similar to those of synapsin and PSD-95 in the developing cortex: NrCAM (www.genepaint.org) and PSD-93 (Brenman et al. 1996). The other 8 genes were tested here by in situ hybridization. Six of the 8 had mRNA expression in the cortex with aspects reminiscent of synapsin and PSD-95, at E15, E18, and P7 (Fig. 5). Note that expression of synapsin and PSD-95 mRNA is more widespread than the location of subplate neurons (illustrated by expression of p75 NTR mRNA in Supplemental Fig. 2), as expected because these and other genes involved in synapse formation and development are not exclusive to subplate neurons. The 8 genes that are reminiscent of synapsin and PSD-95 vary in the details of their expression, but in general are found at times and places of synapse development in cortex. Microarrays on feeder layer–exposed versus control subplate neurons thus identify genes that may be relevant for synapse development not only in cultured subplate neurons but also more broadly in the cortex in vivo.
Figure 5.

In vivo expression patterns of selected genes that were regulated during periods of synaptogenesis in cultures. Sagittal sections from mouse brain at the indicated ages, shown with dorsal to top, rostral to right. Dark-field images of silver grains from isotopic in situ hybridization, for selected mRNAs whose regulation by feeder layer exposure was confirmed by QPCR. Arrows: upper layers of cortex, showing higher mRNA expression for many of these genes. Scale bar = 1 mm.
Of the list of 10 genes, only connective tissue growth factor (CTGF) and F-spondin differed from this general cortical expression pattern. As has been previously shown (Heuer et al. 2003), CTGF is expressed selectively in a thin band of cells within the subplate, and thus may play developmental roles restricted to the subplate. F-spondin is expressed strongly in a region of the anterior cortex at P7, but lacks widespread cortical expression (Fig. 5).
Overall, QPCR and in situ hybridization determined that fold changes well below 2 on the arrays can reflect genuine biological changes in these homogeneous cultures, and that these genes are expressed during development in the cortex. Genes with fold changes of 1.6 or above were submitted to ANOVA tests to create lists of significantly regulated genes for bioinformatics analyses. With these criteria, 991 probe sets were significantly regulated by 24-h feeder layer exposure, representing 3% of the probes on the arrays (Supplemental Table 3). 4383 probes (14%) were significantly regulated at 96 h (Supplemental Table 4).
Synaptic Genes are Expressed Prior to the Wave of Synaptogenesis Triggered by Feeder Layer Exposure
To assess the expression of known synaptic genes in subplate cultures, microarray results were examined for the expression of the genes of the master synaptic list. A majority of probes (1210 of 1501 probes, 80.6%) on the master synaptic list are expressed in the subplate cultures, using a criterion of an Affymetrix call of “Present” in at least 10 of 20 arrays; the 550 corresponding Entrez Gene identifiers are labeled “P” (present) in Supplemental Table 2. However, despite the expression of a large fraction of synaptic genes in subplate cultures, very little regulation is seen among these genes in response to 24-h feeder layer treatment. Thirty-four (6.2% of present synaptic genes) are downregulated (Supplemental Table 6), and only 15 (2.7%) are upregulated (Table 1). Subplate neurons in culture therefore already appear to express most of the mRNAs for components needed at synapses even in untreated conditions, and undergo very little regulation of synaptic gene expression at the onset of the large wave of triggered synaptogenesis.
Table 1.
Putative synaptic genes upregulated by 24-h feeder layer exposure
| Category | Name | Probe Set ID | Entrez gene | Exp. ratio |
| Cell adhesion | Brevican | 1387934_at | 25393 | 1.80 |
| Cell adhesion | Neural cell adhesion molecule 1 | 1378777_at | 24586 | 2.27 |
| Cell adhesion | Serine (or cysteine) proteinase inhib., clade E, mem. 2 | 1372440_at | 29366 | 1.68 |
| Cytoskeleton—actin | Breast carcinoma amplified sequence 1 | 1373098_at | 246755 | 7.20 |
| Cytoskeleton—other | Apolipoprotein E | 1370862_at | 25728 | 4.21 |
| Cytoskeleton—other | Cyclic nucleotide phosphodiesterase 1 | 1387897_at | 25275 | 2.26 |
| GTPases and regulators | CAMP-regulated guanine nucleotide exchange factor II | 1377529_at | 252857 | 1.93 |
| Kinases/phosphatases and regulators | Diacylglycerol kinase, beta | 1387224_at | 54248 | 1.74 |
| Kinases/phosphatases and regulators | Prot. tyrosine phosphatase, recep.-type, Z polypep. 1 | 1368350_at;1388015_at | 25613 | 2.99 |
| Other | Immunoglobulin superfam., mem. 4A (predict.) | 1392246_at | 363058 | 1.60 |
| Other | N-myc downstream regulated gene 2 | 1387121_a_at | 171114 | 4.46 |
| Receptors, channels, and transporters | ATPase, Na+/K+ transporting, alpha 2 polypeptide | 1386911_at | 24212 | 5.19 |
| Receptors, channels, and transporters | GABA transporter protein | 1368170_at | 79212 | 2.17 |
| Receptors, channels, and transporters | Glutamate receptor, metabotropic 1 | 1387286_at | 24414 | 2.19 |
| Receptors, channels, and transporters | Slc1a3 | 1368565_at | 29483 | 6.91 |
Note: All genes from the master list of putative synaptic genes that were significantly upregulated after 24-h feeder layer exposure, sorted by category. Exp. Ratio = expression ratio averaged from 5 replicate microarrays. Where an Entrez Gene identifier represented multiple probes, these are shown averaged here. In italics: genes that remained regulated in the same direction at 96 h.
Indeed, the lack of regulation of synaptic genes as a class at 24 h is supported by a GO analysis of the statistically overrepresented GO Biological Process categories, which may reflect biological processes activated by feeder layer exposure. Slightly under half (13,980) of the 31,099 probe sets on the rat microarrays used in these experiments had GO annotations. One hundred and thirty (at 24 h) and 223 (at 96 h) of 10,056 Biological Process categories were statistically overrepresented in the genes upregulated by feeder layer exposure. The 30 most significantly overrepresented categories are presented in Supplemental Table 5, along with categories overrepresented among downregulated genes. The analysis of annotated genes reveals that several GO categories related to synaptic development and function (“synapse organization and biogenesis,” “regulation of neurotransmitter secretion,” “synaptogenesis,” and “transmission of nerve impulse”) are overrepresented among upregulated genes at 96 h but not at 24 h (Supplemental Table 5). At 24 h, there was a notable overrepresentation of transcription-related categories, among other categories (Supplemental Table 5).
Of the 15 genes on the master synaptic list upregulated at 24 h, 13 remain upregulated at 96 h (italicized in Tables 1 and 2), plus there are an additional 20 synaptic genes newly upregulated at 96 h (Table 2). We conclude that subplate neurons in culture already contain many proteins necessary for the initial formation of synapses, and that additional synaptic genes may be regulated over longer times to replenish existing mRNAs and to provide new components for subsequent steps of synapse maturation.
Table 2.
Putative synaptic genes upregulated by 96-h feeder layer exposure
| Category | Name | Probe set ID | Entrez gene | Exp. ratio |
| Calcium binding | S100 protein, beta polypeptide | 1386903_at | 25742 | 2.03 |
| Cell adhesion | Brevican | 1387934_at | 25393 | 2.81 |
| Cell adhesion | Neural cell adhesion molecule 1 | 1378777_at | 24586 | 2.26 |
| Cell adhesion | Neurexin 3 | 1375653_at;1368261_at | 116508 | 2.33 |
| Cell adhesion | Neuroligin 2 | 1397705_at | 117096 | 1.60 |
| Cytoskeleton—actin | Breast carcinoma amplified sequence 1 | 1373098_at | 246755 | 12.57 |
| Cytoskeleton—other | Apolipoprotein E | 1370862_at | 25728 | 15.66 |
| Cytoskeleton—other | Cyclic nucleotide phosphodiesterase 1 | 1387897_at | 25275 | 2.79 |
| Cytoskeleton—other | Glial fibrillary acidic protein | 1368353_at | 24387 | 4.98 |
| Kinases/phosphatases and regulators | Ca++/calmodulin-dep. protein kinase II alpha subunit | 1381637_at | 25400 | 1.90 |
| kinases/phosphatases and regulators | Cell division cycle 25 homolog A (S. cerevisiae) | 1377558_at | 171102 | 1.81 |
| kinases/phosphatases and regulators | Diacylglycerol kinase, beta | 1387224_at | 54248 | 4.61 |
| kinases/phosphatases and regulators | Prot. tyrosine phosphatase, recep.-type, Z polypep. 1 | 1388015_at;1368350_at | 25613 | 5.66 |
| kinases/phosphatases and regulators | PX domain containing serine/threonine kinase | 1397380_at | 306203 | 2.46 |
| Motor proteins | Dynamin 2 | 1396562_at | 25751 | 2.12 |
| Motor proteins | Sim. to myosin VI | 1390277_at | 315840 | 2.28 |
| Other | Basic helix–loop–helix domain containing, class B2 | 1379483_at | 79431 | 2.32 |
| Other | Immunoglobulin superfam., mem. 4A (predict.) | 1379252_at;1395546_at 1376657_at;1392246_at | 363058 | 2.01 |
| Other | N-myc downstream regulated gene 2 | 1387121_a_at | 171114 | 5.55 |
| Receptors, channels, and transporters | ATPase, Na+/K+ transporting, alpha 2 polypeptide | 1386911_at | 24212 | 10.78 |
| Receptors, channels, and transporters | Brain-specific angiogenesis inhibitor 3 (predict.) | 1376478_at;1390994_at | 301309 | 1.72 |
| Receptors, channels, and transporters | Ca++ activated K+ chan. beta 4 subunit | 1387318_at | 66016 | 1.64 |
| Receptors, channels, and transporters | GABA transporter protein | 1368170_at | 79212 | 3.70 |
| Receptors, channels, and transporters | Gap junction membrane chan. protein alpha 1 | 1372002_at | 24392 | 5.69 |
| Receptors, channels, and transporters | Glutamate receptor, ionotr., N-methyl-D-aspartate 3A | 1370601_a_at | 191573 | 1.85 |
| Receptors, channels, and transporters | Glutamate receptor, metabotropic 1 | 1387286_at | 24414 | 1.78 |
| Receptors, channels, and transporters | Inositol 1,4,5-triphosphate receptor 1 | 1394880_at | 25262 | 3.07 |
| Receptors, channels, and transporters | K+ voltage-gated chan., subfam. Q, mem. 3 | 1397599_at | 29682 | 2.97 |
| Receptors, channels, and transporters | Slc1a3 | 1368565_at | 29483 | 10.01 |
| Scaffolds | PSD-95 binding protein | 1381517_at | 65040 | 1.69 |
| Secreted | Neurotrophin 3 | 1387267_at | 81737 | 2.96 |
| Vesicles and membrane trafficking | Synapsin II | 1388811_at;1370431_at | 29179 | 2.05 |
| Vesicles and membrane trafficking | Synaptic vesicle glycoprotein 2c | 1398221_at | 29643 | 2.03 |
Note: All genes from the master list of putative synaptic genes that were significantly upregulated after 96-h feeder layer exposure, sorted by category, as in Table 1. In italics: genes that were upregulated at both 24 and 96 h.
If a new program of gene expression is activated during synapse development, one possible consequence could be that synaptic genes belonging to certain classes are coregulated. To discover if feeder layer exposure causes preferential regulation of certain types of synaptic genes, an analysis similar to that done for GO categories was performed on the regulated genes in the master synaptic list. A cumulative hypergeometric distribution revealed that certain categories of synaptic genes are indeed enriched among the regulated gene set (Table 3). Most significantly, more genes from the category “receptors, channels & transporters” are upregulated than would be expected by chance, at both 24 and 96 h. Another notable example is the enrichment of the “cell adhesion” category at 24 h. Particular classes of synaptic transcripts may thus undergo coordinated regulation as synapses develop.
Table 3.
Particular categories of putative synaptic genes are overrepresented among regulated genes
| Category | 24 h treated | 96 h treated |
| Calcium binding | ▴ (0.017) | |
| Cell adhesion | ▴ (0.029) | |
| Chaperones | ▾ (0.030) | |
| Cytoskeleton — actin | ||
| Cytoskeleton — other | ▴ (0.034) | |
| GTPases and regulators | ||
| Kinases/phosphatases and regulators | ▴ (0.039) | |
| Motor proteins | ||
| Receptors, channels and transporters | ▴ (0.017) | ▴ (0.0003) |
| Scaffolds | ▾ (0.023) | |
| Secreted | ||
| Translation | ||
| Ubiquitin proteasome | ||
| Vesicles and membrane trafficking |
Note: Cumulative hypergeometric distribution P values (in brackets) for the categories of genes from the master synaptic list that are significantly enriched among genes upregulated (up arrowheads, black) or downregulated (down arrowheads, gray) by feeder layer treatment.
Discussion
Results here demonstrate that a specific population of cortical neurons, the subplate neurons, can be immunopurified for the study of events during and downstream of synaptogenesis, with synapse formation being triggered in a more synchronous fashion than has been previously possible. Although subplate neurons form some of the earliest synapses in the cortex and can connect with one another in vivo (Molliver et al. 1973; Konig et al. 1975; Kostovic and Rakic 1980; Konig and Marty 1981; Blue and Parnavelas 1983a, 1983b; Wahle and Meyer 1987; Chun and Shatz 1988; Friauf et al. 1990; Hanganu et al. 2002; Hanganu et al. 2008), they do not intrinsically initiate large-scale synaptogenesis with each other in purified cultures grown in defined basal medium. This is in marked contrast to immunopurified hippocampal and cerebellar neurons, which gradually form many synapses spontaneously (Steinmetz et al. 2006). In this respect, subplate cultures more closely resemble immunopurified RGCs (RGCs) and spinal motor neurons (Pfrieger and Barres 1997; Ullian et al. 2001, 2004), which also form few synapses. One commonality between these 3 culture systems may be their embryonic rather than postnatal derivation.
Rapid, Synchronous Synaptogenesis in Subplate Neuron Cultures
Our results show that external factors from the embryonic environment may trigger subplate neuron synaptogenesis. Synapse formation is activated by a feeder layer of the subplate's neighboring cells from the neocortex. It is highly likely that a diffusible factor released by the feeder cells is responsible, because 1) medium conditioned by the feeder layer is also effective, and 2) the subplate neurons are not in direct contact with the feeder layer (see Methods). It is possible that the factor(s) released by the mixed cortical feeder layer could be the same glial factors known to initiate synaptogenesis in RGCs, such as thrombospondin (Christopherson et al. 2005). It is also possible that other cell types in the feeder layer, such as cortical neurons themselves, are a source of synaptogenic factors, or that both neurons and glia provide such signals. It remains to be determined whether the feeder layer causes the increase in synapse number through a greater rate of synapse formation, or more effective stabilization of new synapses, or both.
In subplate neurons, a 16-fold increase in colocalized pre- and postsynaptic puncta can be detected after 48 h exposure to the feeder layer, whereas in RGCs, a 6-day exposure to astrocytes is required for the smaller, 6-fold increase seen in GluR2/3 puncta (Ullian et al. 2001). One possible explanation for the greater response in subplate neurons is that they are grown without exogenous neurotrophins, which may modulate signaling pathways and influence responsiveness to a synaptogenic factor. Subplate neurons may also have already been “primed” to respond to synaptogenic factors in vivo by the time they are removed for culture at E17. Perhaps also relevant is the fact that few if any RGCs make synaptic contacts with one another in vivo (Dacey 1985), whereas subplate neurons do. The availability of appropriate target cells in subplate neuron cultures may be critical for eliciting this rapid synaptogenesis.
Feeder layer–exposed subplate cultures are undergoing not only synaptogenesis but additional developmental changes such as neurite outgrowth, cellular signaling responses to trophic factors, and an increase in global network activity. This situation may more accurately model development in vivo than culture systems in which synaptogenesis is monitored in isolation. In particular, synapse and neurite development are coupled in many circumstances (Cline 2001; Chen and Ghosh 2005) and may share molecular components. For example, the neurotrophin BDNF not only regulates synaptic innervation density (Causing et al. 1997) but also dendritic and axonal structure (Cohen-Cory and Fraser 1995; McAllister et al. 1995). Indeed, the synaptotrophic hypothesis proposes that the presence of a synapse can drive the growth and development of a neurite from that location (Cline and Haas 2008). It is worth noting that the branching patterns of immunopanned subplate neurons only resemble their in vivo counterparts after synaptogenesis is induced. This culture system should be of use for examining how synapse formation relates to neurite development, as the control neurons have neurites that grow in the relative absence of synapses, whereas the feeder layer–exposed neurons have neurites that undergo further elaboration in the presence of synapses.
Gene Expression Changes Accompanying Feeder Layer-Triggered Synaptogenesis
Many of the genes regulated by the feeder layer have not been previously known to function at synapses, but may bear investigation as potential modulators of synaptic development. The most highly overrepresented GO category among genes upregulated at 24 h is “Cell Proliferation,” a process not thought to be functioning in postmitotic neurons. However, many genes receive GO annotations based on studies in nonneuronal cells, and are worth investigating for other roles in neurons. An example from the Cell Proliferation category is TGFB (Transforming Growth Factor Beta) Inducible Early Growth Response, annotated based on its function in pancreatic epithelial cells (Tachibana et al. 1997), yet upregulated in neurons following synaptic plasticity (Wibrand et al. 2006). Other regulated genes merit exploration for novel roles at developing synapses as well; several regulated genes not previously known to influence synapse development are seen in areas of the cortex undergoing synapse formation, by in situ hybridization, and may represent novel factors important for synaptic development.
Although novel synaptic genes may be found among those regulated here, subplate neurons are undergoing multiple developmental processes along with synaptogenesis. A productive use of the culture system is to focus on known synaptic genes, to track their behavior over the course of synapse development, with better synchronization than was previously available. Strikingly, many familiar components of glutamatergic synapses, such as proteins of the postsynaptic density or the presynaptic release apparatus, show no mRNA expression change following 24 h exposure to the feeder layer. It is important to note that although many of these synaptic genes are not regulated, they are indeed expressed. These include (by their common names): synaptophysin, synaptotagmin I, syntaxin 1A, piccolo, Mint, GluR1, NMDAR1, GRIP, and many others (compare the list of hundreds of synaptic genes expressed in the subplate in Supplemental Table 2 to only 15 synaptic genes regulated at 24 h in Table 1). These synaptic components may be present because subplate neurons were already making synapses in vivo prior to culturing. It is known that young neurons manufacture certain synaptic components prior to synapse formation, and that many proteins show fast recruitment to nascent synapses (McAllister 2007). These results suggest that the onset of synaptogenesis largely entails the clustering of presynthesized synaptic proteins, without requiring additional production of synaptic components until later times.
It is only after 96-h feeder layer treatment that GO analysis shows known synaptic genes to be upregulated as a class, possibly because these contribute to later synaptic development, or require replenishing as their mRNAs are turned over. The maturation of synaptic properties such as the number of vesicles per presynaptic terminal (Vaughn 1989) occurs over much longer timescales than the initial recruitment of presynthesized proteins. Here, we find that isoforms of the vesicle-associated genes synapsin and SV2 are upregulated at 96 h but not at 24 h. Dynamin 2, known to aid slow endocytic processes that replenish the presynaptic terminal with vesicles (Robinson 2007), is also only upregulated by 96 h. Mechanisms for synaptic plasticity may also develop over longer timescales, and employ genes such as CaMKIIα (Griffith 2004), upregulated at 96 h.
Although few known components of synapses were regulated at 24 h, GO analysis does reveal preferential activation of certain gene categories at 24 h. For example, transcription-related processes are overrepresented; it is possible that transcriptional processes initiated by 24-h lead to the greater number of genes regulated at 96 h. Furthermore, among those synaptic genes regulated at 24 h is an overrepresentation of certain synapse-related categories, such as “cell adhesion” and “receptors, channels, and transporters.” An example of an upregulated gene from the cell adhesion category is neural cell adhesion molecule 1, an important regulator of synaptogenesis in many systems (Muller et al. 2008), An example from the receptor category is the metabotropic glutamate receptor mGluR1, which is known to regulate synaptic currents (Anwyl 1999; Schoepp 2001). It will be of interest to determine why only certain synaptic genes are upregulated during the early stages of synaptogenesis, and whether this mRNA regulation is important for the progression of synaptic development. We conclude that there is not a wholesale regulation of synaptic genes at 24 h, but that particular synaptic genes and adhesion molecules may be coregulated even at this early time. Note that the master synaptic list is a list of putative synaptic genes; a study of individual genes from this list would require validation of function at synapses.
This preferential regulation of certain categories of synaptic genes contrasts with a microarray study in mixed hippocampal cultures, where particular synaptic categories did not differ markedly in their regulation (Valor et al. 2007). However, examples of such coregulation exist. For example, the mRNA of certain ion channels can be coordinately regulated during activity-independent homeostasis in the crustacean stomatogastric ganglion (MacLean et al. 2005; Schulz et al. 2006). Significant activation of particular classes of synaptic genes may be detectable in subplate cultures because of the more synchronized synaptogenesis available in this system.
It is not known whether regulation of gene expression is required for synaptic development to progress. In mixed hippocampal cultures, a progressive increase in synapses is correlated with upregulation of synaptic genes, suggesting that gene regulation itself is required for synapse formation (Valor et al. 2007). However, in a system where synaptogenesis can be induced at will, we see that subplate neurons do not need to initiate a widespread upregulation of synaptic genes in order to form the first functional synapses. Indeed, the pre-existence of a large population of synaptic mRNAs in untreated subplate neurons shows that this gene expression profile may be necessary but not sufficient for forming initial synapses. Neurons may thus synthesize mRNAs for most necessary synaptic components, and yet not proceed to robust synapse formation without additional signal(s) from neighboring cells.
Synapse Development in Defined Cell Types
The subplate population purified here based on its expression of p75-NTR represents only one class of cortical neuron. The neurons in the cultures are almost exclusively glutamatergic, yet the subplate layer in the developing brain contains additional populations of peptidergic and GABAergic cells (Allendoerfer and Shatz 1994; Del Rio et al. 2000). Even the purified glutamatergic neurons used here may comprise different classes. For example, some but not all cells in the cultures express mRNA for CTGF (data not shown), a gene regulated by feeder layer treatment, likely reflecting the fact that only a very thin band within the subplate expresses CTGF in vivo (Fig. 5). The detailed identity of neurons in the subplate that are the source of the immunopurified cultures is not known; the p75-NTR–positive cells of the cultures may derive from either excitatory local neurons of the subplate or excitatory subplate projection neurons, or both. Note that excitatory drive to the overlying cortical plate is reduced if the p75-NTR–positive subplate neurons are ablated in vivo with an immunotoxin (Kanold et al. 2003), suggesting that at least part of this subplate population may include excitatory projection neurons.
As new cell type-specific markers are discovered, it may be found that the brain contains many more neuronal cell types than were previously thought to exist. Microarrays studies may help to establish a molecular profile of these cell classes. Clearly our understanding of synaptic development within and between neuronal populations will benefit from the development of methods such as those shown here for the purification of multiple cell types from across the cerebral cortex and elsewhere in the brain.
Supplementary Material
Supplementary material can be found at: http://www.cercor.oxfordjournals.org/.
Funding
National Institutes of Health (ROI EY02858) to C.J.S. and (P30 EY12196: core grant for Neurolucida software); and Howard Hughes Predoctoral Fellowship to C.E.M.
Acknowledgments
We wish to thank Dr Michael DeFreitas and Dr Bruce Bean for experimental advice, Bella Printseva, Michael Marcotrigiano and Maria Ericsson for expert technical assistance, Dr Alex Coventry for assistance with bioinformatics, and members of the Shatz lab for helpful discussions. We gratefully acknowledge gifts of reagents from Drs Masaru Okabe, Jeffery Kocsis, Eric Shooter and Daniel Kaufman. Conflict of Interest: None declared.
References
- Allendoerfer KL, Shatz CJ. The subplate, a transient neocortical structure: its role in the development of connections between thalamus and cortex. Annu Rev Neurosci. 1994;17:185–218. doi: 10.1146/annurev.ne.17.030194.001153. [DOI] [PubMed] [Google Scholar]
- Allendoerfer KL, Shelton DL, Shooter EM, Shatz CJ. Nerve growth factor receptor immunoreactivity is transiently associated with the subplate neurons of the mammalian cerebral cortex. Proc Natl Acad Sci USA. 1990;87:187–190. doi: 10.1073/pnas.87.1.187. [DOI] [PMC free article] [PubMed] [Google Scholar]
- Anwyl R. Metabotropic glutamate receptors: electrophysiological properties and role in plasticity. Brain Res Brain Res Rev. 1999;29:83–120. doi: 10.1016/s0165-0173(98)00050-2. [DOI] [PubMed] [Google Scholar]
- Ashburner M, Ball CA, Blake JA, Botstein D, Butler H, Cherry JM, Davis AP, Dolinski K, Dwight SS, Eppig JT, et al. Gene ontology: tool for the unification of biology. The Gene Ontology Consortium. Nat Genet. 2000;25:25–29. doi: 10.1038/75556. [DOI] [PMC free article] [PubMed] [Google Scholar]
- Barrett T, Troup DB, Wilhite SE, Ledoux P, Rudnev D, Evangelista C, Kim IF, Soboleva A, Tomashevsky M, Edgar R. NCBI GEO: mining tens of millions of expression profiles—database and tools update. Nucleic Acids Res. 2007;35:D760–D765. doi: 10.1093/nar/gkl887. [DOI] [PMC free article] [PubMed] [Google Scholar]
- Benjamini Y, Hochberg Y. Controlling the false discovery rate: a practical and powerful approach to multiple testing. J Roy Stat Soc Ser B. 1995;57:289–300. [Google Scholar]
- Blue ME, Parnavelas JG. The formation and maturation of synapses in the visual cortex of the rat. I. Qualitative analysis. J Neurocytol. 1983a;12:599–616. doi: 10.1007/BF01181526. [DOI] [PubMed] [Google Scholar]
- Blue ME, Parnavelas JG. The formation and maturation of synapses in the visual cortex of the rat. II. Quantitative analysis. J Neurocytol. 1983b;12:697–712. doi: 10.1007/BF01181531. [DOI] [PubMed] [Google Scholar]
- Brenman JE, Christopherson KS, Craven SE, McGee AW, Bredt DS. Cloning and characterization of postsynaptic density 93, a nitric oxide synthase interacting protein. J Neurosci. 1996;16:7407–7415. doi: 10.1523/JNEUROSCI.16-23-07407.1996. [DOI] [PMC free article] [PubMed] [Google Scholar]
- Buchanan J, Sun YA, Poo MM. Studies of nerve-muscle interactions in Xenopus cell culture: fine structure of early functional contacts. J Neurosci. 1989;9:1540–1554. doi: 10.1523/JNEUROSCI.09-05-01540.1989. [DOI] [PMC free article] [PubMed] [Google Scholar]
- Callaway EM, Katz LC. Development of axonal arbors of layer 4 spiny neurons in cat striate cortex. J Neurosci. 1992;12:570–582. doi: 10.1523/JNEUROSCI.12-02-00570.1992. [DOI] [PMC free article] [PubMed] [Google Scholar]
- Causing CG, Gloster A, Aloyz R, Bamji SX, Chang E, Fawcett J, Kuchel G, Miller FD. Synaptic innervation density is regulated by neuron-derived BDNF. Neuron. 1997;18:257–267. doi: 10.1016/s0896-6273(00)80266-4. [DOI] [PubMed] [Google Scholar]
- Chen Y, Ghosh A. Regulation of dendritic development by neuronal activity. J Neurobiol. 2005;64:4–10. doi: 10.1002/neu.20150. [DOI] [PubMed] [Google Scholar]
- Cheng D, Hoogenraad CC, Rush J, Ramm E, Schlager MA, Duong DM, Xu P, Wijayawardana SR, Hanfelt J, Nakagawa T, et al. Relative and absolute quantification of postsynaptic density proteome isolated from rat forebrain and cerebellum. Mol Cell Proteomics. 2006;5:1158–1170. doi: 10.1074/mcp.D500009-MCP200. [DOI] [PubMed] [Google Scholar]
- Chow I, Poo MM. Release of acetylcholine from embryonic neurons upon contact with muscle cell. J Neurosci. 1985;5:1076–1082. doi: 10.1523/JNEUROSCI.05-04-01076.1985. [DOI] [PMC free article] [PubMed] [Google Scholar]
- Christopherson KS, Ullian EM, Stokes CC, Mullowney CE, Hell JW, Agah A, Lawler J, Mosher DF, Bornstein P, Barres BA. Thrombospondins are astrocyte-secreted proteins that promote CNS synaptogenesis. Cell. 2005;120:421–433. doi: 10.1016/j.cell.2004.12.020. [DOI] [PubMed] [Google Scholar]
- Chun JJ, Shatz CJ. Redistribution of synaptic vesicle antigens is correlated with the disappearance of a transient synaptic zone in the developing cerebral cortex. Neuron. 1988;1:297–310. doi: 10.1016/0896-6273(88)90078-5. [DOI] [PubMed] [Google Scholar]
- Cline H, Haas K. The regulation of dendritic arbor development and plasticity by glutamatergic synaptic input: a review of the synaptotrophic hypothesis. J Physiol. 2008;586:1509–1517. doi: 10.1113/jphysiol.2007.150029. [DOI] [PMC free article] [PubMed] [Google Scholar]
- Cline HT. Dendritic arbor development and synaptogenesis. Curr Opin Neurobiol. 2001;11:118–126. doi: 10.1016/s0959-4388(00)00182-3. [DOI] [PubMed] [Google Scholar]
- Cohen-Cory S, Fraser SE. Effects of brain-derived neurotrophic factor on optic axon branching and remodelling in vivo. Nature. 1995;378:192–196. doi: 10.1038/378192a0. [DOI] [PubMed] [Google Scholar]
- Dacey DM. Wide-spreading terminal axons in the inner plexiform layer of the cat's retina: evidence for intrinsic axon collaterals of ganglion cells. J Comp Neurol. 1985;242:247–262. doi: 10.1002/cne.902420207. [DOI] [PubMed] [Google Scholar]
- Dalva MB, Takasu MA, Lin MZ, Shamah SM, Hu L, Gale NW, Greenberg ME. EphB receptors interact with NMDA receptors and regulate excitatory synapse formation. Cell. 2000;103:945–956. doi: 10.1016/s0092-8674(00)00197-5. [DOI] [PubMed] [Google Scholar]
- De Camilli P, Benfenati F, Valtorta F, Greengard P. The synapsins. Annu Rev Cell Biol. 1990;6:433–460. doi: 10.1146/annurev.cb.06.110190.002245. [DOI] [PubMed] [Google Scholar]
- DeFreitas MF, McQuillen PS, Shatz CJ. A novel p75NTR signaling pathway promotes survival, not death, of immunopurified neocortical subplate neurons. J Neurosci. 2001;21:5121–5129. doi: 10.1523/JNEUROSCI.21-14-05121.2001. [DOI] [PMC free article] [PubMed] [Google Scholar]
- Del Rio JA, Martinez A, Auladell C, Soriano E. Developmental history of the subplate and developing white matter in the murine neocortex. Neuronal organization and relationship with the main afferent systems at embryonic and perinatal stages. Cereb Cortex. 2000;10:784–801. doi: 10.1093/cercor/10.8.784. [DOI] [PubMed] [Google Scholar]
- Dupont E, Hanganu IL, Kilb W, Hirsch S, Luhmann HJ. Rapid developmental switch in the mechanisms driving early cortical columnar networks. Nature. 2006;439:79–83. doi: 10.1038/nature04264. [DOI] [PubMed] [Google Scholar]
- Edgar R, Domrachev M, Lash AE. Gene Expression Omnibus: NCBI gene expression and hybridization array data repository. Nucleic Acids Res. 2002;30:207–210. doi: 10.1093/nar/30.1.207. [DOI] [PMC free article] [PubMed] [Google Scholar]
- Friauf E, McConnell SK, Shatz CJ. Functional synaptic circuits in the subplate during fetal and early postnatal development of cat visual cortex. J Neurosci. 1990;10:2601–2613. doi: 10.1523/JNEUROSCI.10-08-02601.1990. [DOI] [PMC free article] [PubMed] [Google Scholar]
- Friauf E, Shatz CJ. Changing patterns of synaptic input to subplate and cortical plate during development of visual cortex. J Neurophysiol. 1991;66:2059–2071. doi: 10.1152/jn.1991.66.6.2059. [DOI] [PubMed] [Google Scholar]
- Garner CC, Nash J, Huganir RL. PDZ domains in synapse assembly and signalling. Trends Cell Biol. 2000;10:274–280. doi: 10.1016/s0962-8924(00)01783-9. [DOI] [PubMed] [Google Scholar]
- Ghosh A, Antonini A, McConnell SK, Shatz CJ. Requirement for subplate neurons in the formation of thalamocortical connections. Nature. 1990;347:179–181. doi: 10.1038/347179a0. [DOI] [PubMed] [Google Scholar]
- Ghosh A, Shatz CJ. Pathfinding and target selection by developing geniculocortical axons. J Neurosci. 1992;12:39–55. doi: 10.1523/JNEUROSCI.12-01-00039.1992. [DOI] [PMC free article] [PubMed] [Google Scholar]
- Ghosh A, Shatz CJ. A role for subplate neurons in the patterning of connections from thalamus to neocortex. Development (Cambridge). J Neurosci. 1993;117:1031–1047. doi: 10.1242/dev.117.3.1031. [DOI] [PubMed] [Google Scholar]
- Goslin K, Asmussen H, Banker G. Rat hippocampal neurons in low-density culture. In: Banker G, Goslin K, editors. Culturing nerve cells. 2nd ed. Cambridge (MA): The MIT Press; 1998. pp. 339–370. [Google Scholar]
- Griffith LC. Calcium/calmodulin-dependent protein kinase II: an unforgettable kinase. J Neurosci. 2004;24:8391–8393. doi: 10.1523/JNEUROSCI.2888-04.2004. [DOI] [PMC free article] [PubMed] [Google Scholar]
- Hanganu IL, Kilb W, Luhmann HJ. Spontaneous synaptic activity of subplate neurons in neonatal rat somatosensory cortex. Cereb Cortex. 2001;11:400–410. doi: 10.1093/cercor/11.5.400. [DOI] [PubMed] [Google Scholar]
- Hanganu IL, Kilb W, Luhmann HJ. Functional synaptic projections onto subplate neurons in neonatal rat somatosensory cortex. J Neurosci. 2002;22:7165–7176. doi: 10.1523/JNEUROSCI.22-16-07165.2002. [DOI] [PMC free article] [PubMed] [Google Scholar]
- Hanganu IL, Luhmann HJ. Functional nicotinic acetylcholine receptors on subplate neurons in neonatal rat somatosensory cortex. J Neurophysiol. 2004;92:189–198. doi: 10.1152/jn.00010.2004. [DOI] [PubMed] [Google Scholar]
- Hanganu IL, Okabe A, Lessmann V, Luhmann HJ. Cellular mechanisms of subplate-driven and cholinergic input-dependent network activity in the neonatal rat somatosensory cortex. Cereb Cortex. 2008 doi: 10.1093/cercor/bhn061. Advance Access published April 24, 2008, doi:10.1093/cercor/bhn061. [DOI] [PubMed] [Google Scholar]
- Herrmann K, Antonini A, Shatz CJ. Ultrastructural evidence for synaptic interactions between thalamocortical axons and subplate neurons. Eur J Neurosci. 1994;6:1729–1742. doi: 10.1111/j.1460-9568.1994.tb00565.x. [DOI] [PubMed] [Google Scholar]
- Heuer H, Christ S, Friedrichsen S, Brauer D, Winckler M, Bauer K, Raivich G. Connective tissue growth factor: a novel marker of layer VII neurons in the rat cerebral cortex. Neuroscience. 2003;119:43–52. doi: 10.1016/s0306-4522(03)00100-3. [DOI] [PubMed] [Google Scholar]
- Higashi S, Molnar Z, Kurotani T, Toyama K. Prenatal development of neural excitation in rat thalamocortical projections studied by optical recording. Neuroscience. 2002;115:1231–1246. doi: 10.1016/s0306-4522(02)00418-9. [DOI] [PubMed] [Google Scholar]
- Hirsch S, Luhmann HJ. Pathway-specificity in N-methyl-d-aspartate receptor-mediated synaptic inputs onto subplate neurons. Neuroscience. 2008;153:1092–1102. doi: 10.1016/j.neuroscience.2008.01.068. [DOI] [PubMed] [Google Scholar]
- Hohmann CF, Berger-Sweeney J. Cholinergic regulation of cortical development and plasticity—new twists to an old story. Perspect Dev Neurobiol. 1998;5:401–425. [PubMed] [Google Scholar]
- Ito T, Suzuki A, Imai E, Okabe M, Hori M. Bone marrow is a reservoir of repopulating mesangial cells during glomerular remodeling. J Am Soc Nephrol. 2001;12:2625–2635. doi: 10.1681/ASN.V12122625. [DOI] [PubMed] [Google Scholar]
- Kanold PO, Kara P, Reid RC, Shatz CJ. Role of subplate neurons in functional maturation of visual cortical columns. Science. 2003;301:521–525. doi: 10.1126/science.1084152. [DOI] [PubMed] [Google Scholar]
- Kennedy MB. Signal-processing machines at the postsynaptic density. Science. 2000;290:750–754. doi: 10.1126/science.290.5492.750. [DOI] [PubMed] [Google Scholar]
- Kidokoro Y, Yeh E. Initial synaptic transmission at the growth cone in Xenopus nerve-muscle cultures. Proc Natl Acad Sci USA. 1982;79:6727–6731. doi: 10.1073/pnas.79.21.6727. [DOI] [PMC free article] [PubMed] [Google Scholar]
- Konig N, Marty R. Early neurogenesis and synaptogenesis in cerebral cortex. Bibl Anat. 1981;19:152–160. [PubMed] [Google Scholar]
- Konig N, Roch G, Marty R. The onset of synaptogenesis in rat temporal cortex. Anat Embryol. 1975;148:73–87. doi: 10.1007/BF00315564. [DOI] [PubMed] [Google Scholar]
- Kostovic I, Rakic P. Cytology and time of origin of interstitial neurons in the white matter in infant and adult human and monkey telencephalon. J Neurocytol. 1980;9:219–242. doi: 10.1007/BF01205159. [DOI] [PubMed] [Google Scholar]
- Lein ES, Finney EM, McQuillen PS, Shatz CJ. Subplate neuron ablation alters neurotrophin expression and ocular dominance column formation. Proc Natl Acad Sci USA. 1999;96:13491–13495. doi: 10.1073/pnas.96.23.13491. [DOI] [PMC free article] [PubMed] [Google Scholar]
- Lein ES, Shatz CJ. Rapid regulation of brain-derived neurotrophic factor mRNA within eye- specific circuits during ocular dominance column formation. J Neurosci. 2000;20:1470–1483. doi: 10.1523/JNEUROSCI.20-04-01470.2000. [DOI] [PMC free article] [PubMed] [Google Scholar]
- Luskin MB, Shatz CJ. Studies of the earliest generated cells of the cat's visual cortex: cogeneration of subplate and marginal zones. J Neurosci. 1985;5:1062–1075. doi: 10.1523/JNEUROSCI.05-04-01062.1985. [DOI] [PMC free article] [PubMed] [Google Scholar]
- MacLean JN, Zhang Y, Goeritz ML, Casey R, Oliva R, Guckenheimer J, Harris-Warrick RM. Activity-independent coregulation of IA and Ih in rhythmically active neurons. J Neurophysiol. 2005;94:3601–3617. doi: 10.1152/jn.00281.2005. [DOI] [PubMed] [Google Scholar]
- Marin-Padilla M. Dual origin of the mammalian neocortex and evolution of the cortical plate. Anat Embryol. 1978;152:109–126. doi: 10.1007/BF00315920. [DOI] [PubMed] [Google Scholar]
- McAllister AK. Dynamic aspects of CNS synapse formation. Annu Rev Neurosci. 2007;30:425–450. doi: 10.1146/annurev.neuro.29.051605.112830. [DOI] [PMC free article] [PubMed] [Google Scholar]
- McAllister AK, Katz LC, Lo DC. Neurotrophin regulation of cortical dendritic growth requires activity. Neuron. 1996;17:1057–1064. doi: 10.1016/s0896-6273(00)80239-1. [DOI] [PubMed] [Google Scholar]
- McAllister AK, Katz LC, Lo DC. Opposing roles for endogenous BDNF and NT-3 in regulating cortical dendritic growth. Neuron. 1997;18:767–778. doi: 10.1016/s0896-6273(00)80316-5. [DOI] [PubMed] [Google Scholar]
- McAllister AK, Lo DC, Katz LC. Neurotrophins regulate dendritic growth in developing visual cortex. Neuron. 1995;15:791–803. doi: 10.1016/0896-6273(95)90171-x. [DOI] [PubMed] [Google Scholar]
- Meinecke DL, Rakic P. Low-affinity p75 nerve growth factor receptor expression in the embryonic monkey telencephalon: timing and localization in diverse cellular elements. Neuroscience. 1993;54:105–116. doi: 10.1016/0306-4522(93)90386-t. [DOI] [PubMed] [Google Scholar]
- Meyer-Franke A, Kaplan MR, Pfrieger FW, Barres BA. Characterization of the signaling interactions that promote the survival and growth of developing retinal ganglion cells in culture. Neuron. 1995;15:805–819. doi: 10.1016/0896-6273(95)90172-8. [DOI] [PubMed] [Google Scholar]
- Micheva KD, Beaulieu C. Quantitative aspects of synaptogenesis in the rat barrel field cortex with special reference to GABA circuitry. J Comp Neurol. 1996;373:340–354. doi: 10.1002/(SICI)1096-9861(19960923)373:3<340::AID-CNE3>3.0.CO;2-2. [DOI] [PubMed] [Google Scholar]
- Molliver ME, Kostovic I, van der Loos H. The development of synapses in cerebral cortex of the human fetus. Brain Res. 1973;50:403–407. doi: 10.1016/0006-8993(73)90741-5. [DOI] [PubMed] [Google Scholar]
- Morciano M, Burre J, Corvey C, Karas M, Zimmermann H, Volknandt W. Immunoisolation of two synaptic vesicle pools from synaptosomes: a proteomics analysis. J Neurochem. 2005;95:1732–1745. doi: 10.1111/j.1471-4159.2005.03506.x. [DOI] [PubMed] [Google Scholar]
- Muller D, Mendez P, De Roo M, Klauser P, Steen S, Poglia L. Role of NCAM in spine dynamics and synaptogenesis. Neurochem Res. 2008 doi: 10.1007/s11064-008-9653-5. Published online March 20, 2008, doi: 10.1007/s11064-008-9653-5. [DOI] [PubMed] [Google Scholar]
- Noble M, Mayer-Proschel M. Culture of astrocytes, oligodendrocytes, and O-2A progenitor cells. In: Banker G, Goslin K, editors. Culturing nerve cells. 2nd ed. Cambridge (MA): The MIT Press; 1998. pp. 461–498. [Google Scholar]
- Papa M, Bundman MC, Greenberger V, Segal M. Morphological analysis of dendritic spine development in primary cultures of hippocampal neurons. J Neurosci. 1995;15:1–11. doi: 10.1523/JNEUROSCI.15-01-00001.1995. [DOI] [PMC free article] [PubMed] [Google Scholar]
- Peng J, Kim MJ, Cheng D, Duong DM, Gygi SP, Sheng M. Semiquantitative proteomic analysis of rat forebrain postsynaptic density fractions by mass spectrometry. J Biol Chem. 2004;279:21003–21011. doi: 10.1074/jbc.M400103200. [DOI] [PubMed] [Google Scholar]
- Pfrieger FW, Barres BA. Synaptic efficacy enhanced by glial cells in vitro. Science. 1997;277:1684–1687. doi: 10.1126/science.277.5332.1684. [DOI] [PubMed] [Google Scholar]
- Price DJ, Kennedy H, Dehay C, Zhou L, Mercier M, Jossin Y, Goffinet AM, Tissir F, Blakey D, Molnar Z. The development of cortical connections. Eur J Neurosci. 2006;23:910–920. doi: 10.1111/j.1460-9568.2006.04620.x. [DOI] [PubMed] [Google Scholar]
- Robinson PJ. Neuroscience. How to fill a synapse. Science. 2007;316:551–553. doi: 10.1126/science.1142705. [DOI] [PubMed] [Google Scholar]
- Romijn HJ, Mud MT, Habets AM, Wolters PS. A quantitative electron microscopic study on synapse formation in dissociated fetal rat cerebral cortex in vitro. Brain Res. 1981;227:591–605. doi: 10.1016/0165-3806(81)90011-0. [DOI] [PubMed] [Google Scholar]
- Schoepp DD. Unveiling the functions of presynaptic metabotropic glutamate receptors in the central nervous system. J Pharmacol Exp Ther. 2001;299:12–20. [PubMed] [Google Scholar]
- Schulz DJ, Goaillard JM, Marder E. Variable channel expression in identified single and electrically coupled neurons in different animals. Nat Neurosci. 2006;9:356–362. doi: 10.1038/nn1639. [DOI] [PubMed] [Google Scholar]
- Sholl DA. Dendritic organization in the neurons of the visual and motor cortices of the cat. J Anat. 1953;87:387–406. [PMC free article] [PubMed] [Google Scholar]
- Steinmetz CC, Buard I, Claudepierre T, Nagler K, Pfrieger FW. Regional variations in the glial influence on synapse development in the mouse CNS. J Physiol. 2006;577:249–261. doi: 10.1113/jphysiol.2006.117358. [DOI] [PMC free article] [PubMed] [Google Scholar]
- Tachibana I, Imoto M, Adjei PN, Gores GJ, Subramaniam M, Spelsberg TC, Urrutia R. Overexpression of the TGFbeta-regulated zinc finger encoding gene, TIEG, induces apoptosis in pancreatic epithelial cells. J Clin Invest. 1997;99:2365–2374. doi: 10.1172/JCI119418. [DOI] [PMC free article] [PubMed] [Google Scholar]
- Takahashi T, Nakajima Y, Hirosawa K, Nakajima S, Onodera K. Structure and physiology of developing neuromuscular synapses in culture. J Neurosci. 1987;7:473–481. doi: 10.1523/JNEUROSCI.07-02-00473.1987. [DOI] [PMC free article] [PubMed] [Google Scholar]
- Ullian EM, Harris BT, Wu A, Chan JR, Barres BA. Schwann cells and astrocytes induce synapse formation by spinal motor neurons in culture. Mol Cell Neurosci. 2004;25:241–251. doi: 10.1016/j.mcn.2003.10.011. [DOI] [PubMed] [Google Scholar]
- Ullian EM, Sapperstein SK, Christopherson KS, Barres BA. Control of synapse number by glia. Science. 2001;291:657–661. doi: 10.1126/science.291.5504.657. [DOI] [PubMed] [Google Scholar]
- Valor LM, Charlesworth P, Humphreys L, Anderson CN, Grant SG. Network activity-independent coordinated gene expression program for synapse assembly. Proc Natl Acad Sci USA. 2007;104:4658–4663. doi: 10.1073/pnas.0609071104. [DOI] [PMC free article] [PubMed] [Google Scholar]
- Valverde F, Facal-Valverde MV, Santacana M, Heredia M. Development and differentiation of early generated cells of sublayer VIb in the somatosensory cortex of the rat: a correlated Golgi and autoradiographic study. J Comp Neurol. 1989;290:118–140. doi: 10.1002/cne.902900108. [DOI] [PubMed] [Google Scholar]
- Vaughn JE. Fine structure of synaptogenesis in the vertebrate central nervous system. Synapse. 1989;3:255–285. doi: 10.1002/syn.890030312. [DOI] [PubMed] [Google Scholar]
- Wahle P, Meyer G. Morphology and quantitative changes of transient NPY-ir neuronal populations during early postnatal development of the cat visual cortex. J Comp Neurol. 1987;261:165–192. doi: 10.1002/cne.902610202. [DOI] [PubMed] [Google Scholar]
- Welker C, Woolsey TA. Structure of layer IV in the somatosensory neocortex of the rat: description and comparison with the mouse. J Comp Neurol. 1974;158:437–453. doi: 10.1002/cne.901580405. [DOI] [PubMed] [Google Scholar]
- Wibrand K, Messaoudi E, Havik B, Steenslid V, Lovlie R, Steen VM, Bramham CR. Identification of genes co-upregulated with Arc during BDNF-induced long-term potentiation in adult rat dentate gyrus in vivo. Eur J Neurosci. 2006;23:1501–1511. doi: 10.1111/j.1460-9568.2006.04687.x. [DOI] [PubMed] [Google Scholar]
- Xie ZP, Poo MM. Initial events in the formation of neuromuscular synapse: rapid induction of acetylcholine release from embryonic neuron. Proc Natl Acad Sci USA. 1986;83:7069–7073. doi: 10.1073/pnas.83.18.7069. [DOI] [PMC free article] [PubMed] [Google Scholar]
Associated Data
This section collects any data citations, data availability statements, or supplementary materials included in this article.
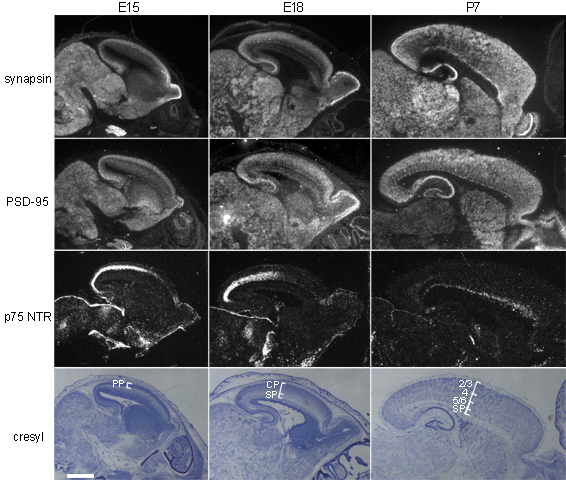