Abstract
The object selectivity of nearby cells in inferior temporal (IT) cortex is often different. To elucidate the relationship between columnar organization in IT cortex and the variability among neurons with respect to object selectivity, we used optical imaging technique to locate columnar regions (activity spots) and systematically compared object selectivity of individual neurons within and across the spots. The object selectivity of a given cell in a spot was similar to that of the averaged cellular activity within the spot. However, there was not such similarity among different spots (>600 μm apart). We suggest that each cell is characterized by 1) a cell-specific response property that cause cell-to-cell variability in object selectivity and 2) one or potentially a few numbers of response properties common across the cells within a spot, which provide the basis for columnar organization in IT cortex. Furthermore, similarity in object selectivity among cells within a randomly chosen site was lower than that for a cell in an activity spot identified by optical imaging beforehand. We suggest that the cortex may be organized in a region where neurons with similar response properties were densely clustered and a region where neurons with similar response properties were sparsely clustered.
Keywords: high-resolution fMRI, inferior temporal, intrinsic signal, local field potential, multiunit activity, object vision
Introduction
Functional imaging techniques such as intrinsic signal imaging and functional magnetic resonance imaging (fMRI) have been widely used to investigate brain functions at the systems level. These techniques allow us to simultaneously record activity widely distributed in the brain. The spatial resolution of these techniques, however, is not as high as that provided by conventional single-cell recordings. Thus, in many cases, it is implicitly assumed that response properties of cells within a minimum cluster detectable by the techniques are similar to each other. To justify these techniques as a tool to elucidate neural functions, it is essential to understand the relationship between single-cell activity and population activity in the minimum detectable cluster. In particular, the commonality of neuronal responses at the columnar level has become progressively important because the techniques have nearly reached the spatial resolution to visualize cortical columns in early sensory areas (Cheng et al. 2001; Fukuda et al. 2006) and in association cortices (Malonek et al. 1994; Wang et al. 1996, 1998; Tsunoda et al. 2001; Baker et al. 2004; Tsao et al. 2006; Yamane et al. 2006).
The existence of columnar organization is well established in primary visual cortex, area MT, and somatosensory cortex (Mountcastle 1957; Hubel and Wiesel 1962; Albright et al. 1984). In other cortical areas including association cortices, early studies also reported some tendency that neurons with similar response properties were clustered together (Gross et al. 1972; Perrett et al. 1984). For example, Gross et al. described in their paper that a cluster of successively recorded neurons in IT cortex responded similarly to visual stimuli (Gross et al. 1972). However, firm evidence for columnar organization in these cortices has not been found, and thus, columnar organization has not been fully established as a universal functional organization principle in cerebral cortices till recently.
After the early studies suggesting columnar organization in association cortices, IT cortex has been one of the target area where columnar organization was investigated systematically (Fujita et al. 1992; Tamura et al. 2005; Kreiman et al. 2006). IT cortex is essential for object recognition and is characterized by 2 types of neurons: neurons that respond to behaviorally important objects, faces, and hands and neurons that respond to visual features that are complex but still less complex than object images (Gross et al. 1972; Desimone et al. 1984; Perrett et al. 1984; Tanaka et al. 1991; Kobatake and Tanaka 1994). The first systematic examination of columnar organization in area TE, a part of IT cortex, was conducted by Fujita et al. (1992). They used a stimulus simplification technique to identify the simplest visual feature (critical features) of one cell and generated a stimulus set including optimal (critical feature), suboptimal, and inefficient stimuli for the cell (for the stimulus simplification technique, see Tanaka et al. 1991; Kobatake and Tanaka 1994). Then, they examined responses to the stimulus set for other cells along the recording track. The results revealed that the other cells also best responded to the critical feature of the first cell or the stimuli nearly the same as the critical feature if the recording track was perpendicular to the cortical surface. On the contrary, however, optimal stimuli of the cells were entirely different from the critical feature of the first cells if they were separated from the first cell by more than 0.4 mm along the track parallel to the cortical surface. These results suggested the existence of columnar organization in IT cortex with respect to “critical features,” namely, there is a common property across the cells in a columnar region, and this common property is represented by a critical feature (see Tanaka 1996 for review).
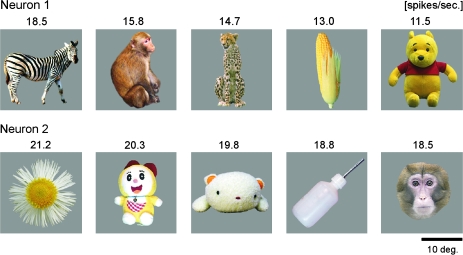
The columnar organization in IT cortex has been also examined through comparison of stimulus selectivity of nearby cells (Gochin et al. 1991; Tamura et al. 2005; Kreiman et al. 2006). For example, in recent 2 studies, stimulus selectivity of isolated cells was examined for 64 (Tamura et al. 2005) and 77 visual stimuli (Kreiman et al. 2006), and the similarity in stimulus selectivity of 2 recorded cells was quantified by calculating the correlation coefficient between their evoked responses to these stimuli. Tamura et al. reported that the median value of the correlation coefficients was 0.08 for pairs of closely located cells isolated from a single-shaft electrode with multiple recording probes. Kreiman et al. found that the mean value of correlation coefficient was 0.21 ± 0.16 for pairs of isolated neurons recorded within the same penetration tracks that were approximately aligned along the columnar axis (Kreiman et al. 2006; DiCarlo JJ, personal communication). These reports provided evidence for the columnar organization in IT cortex because the values of the correlation coefficients between cells spatially separated tangentially along the cortical surface were much lower than the values indicated above. However, the absolute values of the correlation coefficient shown above (0.08 and 0.2) are too low by themselves as convincing evidence for the columnar organization in IT cortex and seemingly contradict the previous report that suggests columnar organization in IT (see also Fig. 1). Thus, we need to explain these low values of the correlation coefficient to justify the columnar organizations in IT in addition to the relative difference in correlation coefficient values depending on the spatial relationship among the cells.
Figure 1.
A case showing that the top 5 object stimuli of 2 adjacent isolated neurons were completely different. Each row gives the top 5 visual stimuli for a neuron. For each neuron, these 5 stimuli elicited visual responses stronger than the other 95 object stimuli. The number at each picture indicates the evoked response elicited by the stimulus (spikes/s). These neurons were spaced 150 μm apart. The response similarity between these cells for 100 object stimuli, expressed as a correlation coefficient of evoked responses, was 0.22.
One possible reason for the low values of the correlation coefficient of stimulus selectivity of nearby cells is that these correlation coefficient values are underestimated by trial-to-trial variation of evoked responses. However, it does not seem to be the case. In the above study, for example, trial-to-trial variation gave 0.5 in correlation coefficients, which is much higher than the correlation coefficient value of stimulus selectivity of 2 cells (Kreiman et al. 2006). An alternative possibility is that the electrode penetrations were not exactly perpendicular to the cortical surface, and thus, the electrodes failed to go through the identical columns. This could be the case particularly when the electrodes were penetrated from the dorsal surface of the brain and traveled a long distance before reaching IT cortex.
Thus, in the present paper, we reexamined columnar organization in IT cortex. To penetrate electrodes to putative columnar regions, we exposed the cortical surface of IT cortex, used optical imaging to find candidate sites for columns, and then penetrated electrodes perpendicular to the cortical surface. Furthermore, instead of using the stimulus simplification technique (which is not an entirely objective technique), we investigated similarity in object selectivity of nearby cells. In brief, we found that each cell is characterized by 2 aspects: 1) a cell-specific response property and 2) one or potentially a few numbers of response properties common across the cells in a columnar region. In the correlation analysis of stimulus selectivity for isolated cell pairs, the cell-specific response property was emphasized, and thus, the correlation coefficient values were low. We suggest that the apparent columnar organization reported in the previous study (Fujita et al. 1992) was a result of their stimulus simplification procedure, which enables extraction of a response property that is common across the cells.
Materials and Methods
General Experimental Conditions
Three hemispheres of 3 macaque monkeys (Macaca mulatta) were used in this study. In 2 hemispheres, we conducted intrinsic signal imaging and electrophysiological recording experiments while the monkeys were under anesthesia. In the third hemisphere, we conducted only electrophysiological recordings. The experimental protocol was approved by the Experimental Animal Committee of the RIKEN Institute. All experimental procedures were performed in accordance with the guidelines of the RIKEN Institute and the National Institutes of Health.
Anesthesia
During the initial surgery to implant a head fixation post and a recording chamber, the monkeys were anesthetized with intraperitoneal injection of pentobarbital sodium (35 mg/kg at the beginning and supplemented by an additional 5 mg injected intravenously [i.v.] if necessary). During the intrinsic signal imaging and electrophysiological recording, the monkeys were paralyzed by i.v. injection of vecuronium bromide (0.067 mg/kg/h) and artificially ventilated with a mixture of N2O, O2, and isoflurane (70% N2O, 30% O2, isoflurane up to 0.5%). In order to remove pain, fentanyl citrate (0.83 μg/kg/h) was infused i.v. and continuously throughout the experiments. Electroencephalography (EEG), electrocardiogram, expired CO2 concentration, and rectal temperature were monitored throughout the experiments.
Surgical Procedures
In the initial surgery, we implanted the head fixation post and the recording chamber according to a previous study's protocol (Wang et al. 1998). A stainless steel post for the head fixation was attached to the top of the skull. After the attachment, 2 stainless steel bolts for EEG recordings were implanted through the skull above the dural surface of left and right frontal cortices. Finally, the titanium chamber (diameter 22.5 mm) was fixed to the skull at the position corresponding to the dorsal part of area TE. The center of the chamber was placed at 15.0–17.5 mm anterior to the ear bar position. Under this coordination, the anterior middle temporal sulcus was located at the lower center edge of the chamber.
After recovery from the initial surgery, the skull and dura inside the chamber were removed for intrinsic signal imaging and extracellular recording. For intrinsic signal imaging, the chamber was filled with heavy silicon oil (1000 cs) and a glass coverslip was attached to the titanium chamber. For extracellular recordings, the exposed cortex was covered with a transparent artificial dura made of silicon rubber (Arieli et al. 2002). The chamber was filled with 15 mg/ml agarose (Agarose-HGS; Nacalai Tesque, Kyoto, Japan) and covered with a plastic coverslip with a small hole. The electrodes were inserted through the hole. The surface blood vessel pattern was used as a mapping reference for the electrode penetration sites.
Visual Stimuli
Visual stimuli were presented to the eye contralateral to the recording hemisphere. We measured the optics of the eye and focused monkey's eye on a screen of a CRT monitor placed 57 cm from the eye using a contact lens. Fundus photography was taken to determine the position of the fovea.
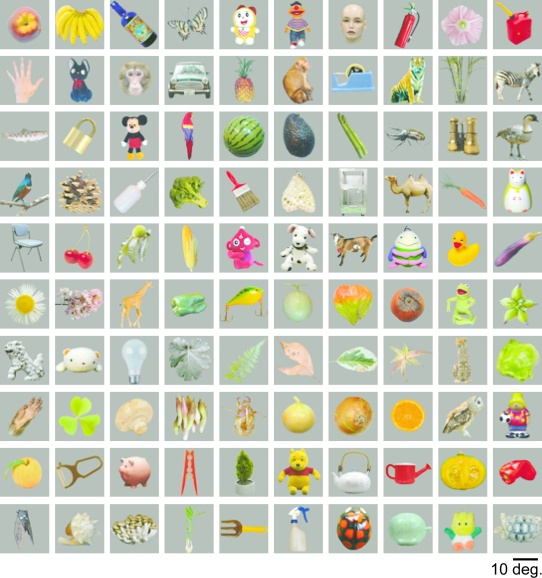
In this study, we used 100 complex object images as visual stimuli (Fig. 2). To avoid bias among these stimuli, we chose stimuli from different categories, such as fruits and vegetables, plants, tools, animals, stuffed animals, and insects. These visual stimuli were presented on the 21-inch CRT display. The stimuli were centered at the position of the fovea. During the stimulus presentation, the stimuli were moved in a circular path (with a radius of 0.4 degree at the rate of 1 cycle/s for intrinsic signal imaging and at 2 cycle/s for extracellular recordings). For intrinsic signal imaging, we used 20 of these stimuli (Fig. 2, top 2 rows) and a gray blank screen for control. For electrophysiological recordings, we recorded responses to all 100 stimuli. Thus, 20 stimuli among these 100 object images were used for both intrinsic signal imaging and extracellular recording sessions.
Figure 2.
One hundred object stimuli used for examination of object selectivity. The stimuli in the top 2 rows were also used in intrinsic signal imaging sessions.
Intrinsic Signal Imaging
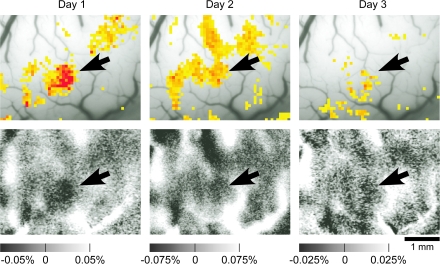
To determine electrode penetration sites for the electrophysiological recording, we investigated spatial patterns of activation induced by visual stimuli using intrinsic signal imaging for 2 monkeys. The exposed cortex was illuminated by light with a wavelength of 605 nm. The reflected light from the cortex was detected by a CCD camera (XC-7500; SONY, Toyko, Japan) through a neutral density filter optimized to the cortex (that made brightness of the cortex spatially homogeneous) and then digitized by a 10-bit video capture board (Pulsar, Matrox, Canada) and stored in a computer (for the neutral density filter, see Przybyszewski et al. 2008). The light was focused to a depth of 500 μm below the cortical surface. The imaged area was 6.4 × 4.8 mm and 320 × 240 pixels. Images of surface blood vessels were made under 540-nm light illumination before intrinsic signal imaging. We presented a visual stimulus to the monkey for 2.0 s. Video signals were acquired for 4.0 s continuously (starting from 1.0 s before the stimulus onset). Twenty stimuli and 2 blank screens were randomly presented, and each of them was repeated 32 times in 1 session. Activity spots, localized regions of activation revealed by intrinsic signal imaging, were extracted as in Tsunoda et al. (2001). The reliability of the intrinsic signal imaging results was examined by conducting the imaging session with the same stimuli on at least 2 different days, and only the activity spots that appeared consistently on these days were investigated (Fig. 3).
Figure 3.
Reproducible responses of intrinsic signals to an object stimulus. Upper panels indicate regions in which the reflection increases elicited by the stimulus were significantly greater than the increases of reflection caused by spontaneous fluctuation. The highest significance level is denoted by red and the lowest by yellow where P < 0.05 (t-test). Lower panels indicate reflection changes of the cortex elicited by visual stimulus presentation (see Tsunoda et al. 2001 for details). Horizontal scales represent percent changes in reflection. The optical responses at the first, second, and third days are represented from left to right. The arrow indicates reproducible active spots. The stimulus that elicited the activation was the upper-left object image in Figure 2.
Extracellular Recording
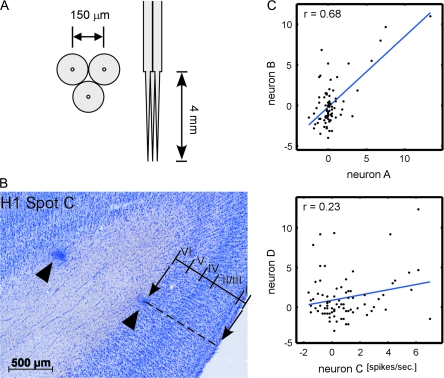
We used bundles of tungsten microelectrodes (FHC, Bowdoin, Maine; catalog# UEWLEJTMNN1E) (Fig. 4A). The shaft of 3 electrodes (diameter, 150 μm) was pasted together with glue to set the electrode-to-electrode distance approximately at 150 μm (Fig. 4A). The bundles of electrodes were inserted into the spots through the artificial dura.
Figure 4.
Analysis of the stimulus selectivity of neurons. (A) Design of a bundle of tungsten electrodes used in this study. Left and right pictures show the bottom and side view of the electrode bundle. Electrode-to-electrode distance was designed to be about 150 μm at the tip. The exact locations of the electrodes are indicated in Figure 5. (B) A histological section of the region including one spot obtained after all the extracellular recording sessions were completed. Two arrowheads indicate the sites of electrocoagulation made at the last penetration of the spot. Based on the depths of the coagulation and borders between the cortical layers, we evaluated the relationship between depth and cortical layers (see Table 1). (C) Representative scattergrams indicating similarity in object selectivity of 2 isolated neurons. In each figure, horizontal and vertical axes indicate evoked responses of 2 neurons, and each symbol in the scattergrams indicates an object image. The values of correlation coefficient in the upper and lower panels were 0.68 and 0.23, respectively. These values were statistically significant (P < 0.05, number of object images = 80).
The exposure of the cortex was essential in extracellular recording sessions for 2 reasons. First, in this way, we could visually confirm that the cortical surface was not deformed by electrode penetrations and that the penetration was perpendicular to the cortical surface. Actually, we found that the cortical surface was largely pushed down at the penetration sites with electrode tip angles of 15–20 degree and shank diameter of 120 μm. Thus, in the present study, we used electrodes with a tip angle of 5–7.5 degree and a shank diameter of 70 μm. Lack of deformation was a necessary requirement for precise alignment of depths of recordings and cortical layers as well as for reliable recordings. Second, surface blood vessel patterns were used as landmarks for penetrating electrodes multiple times at the same location.
The electrodes were penetrated perpendicular to the cortex surface. We advanced the electrodes until the first spiking activity was observed. The depth where we found the first spiking activity was set as the baseline depth (0 μm). We recorded neuronal activities for every 250-μm step of electrode advancement. At each depth, we waited for 30 min before recording extracellular activities to make sure that positions of the electrodes were stabilized. In total, 10 recording sessions were conducted for each penetration from depth 0 to 2250 μm. The recordings made below the gray matter were excluded from the analysis.
The raw electrical signals from the electrodes were amplified and band-pass filtered (filter range, 500 Hz–10 kHz). The filtered signals were digitized at 25,000 Hz and stored in a computer. The signals were recorded for 1.5 s in each trial. Visual stimulus presentation started 0.5 s after the onset of a trial and lasted for 0.5 s. The intertrial interval was 50 ms so that a blank period between 2 stimuli was 1050 ms. The different stimuli were presented in pseudorandom order, and 12 trials were made for each stimulus.
Spike Data Analysis
We extracted multiple unit activities (MUAs) and isolated single spikes from the filtered signals of each electrode. To obtain MUAs, we detected time stamps when the filtered signal exceeded a certain threshold. The magnitude of the threshold was set to 3.5 times the standard deviation (SD) of background noise. These time stamps were regarded as spikes of multiple cells (multiple units [MUs]) recorded by the electrode.
Single-cell activities were also isolated from the filtered signals by applying a template matching method to spike waveforms. The isolation was confirmed by interspike interval histograms. We rejected the cell with a particular template if the minimum interspike interval was shorter than the interval corresponding to the refractory period.
The evoked responses for each stimulus of an isolated cell and MU were calculated by subtracting the mean firing rate during the 500-ms period before the stimulus onset from the mean firing rate during the 500-ms period starting from 80 ms after the stimulus onset. The evoked responses were averaged for 12 trials.
In part of the analyses, we generated evoked responses of averaged MUs for each stimulus by averaging evoked responses of all MUs recorded from an activity spot.
Correlation Coefficient as a Measure of Similarity in Object Selectivity
We calculated the value of Pearson correlation coefficient between object responses of a single cell single-cell pair (number of objects = 80). Similarly, we calculated the correlation for MU–MU pairs, averaged MU–single cell pairs, and averaged MU–MU pairs. These values were used as a quantitative measure of similarity in stimulus selectivity of the individual pairs. For single cells and MUs, we used pairs obtained from the same depth regardless of recording days or electrodes. Figure 4(C) shows the representative scattergrams of evoked responses of isolated neurons pairs that give correlation values (r) of 0.68 (upper panel) and 0.23 (lower panel).
Histology
To correlate cortical layers and recording depth, we made electrical lesions (5 μA, 20 s) at depths of 1000 and 2250 μm in the second penetration of each spot. After all the recording sessions were completed, we deeply anesthetized the animals, administered a lethal dose of pentobarbital sodium (70 mg/kg), and perfused transcardially, in sequence, with 0.1 M phosphate-buffered saline (pH 7.4), 4% paraformaldehyde, 10%, 20%, and 30% sucrose. Brains were processed by frozen microtomy at 50-μm thickness. We made Nissl sections of the brain and correlated the depth of recordings and cortical layers (Fig. 4B and Table 1).
Table 1.
Estimation of cortical layers from the depth of recording
| Cortical layers | Subject | Depth of recording (μm) |
||
| Upper edge | Lower edge | Thickness | ||
| Layer I | H1 | −82 ± 109 | 25 ± 107 | 107 ± 21 |
| H3 | −320 ± 478 | −96 ± 503 | 194 ± 224 | |
| H2 | −642 ± 537 | −404 ± 545 | 238 ± 10 | |
| Layers II and III | H1 | 25 ± 107 | 610 ± 144 | 585 ± 103 |
| H3 | −96 ± 503 | 753 ± 502 | 841 ± 849 | |
| H2 | −404 ± 545 | 454 ± 554 | 858 ± 124 | |
| Layer IV | H1 | 610 ± 144 | 822 ± 159 | 212 ± 42 |
| H3 | 753 ± 502 | 1050 ± 489 | 259 ± 297 | |
| H2 | 454 ± 554 | 729 ± 586 | 275 ± 45 | |
| Layer V | H1 | 822 ± 159 | 1072 ± 204 | 250 ± 46 |
| H3 | 1050 ± 489 | 1382 ± 497 | 280 ± 331 | |
| H2 | 729 ± 586 | 1021 ± 573 | 292 ± 44 | |
| Layer VI | H1 | 1072 ± 204 | 1355 ± 222 | 284 ± 26 |
| H3 | 1382 ± 497 | 1693 ± 536 | 288 ± 311 | |
| H2 | 1021 ± 573 | 1309 ± 591 | 288 ± 79 | |
Note: The depth was measured from the site where the first extracellular activity was observed at each penetration site. Thus, depth = 0 does not necessarily correspond to the surface of the cortex or the border between layers I and II.
Results
Intrinsic Signal Imaging to Determine Electrode Penetration Sites
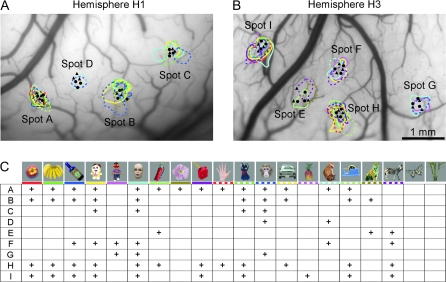
We examined 3 hemispheres (H1, H2, and H3) from 3 monkeys. In hemispheres H1 and H3, we conducted intrinsic signal imaging at the beginning to find candidate sites of columns (activity spots) by using 20 visual stimuli (Fig. 5). At least 2 of these object stimuli (Fig. 5C) activated 4 (Fig. 5A, spots A–D) and 5 activity spots (Fig. 5B, spots E–I) in hemispheres H1 and H3, respectively.
Figure 5.
Activity spots revealed by intrinsic signal imaging. (A, B) Activity spots in H1 (A) and H3 (B) were demarcated by colored contours. Penetration sites of electrodes are indicated by a filled circle (first-day penetration) and triangle (second-day penetration). (C) Optical response patterns of individual spots to 20 stimuli used in intrinsic signal imaging. Each column represents presence (cross) or absence (no symbol) of responses to the stimulus indicated on the top. Rows A–I correspond to spots A–I. The colored horizontal bar under the stimuli is to correlate a stimulus to the activity spots elicited by the stimulus in (A) and (B): The same color is used for the bar under each stimulus and for the contour of the activity spots elicited by the stimulus. Reliability of intrinsic signal imaging for an individual activity spot was assessed by calculating correlation coefficients between optical responses of the spot and averaged MUAs recorded from the spot for 20 stimuli used for intrinsic signal imaging. The resulting values of the correlation coefficient were 0.85, 0.43, 0.59, and 0.75 for spots A, B, C, and D obtained from H1 and 0.57, 0.50, 0.80, 0.29, and 0.63 for spots E, F, G, H, and I obtained from H3. Because the significant correlation coefficient value was 0.4 for 20 object images (P < 0.05), intrinsic signal imaging reliably revealed activity spots except for spot H.
A bundle of 3 electrodes was then penetrated into each spot twice on different days, and thus, we recorded 6 MUAs at each depth of each spot (Fig. 5A,B). We recorded MUAs at every 250-μm advancement in depth starting from the first MUA at the most superficial layer to the depth of the white matter where no MUA was observed. We examined the relationship between the depth of recording sites and cortical layers after extracellular recording sessions were completed for all the spots (Fig. 4B and Table 1). Spacing between electrodes at the surface of the cortex was not as accurate as it was designed to be 150 μm (Fig. 4); nevertheless, the recording sites were well situated within the spots except for spot E (Fig. 5A,B). Because the results obtained from spot E did not differ from those obtained in the other spots, we put the results from spot E together with other spots.
To examine potential biases introduced by predetermining candidate sites of columns by intrinsic signal imaging, we did not conduct intrinsic signal imaging before extracellular recording sessions in hemisphere H2. Because our method of determining electrode penetration sites was different from that for the other 2 hemispheres, we included a discussion at the end of the results obtained from this hemisphere in comparison with the results obtained from hemispheres H1 and H3.
Similarity of Single-Cell Responses to Object Images
To characterize the response properties of MUs and single cells isolated from MUs, we recorded evoked responses to 100 object images that included 20 object images used for intrinsic signal imaging. We excluded these 20 object images from the main part of the analyses to avoid biasing the results toward stimulus images used for optical imaging. Thus, unless the number of stimuli is explicitly mentioned, the results in the following sections are based on the evoked responses for 80 object stimuli that were not used in the optical imaging sessions. However, as shown below, the results did not largely depend on whether the stimulus responses to the above 20 images were included or not.
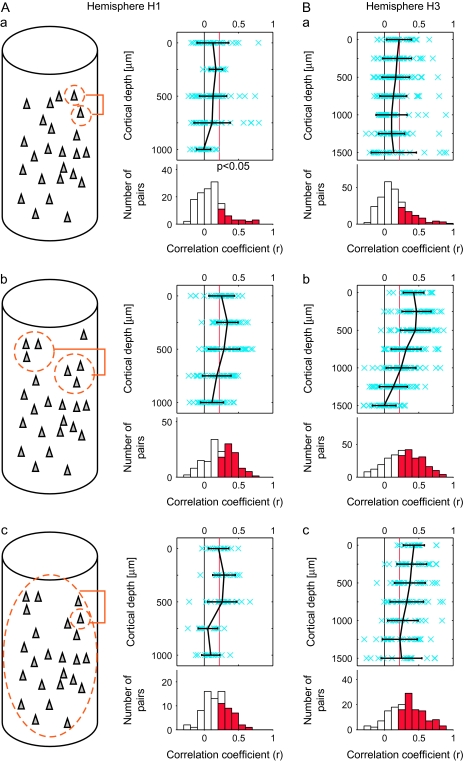
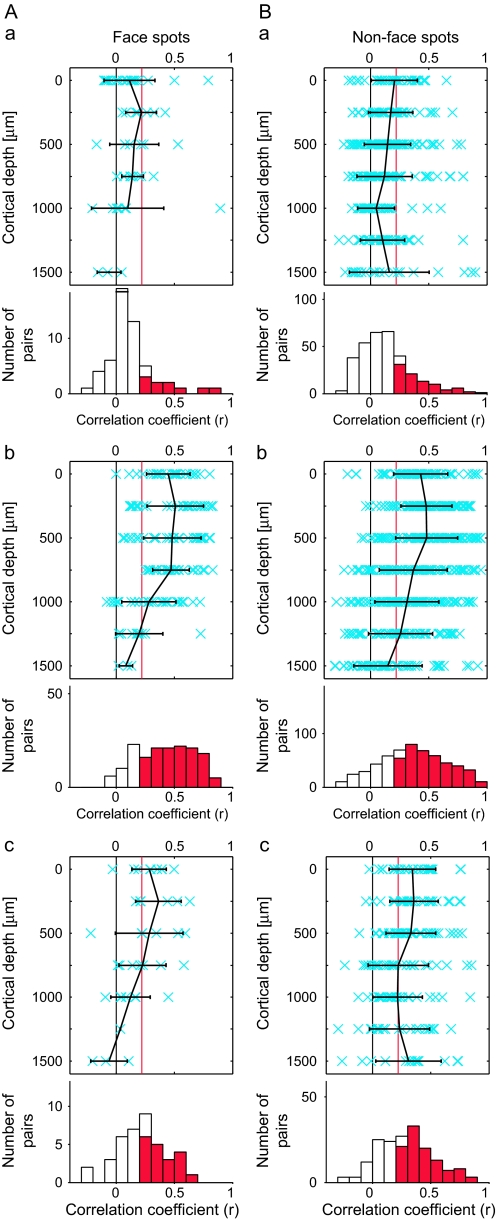
We first isolated single-cell activities from MUAs in an off-line analysis. In total, 75 and 143 cells were isolated from MUs recorded from hemispheres H1 and H3, respectively. The similarity in stimulus selectivity of 2 cells recorded at the same depth was then evaluated by calculating the correlation coefficient between evoked responses to 80 stimuli in each of the cell pairs (Figs 4C and 6Aa). In other words, we quantified the similarity of tuning curves between 2 cells for 80 stimuli by the value of the correlation coefficient. We included the pairs of isolated cells recorded on the different days in our analysis if these cells were recorded at the same depth and from the same spot. Regardless of the depth of recording, mean values of the correlation coefficient (that were below 0.22) indicate that there were no statistically significant correlations (P > 0.05) (Fig. 6Aa,Ba, upper panels). The values of the correlation coefficient for the pairs across all along the depth were only 0.11 ± 0.21 and 0.15 ± 0.22 (mean ± SD) in H1 and H3, respectively (Fig. 6Aa,Ba, lower panels). Because the evoked response to a stimulus was obtained by averaging for 12 trials, these low correlations could be due to the trial-to-trial variation of the evoked responses. We found, however, that the correlations between the evoked responses obtained by averaging half of the trials (6 trials) of one neuron and those obtained by averaging of the other half of the trials (6 trials) of the same neuron were 0.37 ± 0.26 and 0.39 ± 0.26 (mean ± SD) for H1 and H3, respectively. These values were significantly higher than the values of correlation coefficient between evoked responses obtained by 6-trial averaging of one cell and those of the other cell (0.10 ± 0.20 and 0.12 ± 0.20 for H1 and H3, respectively; t-test, P < 0.05). Thus, the low values for correlation coefficient across the cells in respect to stimulus selectivity could not be explained by the trial-to-trial variation of the responses. The proportion of single-cell pairs that had significant values of correlation across depth were only 21.2% (28/132) and 28.5% (70/246) in hemispheres H1 and H3, respectively (Fig. 6Aa,Ba, lower panels). The proportions did not significantly change when we included all 100 images (21.2% and 29.7% for H1 and H3, respectively; t-test, P < 0.027). These results indicate that the observations such as those shown in Figure 1 were not exceptional cases: effective stimuli varied among nearby cells. These results seemingly provide negative evidence for columnar organization in area TE.
Figure 6.
Similarity in stimulus selectivity between single isolated cells (Aa, Ba), MUs (Ab, Bb), and between single isolated cells and averaged MUs (Ac, Bc). (Aa, Ba) The values of correlation coefficient (r) between evoked responses to 80 object stimuli were calculated for isolated single-neuron pairs recorded at the same depth as schematically drawn in (Aa) (inset). Upper panels in (Aa) and (Bb) represent relationships between the r values (horizontal axes) and depth of the recording sites of the pairs (vertical axes). The mean (black) and the r values of individual pairs (crosses in blue) are indicated. Error bars represent SD. The red vertical line in each panel indicates the statistically significant threshold (r = 0.22, P < 0.05 for 80 stimuli). Lower histograms in (Aa) and (Ba) represent the distributions of the pairs with respect to their r values. The number of pairs was the sum across the depth. The columns indicated in red represent the number of pairs with significant correlation. The mean value of correlation coefficient (r) and the proportion of pairs with significant correlation were 0.11 and 21.2%, respectively, in (Aa) and 0.15 and 28.5%, respectively, in (Bb). (Ab, Bb) Correlation between evoked responses to 80 object stimuli were calculated as in (Aa) and (Ba) for the MU pairs recorded at the same depths as schematically drawn in (Ab, inset). Conventions in (Ab) and (Bb) are the same as (Aa) and (Ba). In the lower histograms, the mean value of correlation coefficient (r) and the proportion of pairs with significant correlation were 0.23 and 51.9%, respectively, in (Ab) and 0.28 and 60.0%, respectively, in (Bb). (Ac, Bc) Correlation coefficients were calculated between evoked responses to 80 object stimuli of isolated single neurons and those of evoked responses of averaged MUs as schematically drawn in (Ac) left. Conventions in (Ac) and (Bc) are the same as (Aa) and (Ba). In the lower histograms, the mean value of correlation coefficient (r) and the proportion of pairs with significant correlation were 0.18% and 40.0%, respectively, in (Ac) and 0.32% and 65.7%, respectively, in (Bc); (A) are the results obtained from spots A–D (H1), and (B) are from spots E–I (H3).
Similarity in MU Responses to Object Images
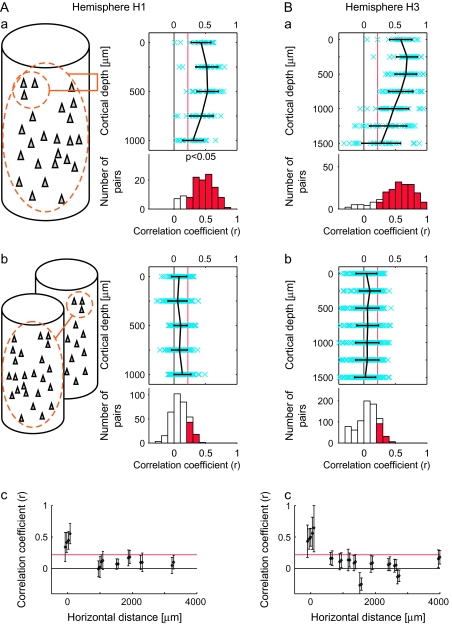
In addition to the extracellular activities of isolated cells, we analyzed MU pairs in the same way: we calculated the value of the correlation coefficient for evoked responses to the stimulus set between 2 MUs recorded from the same depth (Fig. 6Ab,Bb). Because activities of identical cells would be detected by adjacent electrodes in the electrode bundle, duplicate detection of spikes in a pair of MUs could cause overestimation of the correlation. To minimize this possibility, we only examined the pairs of MUs recorded on the different days but from the same depth. The values were 0.23 ± 0.20 and 0.28 ± 0.26 (mean ± SD) for H1 and H3, respectively; the mean values were beyond the threshold of statistical significance (r = 0.22; t-test, P < 0.05 with n = 80) except those at depths deeper than 750 μm in hemisphere H1 and 1000 μm in hemisphere H3 (Fig. 6Ab,Bb, upper panel). The proportions of MU pairs that had significant correlations (P < 0.05) calculated across the depth were 51.9% (84/162) and 60.0% (165/275) in hemispheres H1 and H3, respectively (for 100 object images, the proportions were 59.3% and 63.3% for H1 and H3, respectively [P < 0.027]) (Fig. 6Ab,Bb, lower panels). Because it was unlikely that we recorded from the same cells on different days, a critical factor resulting in higher values of the correlation coefficient compared with single-cell pairs could be that one MUA was the sum of multiple single cellular activities. In one MUA, the summation across the cells would remove the variations of cell-specific responses and extract the common property across single-cell responses (the effect of the averaging further confirmed in Appendix). Accordingly, the high correlation values among MUAs indicate that the common property extracted from one MU was similar to that extracted from the other MUs. This common property was not seen in the analysis of evoked responses of isolated single cells because cell-to-cell variability was too high.
Common Property of Each Spot Extracted by Averaging Activities of MUs
Based on the above interpretation, we characterized response properties of each spot by averaging all the MU responses recorded in the spot. We obtained a set of evoked responses of averaged MUAs by averaging evoked responses of MUs in the same spot for individual stimuli. Then, we calculated the values of the correlation coefficient for evoked responses between averaged MU and those of each isolated single cell obtained from the same spot (Fig. 6Ac,Bc). Please note that the MU that included the isolated single cell used for calculating the correlation coefficient was excluded from the averaged MU to avoid overestimation of the value of the correlation coefficient. In comparison with Figure 6(Aa,Ba) where evoked responses of 2 single cells were compared, we observed increased correlation up to 500 and 750 μm in cortical depth for hemispheres H1 and H3, respectively (Fig. 6Ac,Bc). The proportions of pairs of an averaged MU and a single cell with significant correlations across the depth were as high as 40.0% (30/75) and 65.7% (94/143) in hemispheres H1 and H3, respectively (Fig. 6Ac,Bc, lower panels). The values of correlation coefficient were 0.18 ± 0.19 and 0.32 ± 0.24 (mean ± SD) for H1 and H3, respectively. Based on the histological examination, depths of 500 μm in H1 and 750 μm in H3 approximately correspond to the lower edge of layer 4 (Table 1). These results indicate that each neuron, particularly the one in layers 1–4, shared the common property with an entire group of neurons within a spot.
The Spatial Arrangement of Clusters of Neurons with Common Response Properties
To address the question of whether or not common properties revealed by averaged MUs can be the result of columnar organization in area TE, we examined correlation for evoked responses between averaged MU and MU recorded from the same or different spots for averaged MU (see schematic drawings in Fig. 7Aa,Ab). First, the averaged MU highly correlated with MUs recorded from the same spots regardless of the depth of recording, although there was some tendency for the values of correlation coefficients to decrease with greater depth of recordings (Fig. 7Aa,Ba). The proportions of pairs of MUs and the averaged MU in a spot that had significant correlations calculated across the depth were 86.0% (98/114) and 86.2% (168/195) in hemispheres H1 and H3, respectively (for 100 object images, the proportions were 89.5% and 87.7% for H1 and H3, respectively [P < 0.027]) (Fig. 7Aa,Ba, lower panels). The values of the correlation coefficient were 0.44 ± 0.19 and 0.52 ± 0.27 (mean ± SD) for H1 and H3, respectively. In contrast, there were only a few pairs that showed significant correlation between MUs in one spot and averaged MU in the other spot, and there was no bias toward a particular depth of recording (Fig. 7Ab,Bb). The proportions of pairs of MUs and averaged MU with significant correlation across the depth were 18.1% (62/342) and 16.4% (128/780) (for 100 object images, the proportions were 21.9% and 11.8% for H1 and H3, respectively [P < 0.027]) (Fig. 7Ab,Bb, lower panels). The values of the correlation coefficient were 0.09 ± 0.13 and 0.05 ± 0.17 (mean ± SD) for H1 and H3, respectively. The minimum distances of the spot for an averaged MU and MUs in our experiments were 976 and 639 μm in H1 and H3, respectively, and the mean correlation values were already below the significance threshold (P < 0.05) at these distances (Fig. 7Ac,Bc). Thus, neurons at different depths had a common response property if they were in the same spot, but if the spots were even somewhat distant (e.g., 600 μm), the neurons did not share a common property. These results suggest that there is a columnar organization in area TE with respect to the common property in selectivity of neurons for 100 stimuli.
Figure 7.
Similarity in stimulus selectivity within a spot and across 2 spots. (Aa, Ba) The values of correlation coefficient were calculated between evoked responses to 80 object stimuli of averaged MUs and those of evoked responses of individual MUs within the same spots, as schematically drawn in (Aa) left. Please note that an MUA was excluded from the averaged MU when correlation coefficient was calculated between this MU and the averaged MU. Conventions in (Aa) and (Ba) are the same as Figure 6(Aa,Ba). (Ab, Bb) Correlation coefficients were calculated between evoked responses to 80 object stimuli of averaged MUs and those of evoked responses of individual MUs in the other spots, as schematically drawn in (Ab) left. Conventions in (Ab) and (Bb) are the same as Figure 6(Aa,Bb). (Ac, Bc) The values of the correlation coefficients shown in (Aa), (Ba), (Ab), and (Bb) are plotted against distances between spots. To distinguish values obtained from the MUs and averaged MUs of the same spots, the points were slightly displaced from distance 0. The values of correlation coefficients were averaged across the depth. The mean value and SD are plotted. The horizontal red lines indicate statistical significant levels (P < 0.05, r = 0.22). The distances were measured from the surface images and recording sites (Fig. 5A,B).
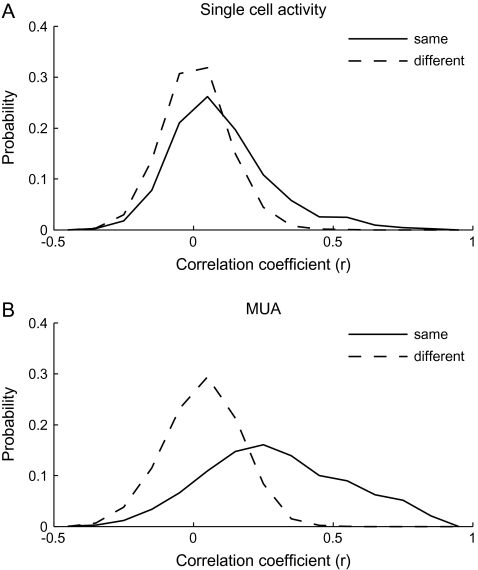
To find evidence for the columnar organization without calculating averaged MUs, we calculated the value of the correlation coefficient between the evoked responses of 2 single cells (Fig. 8A) and of 2 MUs (Fig. 8B) for those chosen from the same and different spots. On average, evoked responses of 2 single cells for 80 stimuli were not correlated irrespective of whether 2 cells were chosen from the same spots or from the different spots (Fig. 8A). Mean values of the correlation coefficient were 0.11 for the single-cell pairs from the same spots and 0.0084 for those from the different spots. Though these values were statistically significantly different (t-test, P < 0.001), the proportion of pairs that exceeded the threshold value of statistically significant correlation (r = 0.22, P < 0.05) was only 4.9% and 21.4% for pairs chosen from different and the same spots, respectively. Two MUs chosen from the different spots also showed low correlation in evoked responses. Contrary to the single-cell pairs, however, evoked responses of 2 MUs chosen from the same spots were highly correlated. Mean values of the correlation coefficient were 0.27 and 0.032 for the MU pairs from the same and different spots, respectively, and these values were statistically significantly different. Furthermore, the proportion of MU pairs that exceeded the threshold value of statistically significant correlation (r = 0.22, P < 0.05) was 55.7% for the pairs chosen from the same spots but was 8.8% for the pairs chosen from different spots. Because the common property across cells in the same spot are more emphasized in MUs than single cells, the correlation in object selectivity greatly increased from single-neuron pairs to MU pairs when these pairs were chosen from the same spots, whereas there was no difference in the values of the correlation coefficient for single-neuron pairs and MU pairs even if they were made from different spots.
Figure 8.
Demonstration that common response properties existed for the cells within an activity spot but did not for cells across the activity spots. (A) Distributions of single-neuron pairs with respect to the values of the correlation coefficients between evoked responses to 80 stimuli of the cells in each pair. The solid line represents the distribution of pairs where cells were chosen from the same spots and the dotted line represents the distribution of pairs where cells were chosen from different spots. (B) Distributions of MU pairs with respect to the values of the correlation coefficients between evoked responses to 80 stimuli of the MUs in each pair. As in (A), the solid line represents the distribution of pairs of MUs from the same spots and the dotted line represents the distribution of pairs of MUs from different spots. Please note that the constituent members of a pair were chosen regardless to the depth that they were recorded from. Thus, in contrast to Figure 6, the members of pairs do not necessarily located close to each other even they are recorded from the same spot.
Characterization of Common Properties across Cells in Activity Spots
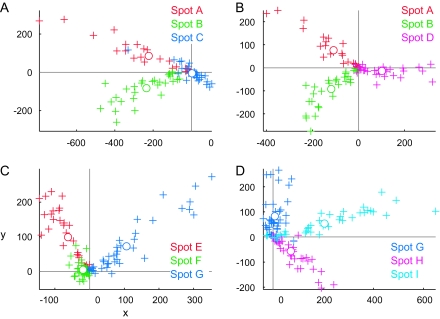
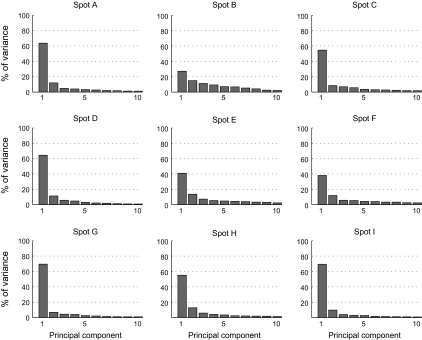
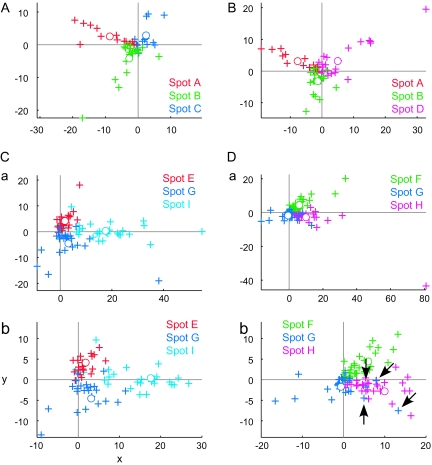
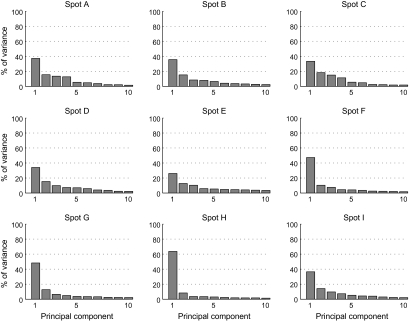
Based on the comparison of object selectivity at the levels of single cells, MUs, and averaged MUs, we have suggested the existence of a common property among the cells in activity spots. However, we have not yet addressed the question of what the common property represented by individual spots was. Though it is difficult to identify a characteristic visual feature that explains the common property only from the results of object selectivity, we attempted some characterization of the common properties of activity spots. First, in the above analyses, we implicitly assumed that each spot is characterized by a response property. Alternatively, however, each spot may consist of a few subclusters of cells. Here, we consider that neurons in each cluster have their common property but that the properties of clusters are different from cluster to cluster. Even such a case, the results of the comparison of object selectivity at the level of single cells, MUs, and averaged MUs could be explained to some extent. We addressed this possibility by investigating how responses of MUs and single cells were distributed in the stimulus space. Here, the stimulus space represents a space made of 100 dimensions each representing evoked responses of MUs (or single cells) to one of 100 object images. If each activity spot is characterized by a response property, MUs and single cells from each spot form a single cluster in the stimulus space, and clusters are well separated from spot to spot. We first examined how MUs were distributed in the stimulus space. We plotted responses of averaged MUs of the activity spots in the stimulus space and chose a 2-dimensional (2D) plane that includes the points representing averaged MUs of 3 spots (Fig. 9). In this way, we visualized distribution of MUs of all activity spots in the stimulus space with 4 figures, each of which represented MUs of 3 of the activity spots (Fig. 9). We found that MUs of different spots formed well-separated clusters in the 2D plane. The MUs of each spot were distributed along the line connecting the average MU and the origin of the stimulus space (which corresponds to the point with no responses to any of objects). Thus, at least at the scale of the axes in which different spots are well separated, we found no indication of MUs with distinct response properties in individual spots. This result is further confirmed quantitatively with the principal component analysis (PCA). We applied PCA to MUs of each spot represented in the stimulus space (Fig. 10). Except for spot B, variance of the evoked responses of MUs in a spot was well explained by the first component, and contributions of the higher components were not very different from each other. Particularly, in 5 among 9 spots, the first component explains more than 60% of total variance. Second, we conducted the analyses of single-neuron responses in the same ways as in Figures 9 and 10 and investigated distribution of single cells in the stimulus space (Figs 11 and 12) because the analyses with MUs could not exclude a possibility that each MU consists of a set of subclusters of cells each being characterized by a different response property and MUs in a spot consist of the same set of subclusters. The results showed that single-cell responses of a spot were also well clustered and the clusters of single cells were well separated from spot to spot in 7 out of 9 spots (Figs 11 and 12). For example, in the case of spots A, B, C, and D, single-cell responses of one spot were clustered together, and the clusters of 3 spots were well separated (Fig. 11A,B). However, the results also showed that the remaining 2 spots (spots I and G) may consist of subclusters of cells with different response properties. For example, 4 spot G cells (arrows) were distributed differently from other spot G cells. They are even close to the cluster of single-cell responses of spot H in the 2D stimulus space (Fig. 11Db). Thus, though evidence was weak, we cannot exclude the possibility that some spots were characterized by a few numbers of common response properties.
Figure 9.
Distribution of MUs in the stimulus space indicating that MUs of each spots are clustered together. MUs and averaged MUs of activity spots are plotted on the stimulus space, that is, 100 dimensional space in which each dimension represents responses (spikes/s) to one of the 100 object images. We chose the 2D plane that includes points representing responses of averaged MUs of 3 spots to demonstrate clustering MUs of the 3 spots in each figure. Crosses, responses of MUs projected on the 2D plane. Open circles, responses of averaged MUs. Different colors indicate different spots. (A, B) Represent MUs of the spots in hemisphere H1. (C, D) Represent MUs of the spots in hemisphere H3.
Figure 10.
Contribution of each component in PCA of MUs of each spot in the stimulus space. Each figure represents the result of the analysis applied for one of the activity spots. Horizontal axes represent rank-ordered principal components. Only first 10 components are indicated. Vertical axes represent proportion of variance explained by each principal component.
Figure 11.
Distribution of single cells in the stimulus space. Responses of single cells (crosses) and average of single cells (open circles) are plotted on the stimulus space as in the case of MUs in Figure 9.We chose the 2D plane that includes points representing responses of average of single-cell responses of 3 spots. Different colors indicate different spots. (A, B) represent single cells of the spots in hemisphere H1. (Ca, Da) represent single cells of the spots in hemisphere H3. Some cells had very large responses compared with other cells, and it is difficult to capture overall patterns of distribution; spots in hemisphere H3 were plotted in magnified view (Cb, Db) as well.
Figure 12.
Contribution of each component in PCA of single cells of each spot in the stimulus space. Conventions are the same as in Figure 10.
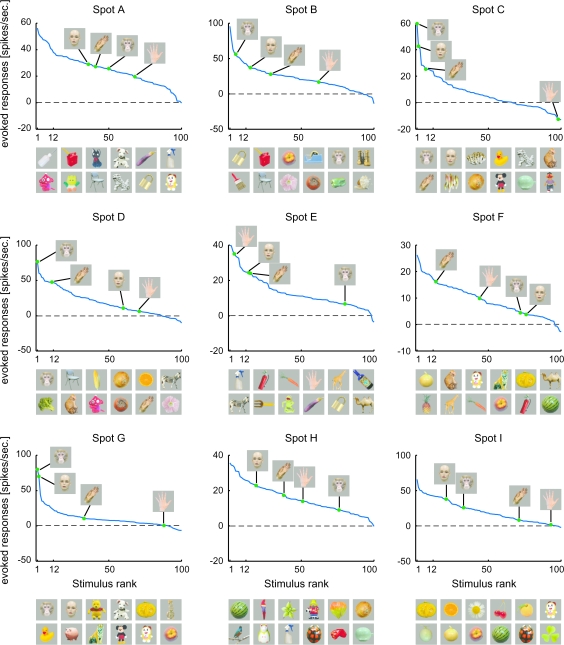
In area TE, there are neurons specifically responding to faces and hands in addition to those responding to visual features that are less complex than object images (Gross et al. 1972; Desimone et al. 1984; Perrett et al. 1984; Tanaka et al. 1991; Kobatake and Tanaka 1994). Furthermore, a recent study combining fMRI and extracellular recordings revealed that face images activated localized region in IT cortex and that faces selectively activated neurons in the region (Tsao et al. 2006). This raised another question of whether or not only the cells specific for faces and hands cluster together and form activity spots. To address this question, we investigated object selectivity of averaged MUs of the activity spots with respect to the selectivity for faces and hands (Fig. 13). Spots C and G indeed seem to be specific for faces. In these spots, the first and second best stimuli are monkey and human faces, and responses to other objects were largely different from these face stimuli. Spot D may be face selective because the best stimulus was the monkey face, but the human face was the 60th best stimulus. The other 6 spots, however, were not specifically responsive to faces and hands. None of the best stimuli for these spots were faces, and many nonface objects were included in the top 12 stimuli. Face neurons are highly selective to faces but not selective among faces with different identities (Desimone et al. 1984). Thus, these results suggest that except spots C and G, activity spots represented visual features less complex than object images. In conclusion, existence of common properties among the cells in activity spots was not specific for the activity spots representing faces or hands. Furthermore, we found no quantitative differences between spots specific for faces (spots C and G) and the other nonface spots with respect to the results of the analysis of correlation among single cells, MUs, and averaged MUs (Fig. 14).
Figure 13.
Rank-ordered stimulus responses of MUs (spikes/s) for each activity spot. Responses to faces and hands of human and monkey are indicated in each figure. The pictures below each figure represent top 12 object stimuli that are arranged in descending order from left to right. The upper row indicates the best to the 6th best images and the lower row indicates the 7th to the 12th images.
Figure 14.
Comparison between face-selective spots and the other spots for similarity in stimulus selectivity. The results for spots C and G are represented in (A), and the results for the other spots are represented in (B). The other conventions are the same as in Figure 6. In (Aa, Ba), the values of the correlation coefficient were 0.12 ± 0.21 (mean ± SD, n = 55) and 0.13 ± 0.22 (mean ± SD, n = 323), respectively. The proportions of pairs that showed significant correlation were 18.2% and 27.2% for (Aa) and (Ba), respectively. In (Ab, Bb), the values of the correlation coefficient were 0.42 ± 0.24 (mean ± SD, n = 163) and 0.37 ± 0.29 (mean ± SD, n = 567), respectively. The proportions of pairs that showed significant correlation were 76.1% and 68.4% for (Ab) and (Bb), respectively. In (Ac, Bc), the values of the correlation coefficient were 0.22 ± 0.21 (mean ± SD, n = 40) and 0.29 ± 0.23 (mean ± SD, n = 178), respectively. The proportions of pairs that showed significant correlation were 47.5% and 59.0% for (Ac) and (Bc), respectively.
Specificity of the Response Property to Activity Spots Revealed by Intrinsic Signal Imaging
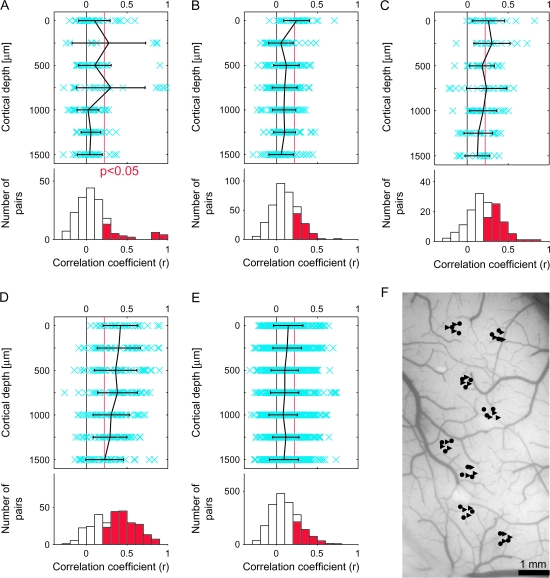
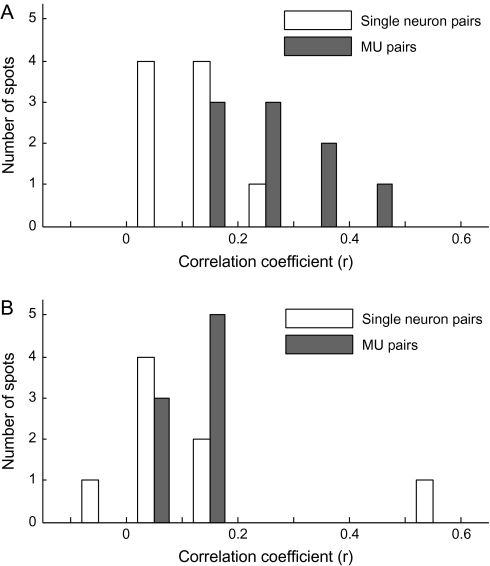
Because we recorded neuronal activities from the activity spots that were predetermined by intrinsic signal imaging, the above results may not reflect the general properties of area TE but the properties specific to the activity spots revealed by intrinsic signal imaging. We addressed this issue by recording neuronal activities from another hemisphere (H2), in which we did not conduct intrinsic signal imaging beforehand but instead randomly chose 8 sites for extracellular recording (Fig. 15F). The results of the analysis of correlation among single cells, MUs, and averaged MUs for these sites were consistent with the results for the spots identified with intrinsic signal imaging and support the idea of the columnar organization in area TE: 1) the proportion of the pairs of a single neuron and the averaged MU with significant correlation (43.1%) was higher than the proportion of single-neuron pairs with significant correlation (18.1%) (Figs. 15A,C), 2) the correlation coefficient for the pairs of a single neuron and the averaged MU (0.20 ± 0.19, mean ± SD) were higher than that for the single-neuron pairs (0.10 ± 0.24), and 3) the proportion of pairs of an MU and the averaged MU with significant correlation, both within the same site, was as high as 65.7% (Fig. 15D), but the proportion was as low as 23.7% for pairs of an MU and the averaged MU at different sites (Fig. 15E). However, we found some tendency of the correlation being lower than that obtained from cells within the spots identified by intrinsic signal imaging. In particular, the proportion of MU pairs with significant correlation (22.7%) (Fig. 15B) was almost the same as the proportion of single-neuron pairs (18.1%) (Fig. 15A). This result was not due to the property specific to subpopulation of spots (Fig. 16). For the spots identified by intrinsic signal imaging (n = 9: 4 and 5 spots from H1 and H3, respectively), the distribution of spots shifted to the right (higher in values of the correlation coefficient) when MUs were used to calculate values of correlation coefficient (Fig. 16A). On the other hand, distribution did not show such shift for the randomly chosen sites (n = 8 from H2) (Fig. 16B). Based on this result, we suggest that IT cortex is organized in the region where neurons having similar response property are densely clustered and the region where those neurons are sparsely clustered (discussed later in detail).
Figure 15.
Similarity in stimulus selectivity between single isolated cells, MUs, and between single isolated cells and averaged MUs in hemisphere H2, where recording sites were randomly chosen without the guidance of intrinsic signal imaging. (A, B, C) correspond to Figures 6(Aa,Ba), (Ab,Bb), and (Ac,Bc), respectively. Conventions are the same as in Figure 6. (D, E) correspond to Figures 7(Aa,Ba) and (Ab,Bb), respectively. Conventions are the same as in Figure 7. (F) represents recording sites from hemisphere H2. Density of recordings within individual sites, and site-to-site distances, was adjusted nearly the same as in H1 and H3.
Figure 16.
Relationship of object selectivity between single-neuron pairs and MU pairs for the spots identified by intrinsic signal imaging (A) and for the randomly chosen sites (B). The mean value of correlation coefficient (r) was calculated separately for each spot, and distribution of spots was plotted against the mean values of correlation coefficient. Total number of spots was 9 (4 spots from H1 and 5 spots from H3) for activity spots and 8 for randomly chosen sites.
Discussion
To examine the columnar organization in a cortical area, it is essential to use a set of stimuli that well characterizes functional properties of the cells in the area. However, such optimal stimulus sets are not available in many cortical areas, particularly in association cortices, and thus, firm evidence for columnar organizations is lacking in these areas. In the present study, we explored ways to examine columnar organizations in area TE without explicitly identifying the optimal stimulus set.
A general assumption is that because IT cortex is essential for object vision, evoked responses to a large number of object images should reflect functional properties of individual cells in IT cortex. On this basis, we examined selectivity of cells through their responses to 100 object images. We found that object selectivity is largely different from cell to cell, even if these cells are located in close vicinity (150 μm). However, this result does not eliminate the possibility of columnar organization in IT cortex. More importantly, we found that the selectivity of the averaged MU was similar to that of individual cells and MUs if they were recorded from the same spots (Figs 6Ac,Bc and 7Aa,Ba) but was different if cells and MUs were chosen from different spots (Fig. 7Ab,Bb). These results support the idea that a columnar organization does exist with respect to stimulus selectivity characterized by the averaged MUs.
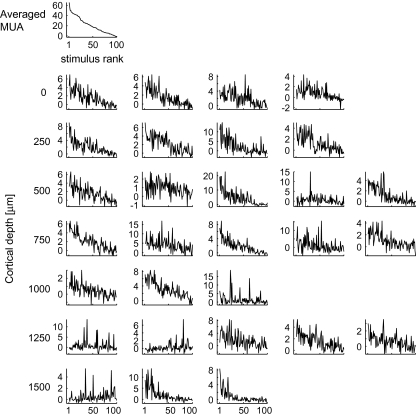
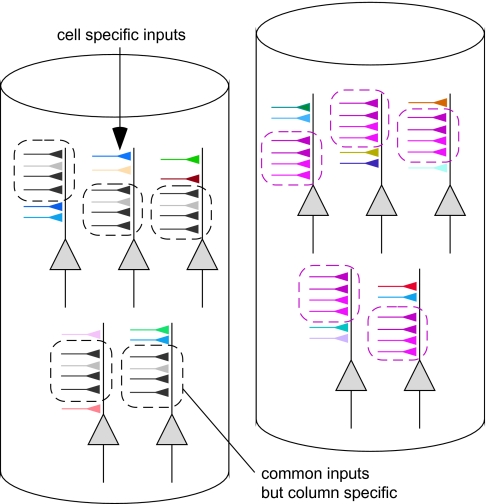
The basis of the difference between cell-to-cell and cell-to-averaged MU similarity in object selectivity is well represented in tuning curves of individual cells where cells' evoked responses to object stimuli are plotted against the object stimuli arranged in the descending order of the preferred object images of the averaged MU (Fig. 17). Because there was cell-to-cell variability in object selectivity, different neurons had different peaks in the tuning curves. In most of the neurons, however, there was a general tendency that higher evoked responses were elicited by more effective object images for averaged MUs, and lower evoked responses were elicited by less effective object images for averaged MUs. These results could be explained by assuming that each neuron receives 2 different types of inputs: one specific for each neuron and the other common across the neurons within a spot (Fig. 18). The cell-specific inputs would be involved more in cell-specific responses to the object images that appeared as cell-specific peaks in the tuning curve, and the common inputs generate the general tendency of the tuning curve to be similar to that of averaged MUs. The cell-specific peaks in the individual tuning curves were different from cell to cell and were removed by averaging the MUs. Consequently, the common properties across the cells were disclosed in the averaged MUs (see also Appendix). The present study suggests that the common properties of a spot were different from those of the other spots if these spots were spaced at least 600 μm apart (Fig. 7Ac,Bc).Although common properties across the cells remained after averaging activities of MUs, it is possible that tuning specificity was greatly reduced by averaging and the averaged activities may lose stimulus selectivity that is meaningful for object image processing. To address this possibility, we calculated the sparseness index (SI) as a measure of tuning specificity for 80 object images (Rolls and Tovee, 1995). The SI is defined as
where ri is the evoked response (spikes/s) to the ith stimulus in the set of n stimuli. It takes on a maximum value 1 if the all the stimuli activate the cell in identical evoked responses and takes 1/n if only one of n stimuli activates the cell. The SI of the evoked responses to the 80 object stimuli by single cells for H1 and H3 was, on average, 0.19 ± 0.18 (mean ± SD, n = 218). On the other hand, the SIs for MUs and averaged MUs for H1 and H3 were 0.33 ± 0.21 and 0.61 ± 0.18 (mean ± SD, n = 309 and 9 for MUs and averaged MUs, respectively). Thus, there was indeed a decrease in stimulus specificity. However, an SI of 0.6 is considered to be in the range indicating that the responses were still stimulus specific (Fig. 13; Rolls and Tovee 1995). The SIs calculated for the evoked responses of single cells, MUs, and averaged MUs in H2 were 0.17 ± 0.17 (n = 144), 0.17 ± 0.17 (n = 286), and 0.48 ± 0.20 (n = 8), respectively (mean ± SD).
Figure 17.
Tuning curves of the individual cells in a representative spot and the tuning curve of averaged MUs of the spot. The graph at the left upper corner represents the tuning curve of averaged MUs and the rests represent tuning curves of single cells at different depths. Depth of cells in each row is indicated at the left. Horizontal axes are rank ordered according to the magnitude of evoked responses of averaged MUs to the 100 object stimuli in descending order. Vertical axes represent mean firing rate (spikes/s).
Figure 18.
Schematic drawing of cell-specific inputs and inputs common among cells within a spot. Two columns are represented. The synaptic inputs demarcated by broken lines represent common inputs. These inputs are different from column to column. In this figure, the differences in common inputs for the 2 columns are indicated by the color of the inputs (left column, gray and right column, pink). Other inputs represent cell-specific synaptic inputs. We consider that these differences in synaptic inputs generate common and cell-specific response properties.
The above discussion is based on the hemispheres where extracellular activities were recorded from activity spots that were predetermined by intrinsic signal imaging, and thus, the results may not reflect general properties of area TE. Here, we considered possible biases introduced by recording from specific sites in 2 aspects. First, because the stimuli used in intrinsic signal imaging were involved in 100 object images examined for individual cells in the spots, correlation coefficients calculated for 100 object images may be biased to 20 object images used for intrinsic signal imaging. We calculated 2 values for correlation coefficients: one for 100 object images and the other for 80 object images where images used for intrinsic signal imaging were excluded. We did not find any qualitative difference in these 2 values as mentioned in the Results. Second, we considered a possibility that only part of IT cortex is organized in columns where neurons having similar response property are densely clustered, and intrinsic signal imaging extracted such columnar regions as activity spots. In hemisphere H2, where we did not conduct intrinsic signal imaging, the general tendencies of similarity among the cells were the same as those observed in the hemispheres with intrinsic signal imaging. In particular, the relationship between Figures 15(D) and (E) was consistent with the relationship between Figures 7(Aa,Ba) and (Ab,Bb), supporting the idea of columnar organization as a general functional structure in area TE. However, the values for correlation coefficients are lower than those values obtained from cells within the spots identified by intrinsic signal imaging. Specifically, similarity in object selectivity of MU pairs was almost the same as that of single-cell pairs for randomly chosen sites (Fig. 16B). There are 2 possible explanations for this difference caused by whether neuronal recordings were made from the activity spots or not. One explanation is that the recording sites were accidentally located at the border of 2 columns with different response properties. Previously, with intrinsic signal imaging, we found that activity spots elicited by similar but different stimuli tend to partially overlap each other (Wang et al. 1996, 1998), and thus, the columnar organization in area TE would be like orientation columns in area V1 where response properties gradually change along the cortical surface (Tanaka 1996). Thus, it is not likely that the recording sites were located at the border of distinct columns. Another possibility is that a part of the cortex is organized in columns, but response properties of the neurons within the columns were not as similar as the activity spots identified by intrinsic signal imaging. In intrinsic signal imaging, the optical signal is proportional to the number of cells that responded to the presented stimulus, and activity spots were the sites that revealed local maxima of the optical signals (Tsunoda et al. 2001). Because of the small size of the optical signal, the activity spots could be biased to the regions that contained a large number of neurons that shared the same response properties. Thus, the cortex may be organized in a region where neurons with similar response properties were densely clustered (highly columnar region) and a region where neurons with similar response properties were sparsely clustered (less columnar region). The result showing the difference between optically identified spots and randomly chosen sites (Fig. 16) is consistent with this idea. Taking into account that IT cortex is highly plastic even in adults and that this plasticity is essential for the memory function of this area, the less columnar region could be considered as a reserved area for future use. The idea of mosaic organization of IT cortex with highly columnar and less columnar regions is interesting, but still speculative because evidence provided by comparison between hemispheres with and without intrinsic signal imaging is indirect.
Although in an idealized model, a column with neurons of similar response properties extends from the cortical surface down to the white matter, this is not necessarily the case in real brains. In ocular dominance columns in area V1, for example, neurons exclusively responding to the visual stimulus given to one eye are found in layer 4 but not in superficial and deeper layers (Hubel and Wiesel 1972). Similarly in area TE, we found that neurons with stimulus selectivity significantly correlated with averaged MUs were more frequently found in layers above layer 4 (Fig. 6Ac,Bc). Thus, although there is a columnar spatial organization in area TE, there was some bias in superficial layers, including layer 4. In the case of area V1, critical response properties such as ocular dominance and orientation preference are primarily determined by the geniculate inputs to the area. Taking this into account, the bias to upper layers may reflect specificity of inputs to area TE from area TEO. In fact, it has been shown that area TEO projects not only to layer 4 but also to layers above layer 4 (Saleem et al. 1993).
The systematic analysis of columnar organizations in area TE was first conducted by Fujita et al. They obtained evidence suggesting columnar organization in area TE by using a stimulus simplification procedure to find the simplest visual feature for each cell (Fujita et al. 1992). It is likely that their stimulus simplification procedure led them to reach the common property across cells within a columnar region. Their stimulus simplification procedure (Tanaka et al. 1991), however, was not entirely objective, and thus, we cannot exclude the possibility that their analysis was biased. The importance of the present study is that we showed the existence of one or potentially a few numbers of common properties across the cells in a columnar region with respect to object selectivity without such procedural bias.
Funding
Brain Science Institute, RIKEN. Funding to pay the Open Access publication charges for this article was provided by Brain Science Institute, RIKEN.
Acknowledgments
We thank Dr Kazushige Tsunoda for assistance with the surgical procedures and particularly for the procedure to expose the cortical surface. We also thank Ms Kei Hagiya for assistance during surgical procedures, Mr Hideyuki Watanabe for helping us for making the analysis software, and Ms Toshiko Ikari and Mr Mark Lescroart for comments on the manuscripts. Conflict of Interest: None declared.
Appendix
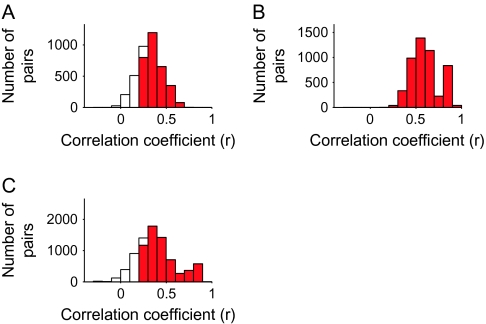
In the present paper, we regarded the activities of an MU as the sum of activities of single cells. Although activities of single cells are indeed involved in an MUA, increase of object similarity in MUs and averaged MUs may be due to potential differences in single-cell activities and MUAs other than the number of cells that are involved. Here, we arbitrarily divided isolated single cells recorded within a spot into 2 groups, A and B, and examined whether the value of the correlation coefficient between evoked responses of averaged activities of group A and those of group B was higher than the values obtained for isolated neuron pairs. To avoid the 2 groups accidentally giving a high value of the correlation coefficient, we performed a permutation analysis where isolated cells were divided into groups A and B in various ways, correlation coefficients were calculated for individual grouping, and mean values ± SD of correlation coefficients were calculated (Fig. 19). The resulting values of correlation coefficients for H1, H3, and H2 were 0.32 ± 0.14, 0.60 ± 0.15, and 0.39 ± 0.21, respectively. These values were higher than the mean value of correlation coefficients for isolated pairs of H1, H3, and H2, which were 0.11 ± 0.21, 0.15 ± 0.22, and 0.10 ± 0.24, respectively. These values were even larger than the mean value of MU pairs, which were 0.23 ± 0.20, 0.28 ± 0.26, and 0.10 ± 0.16 for H1, H2, and H3, respectively. These results support the idea that in MUs and in averaged MUs, cell-to-cell variability in object selectivity was removed and common properties were extracted.
Figure 19.
Demonstration showing increase of similarity in object selectivity by averaging activities of single cells. In each hemisphere, isolated cells were divided into 2 groups with equal number, and each group is averaged. A correlation coefficient was calculated between the evoked responses to 80 object images of these 2 averaged groups. Isolated cells were divided into 2 groups in 1000 different combinations, and resulting correlation coefficients were plotted in frequency distribution against the values of correlation coefficients. (A, B, C) were the frequency distribution obtained from hemispheres H1, H3, and H2, respectively. The mean and SD of the correlation coefficients were 0.35 ± 0.11, 0.59 ± 0.16, and 0.41 ± 0.20 for H1, H3, and H2, respectively. The column in red represents the pairs with significant correlation (P < 0.05, r = 0.22).
References
- Albright TD, Desimone R, Gross CG. Columnar organization of directionally selective cells in visual area MT of the macaque. J Neurophysiol. 1984;51:16–31. doi: 10.1152/jn.1984.51.1.16. [DOI] [PubMed] [Google Scholar]
- Arieli A, Grinvald A, Slovin H. Dural substitute for long-term imaging of cortical activity in behaving monkeys and its clinical implications. J Neurosci Methods. 2002;114:119–133. doi: 10.1016/s0165-0270(01)00507-6. [DOI] [PubMed] [Google Scholar]
- Baker C, Knouf N, Wald L, Fischl B, Kwang K, Benner T, Kanwisher N. Functional selectivity of human extrastriate visual cortex at high resolution. J Vis. 2004;4:88–88. [Google Scholar]
- Cheng K, Waggoner RA, Tanaka K. Human ocular dominance columns as revealed by high-field functional magnetic resonance imaging. Neuron. 2001;32:359–374. doi: 10.1016/s0896-6273(01)00477-9. [DOI] [PubMed] [Google Scholar]
- Desimone R, Albright TD, Gross CG, Bruce C. Stimulus-selective properties of inferior temporal neurons in the macaque. J Neurosci. 1984;4:2051–2062. doi: 10.1523/JNEUROSCI.04-08-02051.1984. [DOI] [PMC free article] [PubMed] [Google Scholar]
- Fujita I, Tanaka K, Ito M, Cheng K. Columns for visual features of objects in monkey inferotemporal cortex. Nature. 1992;360:343–346. doi: 10.1038/360343a0. [DOI] [PubMed] [Google Scholar]
- Fukuda M, Moon CH, Wang P, Kim SG. Mapping iso-orientation columns by contrast agent-enhanced functional magnetic resonance imaging: reproducibility, specificity, and evaluation by optical imaging of intrinsic signal. J Neurosci. 2006;26:11821–11832. doi: 10.1523/JNEUROSCI.3098-06.2006. [DOI] [PMC free article] [PubMed] [Google Scholar]
- Gochin PM, Miller EK, Gross CG, Gerstein GL. Functional interactions among neurons in inferior temporal cortex of the awake macaque. Exp Brain Res. 1991;84:505–516. doi: 10.1007/BF00230962. [DOI] [PubMed] [Google Scholar]
- Gross CG, Rocha-Miranda CE, Bender DB. Visual properties of neurons in inferotemporal cortex of the macaque. J Neurophysiol. 1972;35:96–111. doi: 10.1152/jn.1972.35.1.96. [DOI] [PubMed] [Google Scholar]
- Hubel DH, Wiesel TN. Receptive fields, binocular interaction and functional architecture in the cat's visual cortex. J Physiol. 1962;160:106–154. doi: 10.1113/jphysiol.1962.sp006837. [DOI] [PMC free article] [PubMed] [Google Scholar]
- Hubel DH, Wiesel TN. Laminar and columnar distribution of geniculo-cortical fibers in the macaque monkey. J Comp Neurol. 1972;146:421–450. doi: 10.1002/cne.901460402. [DOI] [PubMed] [Google Scholar]
- Kobatake E, Tanaka K. Neuronal selectivities to complex object features in the ventral visual pathway of the macaque cerebral cortex. J Neurophysiol. 1994;71:856–867. doi: 10.1152/jn.1994.71.3.856. [DOI] [PubMed] [Google Scholar]
- Kreiman G, Hung CP, Kraskov A, Quiroga RQ, Poggio T, DiCarlo JJ. Object selectivity of local field potentials and spikes in the macaque inferior temporal cortex. Neuron. 2006;49:433–445. doi: 10.1016/j.neuron.2005.12.019. [DOI] [PubMed] [Google Scholar]
- Malonek D, Tootell RB, Grinvald A. Optical imaging reveals the functional architecture of neurons processing shape and motion in owl monkey area MT. Proc R Soc Lond B Biol Sci. 1994;258:109–119. doi: 10.1098/rspb.1994.0150. [DOI] [PubMed] [Google Scholar]
- Mountcastle VB. Modality and topographic properties of single neurons of cat's somatic sensory cortex. J Neurophysiol. 1957;20:408–434. doi: 10.1152/jn.1957.20.4.408. [DOI] [PubMed] [Google Scholar]
- Perrett DI, Smith PA, Potter DD, Mistlin AJ, Head AS, Milner AD, Jeeves MA. Neurones responsive to faces in the temporal cortex: studies of functional organization, sensitivity to identity and relation to perception. Hum Neurobiol. 1984;3:197–208. [PubMed] [Google Scholar]
- Przybyszewski AW, Sato T, Fukuda M. Optical filtering removes non-homogenous illumination artifacts in optical imaging. J Neurosci Methods. 2008;168:140–145. doi: 10.1016/j.jneumeth.2007.09.006. [DOI] [PubMed] [Google Scholar]
- Rolls ET, Tovee MJ. Sparseness of the neuronal representation of stimuli in the primate temporal visual cortex. J Neurophysiol. 1995;73:713–726. doi: 10.1152/jn.1995.73.2.713. [DOI] [PubMed] [Google Scholar]
- Saleem KS, Tanaka K, Rockland KS. Specific and columnar projection from area TEO to TE in the macaque inferotemporal cortex. Cereb Cortex. 1993;3:454–464. doi: 10.1093/cercor/3.5.454. [DOI] [PubMed] [Google Scholar]
- Tamura H, Kaneko H, Fujita I. Quantitative analysis of functional clustering of neurons in the macaque inferior temporal cortex. Neurosci Res. 2005;52:311–322. doi: 10.1016/j.neures.2005.04.006. [DOI] [PubMed] [Google Scholar]
- Tanaka K. Inferotemporal cortex and object vision. Annu Rev Neurosci. 1996;19:109–139. doi: 10.1146/annurev.ne.19.030196.000545. [DOI] [PubMed] [Google Scholar]
- Tanaka K, Saito H, Fukada Y, Moriya M. Coding visual images of objects in the inferotemporal cortex of the macaque monkey. J Neurophysiol. 1991;66:170–189. doi: 10.1152/jn.1991.66.1.170. [DOI] [PubMed] [Google Scholar]
- Tsao DY, Freiwald WA, Tootell RB, Livingstone MS. A cortical region consisting entirely of face-selective cells. Science. 2006;311:670–674. doi: 10.1126/science.1119983. [DOI] [PMC free article] [PubMed] [Google Scholar]
- Tsunoda K, Yamane Y, Nishizaki M, Tanifuji M. Complex objects are represented in macaque inferotemporal cortex by the combination of feature columns. Nat Neurosci. 2001;4:832–838. doi: 10.1038/90547. [DOI] [PubMed] [Google Scholar]
- Wang G, Tanaka K, Tanifuji M. Optical imaging of functional organization in the monkey inferotemporal cortex. Science. 1996;272:1665–1668. doi: 10.1126/science.272.5268.1665. [DOI] [PubMed] [Google Scholar]
- Wang G, Tanifuji M, Tanaka K. Functional architecture in monkey inferotemporal cortex revealed by in vivo optical imaging. Neurosci Res. 1998;32:33–46. doi: 10.1016/s0168-0102(98)00062-5. [DOI] [PubMed] [Google Scholar]
- Yamane Y, Tsunoda K, Matsumoto M, Phillips AN, Tanifuji M. Representation of the spatial relationship among object parts by neurons in macaque inferotemporal cortex. J Neurophysiol. 2006;96:3147–3156. doi: 10.1152/jn.01224.2005. [DOI] [PubMed] [Google Scholar]


