

Abstract
A Vroman-like exchange of different proteins adsorbing from a concentrated mixture to the same hydrophobic adsorbent surface is shown to arise naturally from the selective pressure imposed by a fixed interfacial-concentration capacity (w/v, mg/mL) for which protein molecules compete. A size (molecular weight, MW) discrimination results because fewer large proteins are required to accumulate an interfacial w/v concentration equal to smaller proteins. Hence, the surface region becomes dominated by smaller proteins on a number-or-mole basis through a purely-physical process that is essentially unrelated to protein biochemistry. Under certain conditions, this size discrimination can be amplified by the natural variation in protein-adsorption avidity (quantified by partition coefficients P) because smaller proteins (MW <50 kDa) have been found to exhibit characteristically-higher P than larger proteins (MW >50kDa). The standard depletion method is implemented to measure protein-adsorption competition between two different test proteins (i and j) for the same hydrophobic octyl sepharose adsorbent particles. SDS-gel electrophoresis is used as a multiplexing, separation-and-quantification tool for this purpose. Identical results obtained using sequential and simultaneous competition of human immunoglobulin G (IgG, protein j) with human serum albumin (HSA, protein i) demonstrates that HSA was not irreversibly adsorbed to octyl sepharose over a broad range of competing solution concentrations. A clearly-observed exchange of HSA for IgG or fibrinogen (Fib) shows that adsorption of different proteins (i competing with j) to the same hydrophobic surface is coupled whereas adsorption among identical proteins (i or j adsorbing from purified solution) is not coupled. Interpretive theory shows that this adsorption coupling is due to competition for the fixed surface capacity. Theory is extended to hypothetical ternary mixtures using a computational experiment that illustrates the profound impact size-discrimination has on adsorption from complex mixtures such as blood.
Keywords: Protein adsorption, Vroman Effect, Multi-layers, Adsorption Reversibility
1. Introduction
One of the more intriguing aspects of protein adsorption to biomaterials is competition between two-or-more proteins for the same adsorbent surface. Nearly thirty years ago, Leo Vroman first observed that fibrinogen (Fib) preferentially adsorbed to tantalum and silicon surfaces from blood plasma, ultimately leading to the identification of a phenomenon now widely referred to as the ‘Vroman effect’ (see refs. [1-23] and citations therein). The generalized Vroman effect has proteins adsorbing from mixtures through a series of adsorption-displacement steps in which low-molecular-weight (MW) proteins arriving first at a surface are displaced by relatively higher MW proteins arriving later. Certain proteins, such as human serum albumin (HSA), are observed to be relatively resistant to displacement at hydrophobic surfaces whereas others, such as high-molecular weight kininogen, readily displaces Fib [20].
The biomaterials literature has not consistently supported universality of the Vroman effect. For example, in the late 1960’s era when the Vroman effect was a topic of intense scrutiny, Brash and Lyman [24] found little spectroscopic evidence for a Vroman effect involved in the adsorption of blood-plasma proteins to hydrophobic-polymer surfaces. Instead, Brash and Lyman observed that “…all proteins behave rather similarly on a wide variety of hydrophobic surfaces…”; as has been confirmed by an extensive survey of the adsorption energetics of purified proteins, plasma, and serum to different hydrophobic surfaces (see refs. [25-32] and citations therein). Brash and Lyman consequently proposed “…in mixtures such as blood, the proteins would be adsorbed simply in proportion to their surface collision frequency or concentrations…”; effectively arguing that there was no preferential, surface-selective adsorption of one protein over another to hydrophobic surfaces.
Over time, objections faded and the Vroman effect became biomaterials dogma, even though molecular mechanisms underlying this process have not yet been resolved [22]. Indeed, the Vroman-effect thread has been very tightly woven into the anecdotal fabric of biomaterials, explaining that different proteins adsorb differently to different surfaces [30, 31, 33], causing different biological responses to these materials when introduced into the same physiologic compartment. It is in this latter sense that the importance of a full understanding the Vroman effect cannot be overstated -- or Vroman’s perspicacity denied.
We have recently implemented the standard depletion method of measuring adsorption utilizing SDS-gel electrophoresis as a separation and quantification tool. Our principal objective has been to use this method for the study of protein-adsorption competition to materials bearing different surface chemistries and surface energies. The basic idea behind the depletion method is to measure solute (protein) concentration remaining in solution before-and-after contact with particulate materials bearing a surface chemistry of interest (hydrophobic octyl sepharose herein). Adsorbate mass is calculated by difference (mass balance). Consequently, the depletion method meets the need for unambiguous interpretation in a manner that is largely free of experimental artifacts; such as solute labeling, rinsing/drying, or complicated instrumentation. Commercial, pre-cast gels optimized for 15 or 26 ‘lanes’ permit use of several lanes for construction of a calibration curve. Remaining lanes can be used for depletion experiments. Separation by electrophoresis permits use of multiple proteins in the adsorption experiment thereby multiplexing the depletion method. We have “certified” this method by first studying adsorption of a broad range of single proteins to hydrophobic [32] surfaces (hydrophobic octyl sepharose and silanized glass) from aqueous-buffer solution, showing that results comport with thermochemically-measured free energies of adsorption and interfacial energetics measured by tensiometry (contact angle and wettability methods). Subsequently, we measured HSA adsorption to adsorbent particles with incrementally-increasing hydrophilicity [34], showing here that mass and energy balances for HSA adsorption were in full agreement. Consistent mass-and-energy balance obtained using very different analytical methods engenders confidence that this gel-electrophoresis implementation of the depletion method provides internally-consistent and accurate results; at least for proteins adsorbing to surfaces from stagnant fluids.
Herein we use depletion to measure adsorption competition to hydrophobic octyl sepharose particles from binary mixtures of HSA with IgG or Fib. We develop mass-balance equations to interpret adsorption-competition measurements. We conclude that Brash and Lyman’s idea that proteins adsorb in proportion to solution concentration was basically correct, except that mass balance mandates a discrimination against larger proteins adsorbing from a mixture of smaller-and-larger proteins. This discrimination gives rise to a Vroman-like effect unrelated to adsorption kinetics or significant differences in protein affinity for hydrophobic surfaces.
2. Methods and Materials
Proteins and Adsorbent Particles
Proteins were used as received from the vendor without further purification. Table 1 lists relevant details. Protein solutions were prepared by 80:20 or 90:10 dilution in PBS. SDS-PAGE of protein solutions yielded single bands, although IgG and Fib bands were characteristically broader than that of HSA. Octyl Sepharose™ 4 Fast Flow adsorbent (40 % by volume of 90 μm nominal diameter dispersed in 20% ethanol solution) was obtained from Amersham Biosciences. Sepharose adsorbent was freshly prepared just before each depletion experiment by 3X washing in PBS (to remove ethanol) using a sequential centrifugation/resuspension protocol (40 RPM for 1 min in a Hettick microtube fixed-rotor centrifuge, VWR) that processed 1 mL of as-received suspension (600 μL fluid, 400 μL beads). After each of 3 centrifugations, 500 μL of supernate was replaced with 500 μL PBS, ending with a 60:40 v/v stock suspension in PBS. For each depletion experiment, 50 μL stock (30 μL fluid, 20 μL beads) was pipetted into a 0.5 mL microtube from which 25 μL supernate was removed after centrifugation, leaving 5 μL PBS and 20 μL adsorbent beads (~ 65cm2 adsorbent surface area or a 97:3 adsorbent-to-tube surface area ratio). Beads were re-suspended by gentle pipette aspiration in 25 μL protein solution prepared in advance to the desired protein composition or concentration so that the final depletion volume VB = 30μL. In all depletion experiments, adsorbent settled to the bottom of the conical test tube, allowing particle-free supernate to be sampled without centrifugation.
Table 1.
Purified Proteins Used in Competitive Adsorption Experiments
| Name of Protein (acronym) | Molecular Weight (kDa) | As- received form | Packing- Volume Radius, rν (nm) | Purity (electrophoresis) or Activity | Vendor |
|---|---|---|---|---|---|
| Human serum Albumin (HSA) | 66.3 | powder | 2.72 | 96-99% | Sigma Aldrich |
| Human Immunoglobulin G (IgG) | 160 | powder | 3.65 | >95% | Sigma Aldrich |
| Human Fibrinogen (Fib) | 341 | powder | 4.69 | 80% clottable protein | Sigma Aldrich |
Depletion Measurements
Experimental details for the SDS-electrophoresis implementation of the venerable depletion method have been disclosed elsewhere [32, 34]. Briefly, protein solutions (25 μL) in phosphate-buffered-saline (PBS; Sigma; 0.14 M NaCl, 3mM KCL prepared in 18 MΩ water) at varying concentrations were mixed with a fixed amount (surface area) of washed octyl sepharose (25 μL; see below) by gentle pipette aspiration and allowed to stand undisturbed in 0.5 mL conical microtubes (Safe-lock micro centrifuge tubes, Eppendorf; approximately 2 cm2 internal surface area) for at least 1 hr before analysis. No correction was made for the small, but measurable, adsorption to tube surfaces [34] (see further Computational Methods below).
This basic depletion method was adapted for measuring protein competition from binary solutions. Two methods of binary adsorption-competition experiments were used; simultaneous and sequential competition. In simultaneous competition experiments, two proteins were mixed in solution and brought into contact with adsorbent and allowed to simultaneously engage in adsorption competition from solution. In sequential competition, one protein was allowed to adsorb from purified solution for 1 hr. before addition of the second, permitting the first protein to adsorb without influence of the second. After 1 hr. equilibration with the first protein solution, the second protein was added to the adsorbent suspension at a specified concentration. Concentration of the first protein (in the second protein solution) was adjusted so that there would be no net change in solution concentration in contact with adsorbent. Specifically, simultaneous competition brought 30 μL of a 3.3 mg/mL HSA solution containing variable concentrations of IgG into contact with adsorbent, whereupon HSA and IgG competed simultaneously for space within the interphase for 1 hour. The sequential method first brought 30 μL of a 3.3 mg/mL HSA solution (containing no IgG) into contact with adsorbent for 1 hour after which 30 μL of 1.84 mg/mL HSA containing variable IgG concentrations was added and permitted to contact adsorbent for an additional hour. Final concentrations stipulated above were chosen so that HSA solution concentration remained constant at before-and-after addition of the IgG-containing aliquot.
SDS-PAGE Electrophoresis
15 lane NuPAGE® Novex Tris-Acetate precast gels (Invitrogen Corp.; 500 kDa capacity) were used to separate and quantify proteins. Electrophoresis was carried out for 1 hour at 150 V using an XCell SureLock™ Mini-Cell (Invitrogen Corp.). Gels were stained with SimplyBlue™ SafeStain (Invitrogen Corp.) for 1 hour and destained with de-ionized (18 MΩ) water for several hours while mixing on a standard hematology rocker. Band intensity was quantified using the Gel-doc system (Bio-Rad Laboratories Inc.) that employed a highly-sensitive CCD camera to read optical density (OD). A standard curve was prepared for each protein and each gel using the first 6-7 lanes by applying solutions of known concentration of the probe protein(s). Linear calibration curves were obtained (R2 > 98%) within the concentration range for gels of all proteins (single-and multi-component solutions) listed in Table 1. Each different protein required a separate calibration curve on the same gel to account for differences in staining density.
Computational Methods
Computational and statistical methods have been disclosed in detail in ref. [32]. Briefly reiterating essential details for the purposes of this paper, amount of the ith protein adsorbed to particulate adsorbents was calculated by difference Di in protein-solution concentrations before ( ) and after ( ) adsorption to particulates (Eq. (4) of the Appendix). In the absence of particulate adsorbent, Di < 0.1 mg/mL for all proteins at surface-saturating bulk-solution concentrations and decreased in proportion to decreasing . This background adsorption, due to all sources of protein loss to tubes and pipette tips in handling procedures, represented less than 1-2% of experimental Di measured in the presence of particulate adsorbent. Thus, it was concluded that background correction of depletion measurements was unnecessary within the range explored in this work. The empirical statistical-fitting procedure to the ‘Chapman equation’ described in [32] was applied to extract the important experimental parameters and with a measure of statistical confidence. Columns 2-3 of Table 2 collect and values (for octyl sepharose) obtained in this way for the test proteins listed in column 1, along with the total number of data points(N) in the depletion curve and R2 of the Chapman fit. was computed from Eq. (4) of the Appendix where the listed error was obtained by propagation of experimental error into the final calculated value. Values for the partition coefficient Pi and interphase volume in columns 5-6 of Table 2 were taken from ref. [32].
Table 2.
Characteristic Adsorption Parameters from Depletion Experiments Using Purified Proteins
| Proteins | Octyl Sepharose Adsorbent Particles | ||||||||
|---|---|---|---|---|---|---|---|---|---|
| Name of Protein (Molecular Weight, kDa) | Pi(dimensionless) | ||||||||
| Human Serum Albumin (66.3) | 1.55 ± 0.06 (16, 0.98) | 3.39 ± 0.16 | 1.84 ± 0.17 | 162.8 ± 16.4 | 154.5 ± 28.7 | ||||
| Human Immunoglobulin G (160) | 2.84 ± 0.23 (14, 0.96) | 9.51 ± 0.83 | 6.66 ± 0.86 | 45.2 ± 5.5 | 283.0 ± 49.3 | ||||
| Human Fibrinogen (341) | 3.21 ± 0.19 (14, 0.95) | 6.30 ± 0.42 | 3.09 ± 0.46 | 97.5 ± 11.3 | 319.9 ± 75.4 | ||||
Notes: N is the number of data points used in the statistical fitting to derive parameter values, R2 is the goodness-of-fit max parameter, and uncertainty in is the standard-error-of the fit. Uncertainty in and is computed by propagation of experimental error into theoretical parameters.
3. Results
Single-Solution Depletion Curves
Fig. 1 presents “depletion curves” (solution depletion of the ith purified protein, Di , plotted against the initial bulk-solution concentration , both in mg/mL) for human serum albumin (HSA MW = 66kDa, circles) and immunoglobulin G (IgG, MW = 160kDa, inverse triangles). Depletion curves such as these were representative of a broad array of proteins tested with 15 ≤MW ≤ 341 kDa [32] and adsorbents with varying surface energy [34]. Each purified protein exhibited a linear-like depletion trend over the concentration interval that was followed by a maximal depletion at . Attainment of signaled saturation of the surface region with adsorbed protein (see Fig. 1 annotations). According to the adsorption theory applied herein (see Appendix and refs. [32, 34]), surface saturation was a property of the adsorbent but not adsorbing proteins. The surface region (interphase) had a fixed w/v concentration capacity (mg/mL) for any particular protein or mixture of proteins that was characteristic of that adsorbent type. Previous work determined that for the octyl sepharose adsorbent particles used herein [32].
Figure 1.
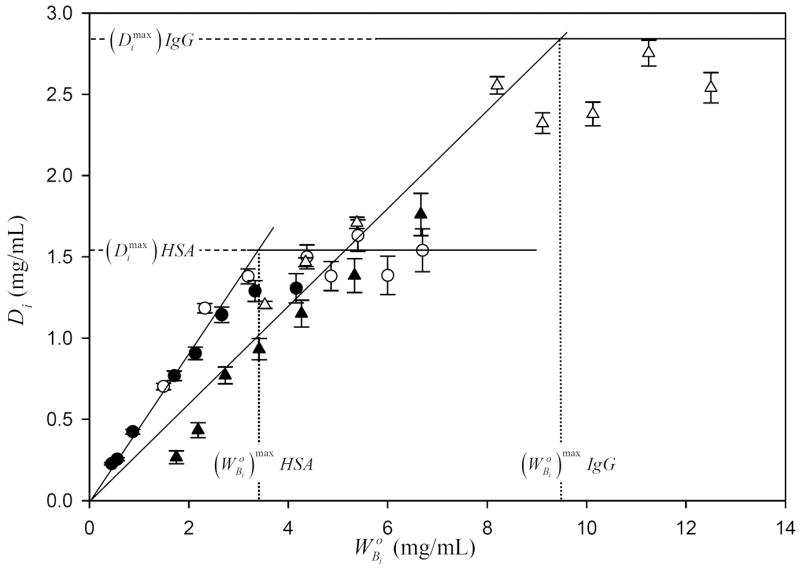
Depletion curves for purified human serum albumin (HSA, circles) and IgG (triangles) compiling data of two separate experiments (two different gels for each protein, filled and open symbols). Error bars on symbols represent estimated uncertainty calculated by propagation of error in calibration curves relating SDS gel electrophoresis band optical density to protein concentration (see Methods and Materials section and ref. [32] for more discussion of analytical methods). Dotted vertical lines mark the initial protein-solution concentration of purified HSA or IgG required to saturate the adsorbent surface. Dashed horizontal lines measure maximum depletions obtained at surface saturation of pure HSA or IgG. Parameters derived from experimental data are collected in Table 2.
Table 2 compiles and parameters for the test proteins of Table 1 along with theoretical parameters , Pi, and reported previously in ref. [32]. was simply the solution concentration remaining at surface saturation in mg/mL; the dimensionless partition coefficient measured the propensity of the protein to adsorb from solution into the adsorbent surface region (a.k.a. adsorption avidity); and was the volume of surface region (interphase) occupied by adsorbed protein (in nL). Pi and were computed from depletion-curve data as described in [32]. Single-protein depletion curves served as the standard-of-comparison for competitive-adsorption depletion curves discussed below.
Binary-Solution Depletion Curves
Four general cases for adsorption competition between two different proteins i, j with MWi ≠ MWj were identified:
Proteins i, j at bulk-solution concentrations sufficient to independently saturate the adsorbent surface.
Protein i at bulk-solution concentration sufficient to independently saturate the adsorbent surface mixed with protein j at bulk-solution concentrations insufficient to independently saturate the adsorbent surface.
Proteins i, j at bulk-solution concentrations insufficient to independently saturate the adsorbent surface but collectively sufficient to saturate the adsorbent surface.
Proteins i, j neither individually nor collectively at bulk-solution concentrations sufficient to saturate the adsorbent surface.
Cases (1) and (2) were addressed simultaneously using competitive-adsorption experiments wherein a surface-saturating concentration of protein i (determined from purified-protein depletion curves like that shown in Fig. 1) was mixed with varying concentrations of protein j, ranging from below surface-saturating concentrations to above surface-saturating concentrations (Figs. 2, 3). Cases (3) and (4) were found to be theoretically related in the sense that case (4) is a limiting condition on case (3). Case (3) was found to be difficult to experimentally arrange and was not tested herein. However, the related case (4) was addressed by mixing sub-surface-saturating concentration of proteins i, j; always maintaining the net protein concentration (i plus j) below surface saturation. Importantly, case (4) corresponds to no competition between proteins i, j because the adsorbent surface was not limiting. Case (4) thus tested the idea that proteins adsorb independently from a mixture when the surface was not saturated.
Figure 2.

Adsorption competition between HSA (protein i, circles and inverse triangles; solution concentration saturates adsorbent surface area) and IgG (protein j, squares and inverse triangles; solution concentration ). Figure compiles data of three separate Bj experiments. Open/closed circles and squares compare results of two simultaneous-competition experiments in which HSA and IgG compete from the same solution. Open/closed inverse triangles represent outcome of a sequential adsorption experiment in which HSA is first equilibrated with adsorbent which is then challenged with IgG solutions at varying concentrations (see Method and Materials section for details). Error bars on symbols represent estimated uncertainty calculated by propagation of error in calibration curves. Lines drawn through the data to guide the eye represent an interpretation of depletion experiments according to theory outlined in the Appendix. Dotted vertical lines max mark the initial concentration of purified HSA and IgG solutions required to saturate the surface. Dashed horizontal lines compare the maximum depletion obtained at surface saturation of pure HSA and IgG to maximum depletions obtained with the protein mixture ; where the i, j subscript distinguishes mixture from pure-protein solution. The relative depletions are indicated with arrow annotations, showing that competition between proteins reduces surface concentrations of both competing proteins. Note that the relative depletion for IgG is greater than that of HSA because of the discrimination against large proteins anticipated by theory. Compare to Fig. 3.
Figure 3.

Adsorption competition between HSA (protein i, circles; solution concentration saturates adsorbent surface area) and Fib (protein j, triangles; solution concentration ). Open and closed symbols compare results of two simultaneous-competition experiments in which HSA and Fib compete from the same solution. Error bars on symbols represent estimated uncertainty calculated by propagation of error in calibration curves. Lines drawn through the data to guide the eye represent an interpretation of depletion experiments according to theory outlined in max the Appendix. Dotted vertical lines mark the initial concentration of purified HSA and Fib solutions required to saturate the surface. Dashed horizontal lines compare the maximum depletion obtained at surface saturation of pure HSA and Fib to maximum depletions obtained with the protein mixture ; where the i, j subscript distinguishes mixture from pure-protein solution. The relative depletions are indicated with arrow annotations, showing that competition between proteins reduces surface concentrations of both competing proteins. Note that the relative depletion for Fib is greater than that of HSA because of the discrimination against large proteins anticipated by theory. Compare to Fig. 2.
Figs. 2 and 3 illustrate results of competitive adsorption corresponding to cases (1) and (2) above using HSA as protein i (MW = 66 kDa) and either IgG (MW = 160kDa; Fig. 2) or Fib (MW = 341 kDa; Fig. 3) as protein j. Binary-competition experiments simultaneously monitored depletion of both proteins (Di and Dj). Results plotted in Figs. 2, 3 use the same basic format as Fig. 1, except that dual ordinates track Di and Dj as a function of . In experiments of Figs. 2-3, a surface-saturating solution of HSA competed with increasing concentrations of IgG or Fib. Focusing first on Fig. 2, note that experimental data points were obtained by both simultaneous and sequential competition methods described in Methods and Materials. Results of simultaneous and sequential competition methods were identical within experimental error.
General trends in the data of Figs. 2 and 3 for IgG and Fib competition with HSA were similar for these binary mixtures in that Dj increased to a maximum consistent with Eq. (12) of the Appendix (where the i, j subscript emphasizes the mixed solution case) and Di concomitantly decreased to a minimum consistent with Eq. (13). However, adsorption competition of IgG and Fib with HSA were quite different in detail, especially in comparison to adsorption of purified proteins. Annotations on Figs. 2 and 3 emphasize these differences by indicating that the saturation depletions and were both less than and characteristic of purified proteins (Table 2), respectively, reflecting the fact adsorption competition forced i and j to share space within a mixed interphase. The relative depletion was much greater in the Fib case compared to the IgG case while, at the same time, the relative depletion for HSA was approximately the same in both cases.
Case (4) competition was explored using HSA/IgG as competing pairs. Depletion curves (not shown) demonstrated that adsorbed concentrations of IgG increased in direct proportion to whereas HSA remained nearly constant. Fig. 4 plots the ratio against the ratio in accord with Eq. (18) of the Appendix. Theory predicted a linear relationship with a slope equal to the ratio of partition coefficients and null intercept. Linear regression through the data of Fig. 4 revealed R2 = 87.2 %. This slope was statistically identical to computed from independently-obtained experimental data of Table 2 and thus provided confirmation that proteins adsorbed independently to octyl sepharose from a sub-surface-saturating mixture. However, based on the standard-error-of-the-fit quoted above, the intercept was statistically smaller than zero predicted by theory. We have no explanation for this modest discrepancy between experiment and theory, other than to note that duplicated experiments seemed to fall into two groups (see Fig. 4) and that the resulting goodness-of-fit was correspondingly poor.
Figure 4.

Linear relationship between the depletion ratio and initial-concentration ratio obtained for adsorption competition between HSA (protein i) and IgG (protein j) under the conditions that neither HSA nor IgG (i or j) individually nor collectively (i and j) saturate the surface region (case 4, Results Section). Open and closed circles represent outcome of two separate experiments. Data follows a linear trend predicted by theory.
Adsorption Competition Theory
The Appendix derives mass-balance equations for protein-adsorption competition to the same adsorbent surface from binary, ternary, and multi-component solutions. The essential feature of the underlying model was that protein reversibly adsorbed into a 3D “interphase” volume VI separating the physical adsorbent surface from the bulk-solution [26, 32, 34], where the subscript “I” denotes interphase region. This interphase was construed to have a finite, net w/v (mg/mL) capacity for protein that depended on the physical characteristics of the adsorbent surface (surface energy, area, etc.) but not the identity of adsorbing protein or proteins [23, 26, 32]. We estimated from previous studies [32] that for the octyl sepharose adsorbent particles used herein. These previous studies also showed that different proteins adsorbed to hydrophobic octyl sepharose surfaces with a characteristic avidity quantified by a partition coefficient ; where W is the w/v (mg/mL) concentration of the ith protein within interphase or bulk-solution phase, indicated by I and B subscripts, respectively.
Theory of the Appendix was developed for the four binary-adsorption cases listed above. For case (1) where competing proteins adsorbed from a concentrated solution, it was concluded that proteins competed on an equal basis independent of Pi and filled the surface region at equal interphase concentrations . In the other binary-competition cases (2-4), the natural variation in Pi was important ( for the proteins studied herein; Table 2) and, together with solution concentration, determined interphase concentrations.
A focus of theoretical attention was the mole-or-number ratio (or, equivalently, mole-or-number fraction that measured discrimination of one protein over another due to adsorption competition between proteins i, j for fixed space within the interphase. For case (1) above, Eq. (8) of the Appendix predicted that . The circumstance for cases (2) and (3) depended on MWi,j (where the i, j subscript means either i or j), relative concentrations, and Pi,j. Here, a factor xi (dimensionless) was required to measure the amount of protein i that was displaced from the interphase by the variable amount . It was found that both xi and σr could be calculated directly from experimental depletion data (Eqs. (11) and (15) in Appendix).
Another focus of theoretical attention was the interphase volume occupied by competing i, j proteins, , compared to the volume occupied by purified proteins (i or j) given by the ratio . Analytical expressions were derived that allowed calculation of quantitative values for from experimental depletion data for cases (1-4; Eqs. (9) and (14) in Appendix).
The general theoretical framework of the Appendix was extended to adsorption competition from ternary and higher-component protein solutions but not tested against experimental data. A compact formulation for σf was found for a mixture of m proteins engaged in adsorption competition for the same adsorbent surface under the relatively-simple condition that each of the m proteins were at a bulk-solution concentration capable of individually saturating the surface (Eq. (19)). This formula was used in a computational experiment for the specific case of a ternary solution (Fig. 8, see Discussion). Finally, a mass-balance equation was derived for the case of blood plasma or serum in which only four (4) of m = 490 proteins are at individually surface-saturating concentrations (HSA, IgG, transferrin, and Fib).
Figure 8.

Results of a computational experiment in which three proteins (1, 2, and 3) are in simultaneous adsorption competition, each at surface-saturating concentrations. Panel (A) plots mole % protein 2 adsorbed to a hypothetical hydrophobic surface for the cases when protein 2 is a relatively small molecule (such as HSA, MW2 = 66 kDa). Notice that the interphase composition remains effectively constant as size (MW) of proteins 1 and 3 vary from 1000 to 300 kDa but decreases dramatically as the size of 1, 3 approach that of protein 2. By contrast, protein 2 is readily displaced from the adsorbent surface if it is a relatively large protein such as IgM, MW2 = 1000 kDa as in Panel (B).
Theoretical Interpretation of Binary-Solution Depletion Curves
HSA displacement trends noted in Figs. 2,3 were quantified by computing the xi parameter discussed above using Eq. (11) of the Appendix. Guidelines drawn through the experimentally-derived data points of Fig. 5 (up to ) indicated that xi for HSA/Fib competition was much steeper than for the corresponding the HSA-IgG competition. Fig. 6 compares the mole ratio interphase composition σr as a function of for both IgG and Fib competition with HSA computed from Eq. (15) of the Appendix. Data suggested that the fractional composition of HSA in the interphase decreased sharply as either IgG or Fib adsorbed within the interphase (Eq. (15) is an inverse function in ). Data asymptotically approached the theoretical limiting values of σr = 2.4 for IgG (2.4 HSA molecules per IgG molecule) and σr = 5.1 for Fib (5.1 HSA molecules per Fib molecule) predicted by Eq. (8).
Figure 5.

Variation in xi parameter measuring the amount of HSA displaced by IgG (squares and inverse triangles) or Fib (triangles) in the competitive-adsorption experiments illustrated in Figs. 2-3, respectively. Error bars represent estimated uncertainty calculated by propagation of experimental error max into xi. Dotted vertical lines mark the initial concentration of purified HSA, IgG, and Fib solutions required to saturate the surface. Dashed horizontal line marks the point xi = 1 where solution concentration of either protein can saturate the surface and the interphase concentration . Notice that xi does not vary linearly with solution composition, especially at dilute .
Figure 6.

Dimensionless mole ratio σr of two proteins in a mixture for i = HSA and j = either IgG or Fib corresponding to competition experiments of Figs. 2-3. Error bars represent estimated uncertainty calculated by propagation of experimental error intoσr. Dotted vertical lines mark the initial max concentration of purified HSA, IgG and, Fib solutions required to saturate the surface. Notice that σr follows an inverse-like function, asymptotically approaching the annotated limits corresponding to surface-saturating concentrations of both i, j proteins predicted by theory.
Fig. 7 plots values mixed-interphase volume computed from Eq. (14) of the Appendix. Guidelines indicated interphase thickening (from for HSA; see Table 2) with increased adsorption of either IgG or Fib (annotations mark volumes occupied at surface saturation by purified proteins). The HSA/IgG mixed-interphase volume increased sharply, almost exponentially, whereas the HSA/Fib interphase rose to a constant level. The mixed interphase volume was thus computed to be larger than that of purified HSA but less than that of purified IgG and Fib.
Figure 7.

Volume of the mixed interphase as a function of bulk phase composition for i = HSA and j, either IgG (squares and inverse triangles) or Fib (triangles) corresponding to competition experiments of Figs. 2-3 (open and closed symbols refer to results from replicate experiments). Error bars represent estimated uncertainty calculated by propagation of experimental error into . Dotted vertical lines mark the initial concentration of purified HSA, IgG, Fib solutions required to saturate the surface. Dashed horizontal lines compare interphase volumes corresponding to surface-saturation concentrations of pure HSA, IgG, and Fib solutions (see Table 2). Notice that the interphase volume occupied by HSA/Fib mixtures is less volume than that of purified Fib, as anticipated by theory.
Fig. 8A,B report the result of computational experiments that used Eq. (19) of the Appendix section. In each case, three hypothetical proteins (1, 2, and 3) each at surface-saturating solution concentrations were mixed. Two of these proteins (1 and 3) had MW that could be independently varied. Fig. 8 plots mole % of protein 2 in the interphase as a function of MW protein 1 (kDa) and MW protein 3 for two different circumstances; Fig. 8A protein 2 MW = 66 kDa (representing HSA) and Fig. 8 B MW = 1000 kDa (representing immunoglobulin M (IgM)). Fig. 8A shows that protein 2 dominated the interphase on a mole % basis for a broad range of protein 1 or 3 MW. Protein 2 was displaced only when MW of competing proteins approached that of protein 2. By contrast, Fig. 8B shows that either protein 1 or 3 at lower MW readily displaced protein 2 for the circumstance when protein 2 was large with MW = 1000 kDa. Results showed that small proteins dominate the interphase composition (on a number basis) when adsorbing from concentrated mixtures comprised of smaller-and-larger proteins.
4. Discussion
Two basic categories of results are reported in this paper. The first is raw experimental data collected in the form of “depletion curves” like that shown in Figs. 1-3 that stand independent of any particular interpretive theory. The second category is experimental data interpreted in terms of mass-balance equations predicated on the basis of a protein-adsorption model asserting that proteins reversibly partition into a 3D interphase separating bulk solution from the adsorbent surface. General aspects of this model have been discussed at length in refs. [32, 34] in which it is shown that theory both anticipated and accommodated experimental adsorption data. Related theory is disclosed in the Appendix for the four cases of adsorption competition from binary solutions elaborated in the Results section. Application of theory to competition data allowed evaluation of parameters that provide insights into the how discrimination against larger proteins (a Vroman-like exchange) arises from a purely-physical process essentially unrelated to protein biochemistry. This section first qualitatively interprets protein competition in binary solutions by simple inspection of depletion curves. Theory is then used to quantify this interpretation and extended to explain how selective competition arises in multi-component mixtures such as blood.
General Comparison of Single- and Binary-Solution Depletion Curves
Depletion curves like those collected in Fig. 1 for purified solutions of HSA and IgG are similar in form to those obtained for a broad array of test proteins adsorbing to octyl sepharose and silanized-glass adsorbent particles reported previously [32, 34]. The general observation for all purified proteins studied, including those reported herein, is that depletion for the ith protein, Di, increased in direct proportion to (with slope Si) within the range , up to a maximum value occurring at after which further increase in bulk concentration does not lead to continued adsorption from solution. represents a saturation of the available adsorbent-surface region that varied systematically with protein size (as measured by MW; see ref. [32] for more discussion).
We have also noted that depletion curves, for all combinations of purified proteins and adsorbent surfaces studied to date, take the form of a simple Henry-type isotherm in that adsorbed amount increases in direct proportion to bulk-solution concentration, up to surface saturation (Fig. 1). Adherence to a Henry-type isotherm suggests that proteins adsorb to surfaces as non-interacting particles up to saturating-surface concentrations (i.e. no cooperativity among adsorbed proteins) [32, 34]. Experiments testing case (4) adsorption competition (see Results section) corroborate this observation, as discussed subsequently.
Single-protein depletion curves represented in Fig. 1 are to be contrasted to results of competitive-adsorption experiments like that shown in Figs. 2-3 in which a binary solution (i and j) of either IgG or Fib (protein j) and HSA (protein i) was brought into contact with the same adsorbent particles. It is evident by inspection of Figs. 2-3 that adsorption/desorption of competing proteins were coupled in some way, with adsorbed HSA displaced by increasing competitive pressure by IgG or Fib (increasing solution concentration). Note also that neither protein in the binary mixture achieved the characteristic of purified-protein adsorption (see figure annotations). Comparison of Figs. 2-3 shows that the effect of added Fib on HSA was similar to that of added IgG on HSA, but the collateral effect of HSA on adsorbed Fib was much greater than on IgG (as measured relative to characteristic of the purified-protein; see annotations). Thus, examination of binary-solution depletion curves of Figs. 2-3 in light of purified-protein depletion curves of Fig. 1 leads to a fundamental conclusion that competition between different protein pairs (i and j) occurs through a clearly-discernable adsorption coupling not observed among identical proteins (i adsorbing in the presence of identical i molecules). That is to say, single proteins exhibit a simple Henry-law adsorption in proportion to concentration whereas adsorption from a binary mixture exhibits a more complex isotherm. Furthermore, a comparison of Figs. 2-3 shows that the relative size of competing pairs profoundly influences the outcome of competition between two proteins.
It is of interest at this juncture to speculate on the nature of this coupling between competing proteins by first surmising that if purified-protein molecules adsorb to octyl sepharose as non-interacting particles with no cooperativity, then unrelated proteins (i.e. proteins that are not ligand pairs) likewise do not interact during the adsorption process. It follows that the observed coupling between dissimilar proteins adsorbing to the same surface must not be mediated by protein-protein or protein-surface interactions but rather arises due to a limiting resource for which proteins compete. It is quite natural to propose that this resource is space within the surface region (interphase separating bulk solution from the adsorbent surface).
Theory of the Appendix proposes that the space limitation is a maximal w/v interphase concentration that can be realized at a particular adsorbent surface for any protein or combination of proteins. Hence, is a cap on the amount of protein that can adsorb in concentration units (mg/mL), rather than the more conventional mass-per-unit-area (mg/m2) units. This idea immediately rationalizes how it happens that a larger protein (such as Fib) has a different adsorption competition outcome than an smaller protein (such as IgG) with the same competing partner (HSA): the larger protein requires fewer molecules to accumulate “its share” of the cap than the smaller protein. Importantly, this volumetric interpretation of protein-adsorption competition implies that there will be a discrimination (on a numbers or mole basis) against large proteins adsorbing from a mixture of smaller-and-larger proteins that depends mainly on protein size and not particulars of protein biochemistry, adsorption kinetics, or adsorption affinity. Theory outlined in the Appendix quantifies and expands this qualitative explanation, as further discussed subsequently.
Adsorption-competition data shown in Fig. 2 for HSA and IgG was obtained by both simultaneous-and-sequential competition methods that tested reversibility of HSA adsorption to octyl sepharose. Data of Fig. 2 shows that neither order of IgG addition nor pre-equilibration of the adsorbent with HSA for 1 hour significantly changed outcome of the adsorption competition. We interpret this to mean that HSA was not irreversibly adsorbed to the hydrophobic adsorbent surface but rather was displaced by IgG in a manner consistent with reversible adsorption. These results, taken together with depletion studies other proteins and adsorbent surfaces [32, 34] and in light of comprehensive measurement of the interfacial energetics of blood proteins spanning 3 decades of MW to two different hydrophobic surfaces [23, 25- 31], leads us to the general conclusion that irreversible adsorption is not an inherent property of proteins.
Theoretical Interpretation of Competitive Adsorption
The significant, size-related differences between HSA/IgG adsorption competition (Fig. 2) and HSA/Fib adsorption competition (Fig. 3) is consistent with the number discrimination against large proteins predicted by the theory outlined in the Appendix that causes HSA to displace much more Fib than IgG, leading to a more significant relative depletion for Fib than IgG. This size-discrimination effect is especially evident from the computed parameter xi that measures the amount of HSA displaced by adsorption competition (Eq. (11)). It is apparent from Fig. 5 that xi was a much sharper function of for HSA/Fib adsorption competition than the HSA/IgG adsorption competition.
Fig. 6 compares the mole ratio interphase composition σr as a function of for IgG and Fib adsorption competition with HSA (computed from Eq. (15) of the Appendix). Composition of HSA (expressed as a ratio) in the interphase decreases sharply as either IgG or Fib adsorbs within the interphase. Data asymptotically approaches the limiting values of σr = 2.4 for IgG (2.4 HSA molecules per IgG molecule) and σr = 5.1 for Fib (5.1 HSA molecules per Fib molecule) predicted from Eq. (8). Thus, adsorption competition between HSA and Fib leads to an interphase with about half as many Fib molecules as IgG in an otherwise identical binary competition. It is of further interest, in this regard, to examine consequences of Eq. (8) by way of a hypothetical adsorption competition between HSA (MWi = 66.3kDa) and a very large protein j the size of IgM (MWj = 1000 kDa). In this case, it is predicted that the number of HSA molecules within the interphase must exceed that of IgM by 15:1 (mole or number fraction σf = (1 + σr)-1 = 0.062 or 6.2% IgM, 93.8% HSA); to be compared to σf = 16.3% for Fib (MW = 341kDa) and σf = 29.4% for IgG (MW = 160kDa). Obviously, σr → 1 as MWj → MWi. We note further that mean-field theories of competitive-protein adsorption (random sequential adsorption with lateral diffusion of adsorbed particles) also predict that small proteins dominate the equilibrium mixture adsorbed to hydrophobic surfaces [35]. Thus, two very different theories of protein adsorption predict similar effects but for completely different reasons.
Another way to view the number-discrimination effect discussed above is that the mixed-interphase volume contains nearly twice the number of HSA molecules when j = Fib than when j = IgG. Fig. 7 plots as a function of (computed from Eq. (14) of the Appendix) showing interphase thickening (from for HSA; Table 2) with increasing adsorption of either IgG or Fib (annotations mark volumes occupied at surface saturation by purified proteins). The HSA/IgG mixed-interphase volume increased sharply, almost exponentially, suggesting that the final volume achieved at xi = 1 would exceed anticipated for IgG. By contrast, the HSA/Fib mixed-interphase volume increased more modestly with Fib concentration reaching an asymptote near 180 nL that was actually less than that of pure Fib (Table 1). These experimental outcomes are to be compared to the values calculated from Eq. (9) using experimental values (Table 2) and graphically estimated from Figs. 2, 3. For IgG, , meaning that the mixed interphase created by adsorbing both HSA and IgG from surface-saturating concentrations is predicted to be thicker than that formed by adsorbing pure IgG. This is consistent with the exponential-like rise observed for HSA/IgG of Fig. 7. By contrast, for the HSA-Fib mixed interphase, meaning that the mixed HSA/Fib interphase is thinner than that formed by adsorbing pure Fib. We interpret these outcomes to mean that only a single layer of Fib was required to fill the mixed interphase whereas two layers were required at saturating concentrations of pure Fib. Multi-layering of proteins with MW >50 kDa is consistent with previous-reported depletion results [32], interfacial energetics of protein adsorption [23, 26, 31], and interfacial rheology of blood proteins [36]. Adsorption-competition data presented herein thus supports the conclusion drawn by a number of investigators using a variety of experimental methods over the last twenty years or so [17, 26-28, 36-45] that large proteins can, in fact, adsorb from concentrated solutions in multiple layers.
Theoretical Interpretation of Depletion of Ternary Solutions
Fig. 8A, B reports the result of computational experiments using Eq. (19) of the Theory section comparing the outcome of mixing three proteins with different MW at solution concentrations of each protein above surface saturation. Results serve to further illustrate the number-basis discrimination against larger proteins discussed in the preceding section on binary mixtures. In these hypothetical experiments, the size (MW) of proteins 1 and 3 were permitted to vary between 1 ≤ MW ≤ 1000 kDa while MW of protein 2 was fixed at either 66 kDa (i.e. HSA, Fig. 8A) or 1000 kDa (i.e. IgM, Fig. 8B). Focusing first on Fig. 8A, it is apparent that the interphase was dominated by the small protein (~ 88 mole %) over a wide dynamic range of MW for proteins 1 or 3, falling off sharply only when protein 1 or 3 MW →100 kDa. These results are to be contrasted with that of Fig. 8B in which protein 2 was the large protein. In this case, either protein 1 or 3 readily displaced protein 2 as molecular size became significantly smaller than 1000 kDa. This computational experiment suggests that the surface region formed by adsorption of proteins from complex mixtures such as blood would be dominated (on a number basis) by HSA.
Theoretical Interpretation of Adsorption Competition in Protein Milieu
Biological milieu such as blood and tissue-culture media are examples of multi-component solutions in which a few proteins of the mixture dominate other proteins at substantially-lower relative concentrations. For example, in blood, HSA, IgG, transferrin, and Fib are at sufficiently high solution concentration that any one of these proteins could individually saturate an adsorbent surface whereas the other 486 (so far detected) proteins in plasma are at sub-saturating concentrations [46, 47]. Although Eq. (20) derived for this circumstance is of limited immediate experimental value because of the number of (currently unknown) parameters, it suggests an approach to semi-quantitative understanding of competitive protein solution from very complex biological milieu.
5. Conclusions
This work shows that a significant Vroman-like exchange of different proteins in adsorption competition for the same hydrophobic adsorbent arises naturally from a selective pressure imposed by a fixed interfacial-concentration capacity (maximal interphase concentration, mg/mL). A protein-size discrimination results leading to the selective adsorption of smaller proteins from a mixture of larger-and-smaller proteins. Thus, it appears that the Vroman effect is due, at least in part, to a purely-physical process unrelated to protein biochemistry or protein-adsorption kinetics. The solution-depletion method of measuring protein adsorption is a relatively straightforward method of observing results of adsorption competition among multiple proteins for the same adsorbent surface when SDS electrophoresis is used as a separation and quantification tool. Competitive-adsorption experiments show that HSA was not irreversibly adsorbed to the hydrophobic octyl sepharose adsorbent used in this work and that both IgG and Fib adsorb in multi-layers from concentrated bulk solutions.
Acknowledgments
This work was supported, in part, by the National Institute of Health PHS 1 R01 HL 69965-04, and by the Petroleum Research Fund grant #44523-AC5. Authors appreciate additional support from the Materials Research Institute and Departments of Bioengineering and Materials Science and Engineering, Penn State University.
Appendix
Mass Balance for Protein Adsorption Competition
Protein Adsorption Theory
Previous work [32, 34] developed interpretive mass balance equations for the depletion method. Mass balance was derived on the basis of a protein-adsorption model emphasizing reversible partitioning of proteins from bulk solution into a 3D ‘interphase’ volume that separates the physical adsorbent surface from bulk solution. Good agreement between experiment and theory is taken as confirmation that underlying concepts are descriptive of the controlling factors of protein adsorption. Briefly reiterating core ideas of protein adsorption theory for the purposes of this paper, the surface region is modeled as a 3D interphase with volume VI (in cm3 or mL) that separates bulk-solution from the physical surface (e.g. a particulate adsorbent). More specifically, the interphase is modeled as consisting of M integer slabs with thickness δ, the characteristic size of the protein molecule under study (in cm). The total interphase thickness (in cm) is Ω = Mδ and volume VI = AΩ = AMδ (in cm3); where A is the interfacial area (cm2) and M is an integer number of slabs that may be fully or partially filled. Protein molecules with core-protein radius rv = 6.72×10⁻⁸MW1/3 (packing- volume radius in cm for MW expressed in kDa; see refs. [48-54] for basic information regarding spherical dimensions and molecular packing of proteins) adsorb from the bulk-solution phase into this interphase region, occupying M ≥ 1, depending on protein size (MW) and solution concentration. Stated somewhat more precisely, protein partitions from the bulk phase into the interphase region, achieving a fixed concentration ratio governed by a dimensionless partition coefficient P ≡WI/WB = CI/CB; where W and C are w/v and molar concentrations in the interphase I and bulk solution B, respectively (i.e. CI ≡ nI/VI if nI is the total number of moles of protein within the interphase; WI = MW (CI) in mg/cm3).
Protein size and repulsion between molecules place an upper bound on interphase concentration. Stated another way, protein adsorption is limited by the extent to which the hydrophobic interface can be dehydrated by displacement of interfacial water with adsorbing protein [26]. Thus, the maximal possible interphase concentration is limited by interfacial energetics [26, 29, 30], not the geometry of packing hydrated spheroids, and represents an upper bound for purified proteins and protein mixtures alike. This surface-saturation idea is not too different from the ‘jamming limit’ imposed by random-sequential adsorption (RSA) theories which maximizes monolayer adsorption (2D) coverage at about 55% [35, 55, 56], except that theory embraced by this work explicitly considers adsorption in 3D with a packing efficiency ε [26] (ε ≈ 45% for the aqueous-buffer/air surface) and permits multi-layer adsorption. This view seems more consistent with the large partial-specific volume νo occupied by protein and the fact that multi-layering of protein that has been experimentally verified in a number of studies [17, 26-28, 36-45].
can also be expressed in terms of fractional interphase volume occupied by protein (dimensionless, [26]); where molar volume of the core protein (in cm3/mole) if NA is the Avogadro number. Elaboration of this model and calibration to experimental neutron-reflectivity (NR) data on HSA adsorption to the aqueous-buffer/air surface revealed that . This volume fraction happens to be consistent with packing hydrated protein molecules with an effective radius R = 1.3rv (δ = 2R) to face-centered-cubic (or hexagonal) packing densities; although any arrangement within the interphase leading to is possible. can be further quantified in the more familiar units of weight/volume (w/v) concentration by expanding the definition above explicitly in terms of rν:
| (1) |
where Eq. (1) recognizes that molar concentration is converted to w/v concentration by MW. Importantly, Eq. (1) reveals that adsorbed protein concentrations at the aqueous-buffer/air interface can be surprisingly large [57] and that interphase capacity is fixed at w/v (not molar) concentrations [26, 28]. The same phenomenology can be expected at any surface (such as the octyl sepharose employed herein) except that is potentially different for each different surface, depending at least on the nature of water-surface interactions [32, 34] and factors such as surface rugosity at the protein- molecule scale. For example, we calculate that for the octyl sepharose adsorbent particles used in this study [32].
Depletion of Single-Protein Solutions
Mass balance for depletion of single-protein solutions has also been discussed in detail in ref. [32]. Briefly for the purposes of this report, it is useful to reiterate that the equilibrium distribution of a single protein i between the bulk-solution phase and the solid-liquid interphase for any particular surface under study is given by:
| (2) |
where the limit indicated by the “max” superscript denotes surface saturation. Surface saturation occurs at the bulk-phase concentration . That is to say, increasing solution concentration above does not increase the amount of protein adsorbed because the interphase is saturated with adsorbate at .
If a solution containing the initial protein concentration is brought into contact with a particular adsorbent surface with area A, solution concentration will decrease to the equilibrium concentration stipulated by the mass balance:
| (3) |
where has been used to eliminate the unknown and VB is the volume of the bulk-solution phase. The interphase volume is well defined in terms of the molecular dimensions of a single, adsorbed protein. It is convenient at this juncture to define the observed solution depletion Di due to adsorption as the dependent experimental parameter of primary consideration:
| (4) |
and re-write Eq. (3) explicitly in terms of Di:
| (5) |
Eq. (5) anticipates the experimental observation that Di will increase in direct proportion to within the range . A plot of Di against (a.k.a. depletion curve) can be used to deduce a value for the proportionality (slope) . For the circumstance when does not significantly change over the range , as by the occupation of successive layers M for notable example, it can be anticipated that Si will be a constant. As it turns out, variation in Si with increasing M is difficult to experimentally detect [32] and Si will be effectively constant over the interval . The product is an important experimental value that can be computed from measured Si:
| (6) |
Eq. (5) also anticipates the experimental observation that the linear-adsorption trend continues up-to- max and-including surface saturation at . When the interphase becomes saturated at , no further adsorption occurs, will increase in direct proportion to , and depletion will reach a maximum value . A depletion curve can be used to graphically estimate a value for where the slope changes from Si to null at and from which can be calculated:
| (7) |
The number of layers occupied by a single protein adsorbed from solution can be computed from the relationship ; where it is assumed that fractional M values mean that the next-highest integer layer is incompletely filled (i.e. 0.75 corresponds to a single layer 75% filled, 2.3 corresponds to 3 incomplete layers, etc.). It is noteworthy that calculation of interphase volumes from experimental variables does not depend on accurate knowledge of adsorbent surface area which can be difficult to measure for certain classes of adsorbent surfaces such as for hydrogels, including the octyl sepharose surface studied herein.
Depletion of Binary-Protein Solutions at Surface Saturation - Two Surface-Saturating Proteins
If two different proteins i and j mixed in solution are brought in contact with an adsorbent surface, the interphase will be comprised of both i and j as a result of competitive adsorption. Consider first a binary solution comprised of proteins i, j with different molecular weights (MWi ≠ MWj), each at a bulk w/v concentration equal or exceeding the initial purified-protein concentrations (where the i, j subscript denotes either protein i or j) so that interphase saturation is assured by the independent presence of either i or j (Case 1 of the Results Section). The surface region must then accommodate contributions from i and j such that the summed-weight concentrations equal the fixed interphase capacity [23] [32] (for octyl sepharose adsorbent). The concentrations of i and j in the interphase must be equal because (by definition). That is to say, even if one of the competing pairs has a higher-adsorption affinity (i.e. Pi > Pj or Pj > Pi), the solution concentration of the lower-adsorption-affinity protein (lower partition coefficient) compensates in such a way that neither protein is disadvantaged relative to the other. As a result, for the particular case under consideration, . Notably, the w/v concentration of either protein adsorbed from the binary solution is half that adsorbed from a single-protein solution (interphase is a 50:50 w/v mixture) regardless of bulk-solution concentrations so long as .
Equal interphase w/v concentrations necessarily means that the interphase is not comprised of equal numbers of i and j molecules because MWi ≠ MWj. Hence, competitive-protein adsorption leads to a kind of specificity in protein number that favors the lower MW (smaller) protein. For the case when i and j compete from solution concentrations sufficient to independently saturate the surface, the mole-or- number ratio σr is given by:
| (8) |
The mixed-component interphase volume (where the i, j subscript emphasizes that the interphase consists of two proteins) is not well defined in terms of M and Ω, as in the single-protein case discussed above, because the interphase is occupied by two different-size molecules. However, as mentioned in the preceding section, does not depend on either protein size or composition because this upper bound is fixed by the energetics of interphase dehydration, not the geometry of packing mixed-size spheroids (which would indeed be a much more complicated problem to deal with; see for example ref. [58] for more discussion). It is of interest to compare for the protein mixture to that of the purified protein (where the j subscript emphasizes a single protein) for the condition when the interphase is saturated with either mixture or purified protein, respectively. When the jth protein is in pure solution, the maximum depletion is . However, according to the discussion above, the depletion is reduced to for the surface-saturating, binary-mixture case under consideration.
Thus, the ratio of mixed-to-pure interphase volumes is:
| (9) |
is a very interesting parameter that gives insights into molecular packing in a mixed interphase which can be estimated from experimental depletion measurements using Eq. (9).
Depletion of Binary-Protein Solutions - One Surface-Saturating Protein
Consider now the situation when the ith protein in a binary solution held at is mixed with varying concentrations of protein j, up-to-and-exceeding (Cases 2 and 3, Results Section). Competitive-protein adsorption will force the surface initially saturated with protein i (when ) to become increasingly populated with protein j as bulk-solution concentration of j increases. Pursuing logic of the preceding section, the model asserts that competitive pressure of j displaces some portion of i, depending on i, j adsorption affinities (relative magnitudes of Pi,j) and j solution concentration . That is, the interphase will become populated with both proteins i and j, following the mass balance equation:
| (10) |
where the factor xi (dimensionless) determines the amount of i that must be displaced from the interphase by the variable amount . Boundary values on xi can be readily evaluated as follows. When (100% protein i), xi = 2 so that , in conformity with the definition of Pi. When , xi = 1, so that the interphase will be comprised of 50% w/v protein i and j, to comport with the discussion of the preceding section. Between these boundaries on , the amount of protein i remaining in the interphase is proportional to through the following mass balance:
| (11) |
where the definition of depletion from Eq. (4) has been used to write xi explicitly in terms of Dj. It is useful to solve Eq. (11) for Dj using the identity to arrive at an equation that can be conveniently compared to experiment:
| (12) |
Eq. (12) suggests that Dj will not vary in a strictly linear fashion with because of the dependence on xi which, in turn, depends on MWi,j because of the number-discrimination effect discussed above.
Depletion of protein i can be immediately identified from Eq. (10) as , or:
| (13) |
where the factor 150 reminds that the adsorbent in question is octyl sepharose with . Volume of the mixed interphase can be obtained from Eq. (13) using Eq. (12) to eliminate the unknown xi:
| (14) |
computed from Eq. (14) can be compared with the volume occupied by any single protein determined from single-protein depletion studies such as those described in refs. [32, 34].
The general expression for σr is not the simple ratio of MW discussed in the case when both proteins saturate the surface but instead depends on the amount of j added to the solution:
| (15) |
Eq. (15) uses the identity that follows directly from Eq. (10), eliminates xi by substitution of Eq. (11), and applies Eq. (4) to write σr explicitly in terms of Dj.
Depletion of Binary-Protein Solutions - Two Proteins at Sub-saturating Concentrations
Two other conditions for adsorption from a binary solution merit consideration (Case 3 and 4 of the Results section). If neither i nor j individually exceed or , respectively, but i and j collectively saturate the interphase, then each protein competes for space in a manner controlled by Pi,j and , constrained only by the fact that the surface region is saturated. Pursuing logic of the preceding cases, the model asserts that some unknown portion of the full possible contribution will be expressed at the interphase, depending on i, j adsorption affinities (relative magnitudes of Pi,j) and i, j solution concentrations. That is, the interphase will become populated with both proteins i and j, following the mass balance equation:
| (16) |
where the factors xi and xj (dimensionless) determine the amount that can be expressed as a result of adsorption competition. At best, Eq. (16) is one equation with two unknown factors for which boundary conditions on xi and xj are not readily apparent. Therefore, Eq. (16) appears not to be solvable using procedures established for the preceding case. However, it proves useful to use Eq. (3) as a guide to writing the following depletion equations:
| (17) |
because it becomes evident from Eq. (17) that the ratio can be approximately evaluated from experimentally-accessible parameters:
| (18) |
The approximation of Eq. (18) makes use of the fact that the natural variation in protein partition coefficients is modest [32] and that the products are about 10-fold smaller than VB. In principle, then, Eq. (18) can be checked against experiment if the partition coefficients for competing proteins i, j are known. As a matter of practice, however, case 3 of the Results section is difficult to experimentally arrange over widely-varying protein concentrations and approximate estimates for partition coefficients (or ratios) are available only for a few proteins at this writing. However, case 4 of the Results Section in which proteins neither individually nor collectively saturate the surface is amenable to experiment. In this special case, the surface is not saturated and does not impose any selective pressure so that xi,j = 1 (proteins adsorb independently with no mutual interaction). Application of Eq. (18) to this case reveals that a plot of against the ratio will be linear with a slope equal to .
Depletion of Multi-Component Protein Solutions at Surface Saturation
If a solution containing m proteins comes in contact with an adsorbent surface, the interphase will be comprised of all m proteins as a result of competitive adsorption among the m proteins. Each protein will achieve an equilibrium interphase concentration that depends on the bulk-solution concentration and the characteristic partition coefficient for that protein Pm. If the surface is saturated by the m proteins, the summed weight concentrations equals the fixed interphase capacity [23] of 300 mg/mL or, in other words, .
In the specific event that each of the m proteins is at a bulk-solution concentration individually capable of saturating the surface, it can be concluded that [23]. Notably, the interphase w/v concentration of any protein adsorbed from the mixed solution is 1/mth that adsorbed from any single-protein solution at bulk concentration ; where the i…m subscript means any one of the m proteins. It follows then that , for which the m subscript in reminds that the interphase volume depends on the exact composition of the multi-component solution. Hence, the effect of competitive adsorption with m proteins on any particular protein is equivalent to the dilution effect of raising solution volume to mVB. Following the logic presented in the preceding section for two proteins i, j both at surface-saturating concentrations, the mole or number fraction (not ratio) of the jth protein of the m-component solution is found to be:
| (19) |
where all indices run from 1 to m. The rather exotic-appearing term on the R.H.S. emphasizes that depends on the product of molecular weights in a mixture in such a way that severely discriminates against high MW proteins in a mixture of low MW proteins, on an absolute numbers basis.
Depletion of Multi-Component Protein Solutions at Sub-Surface Saturation
Another notable multi-component case is the circumstance when a few proteins of a mixture individually at-or-above surface-saturating concentrations dominate a mixture of many a other proteins at individually sub-saturating concentrations. This situation is pertinent to blood plasma or serum in which the proteins HSA, IgG, transferrin, and Fib are at sufficiently high solution concentration that any one can individually saturate a surface (not including the possibility of hemoglobin contamination). Approximately 486 other (so far detected) proteins in plasma are at sub-saturating concentrations [46, 47]. For this case, l (4) of m (490) proteins at individually surface-saturating concentrations is mixed with (m–l) proteins, no one of which is capable of individually saturating the surface. The analog of Eq. (10) for this case reads:
| (20) |
where has the same general meaning as xi in Eq. (11) where the subscript m is a reminder that has a complex relationship with concentrations of the other (m–1)proteins participating in the mass balance. Needless to say, depletion formulary for such heterogeneous protein mixtures contain more unknown parameters than known and are thus of limited exact experimental value.
Footnotes
Publisher's Disclaimer: This is a PDF file of an unedited manuscript that has been accepted for publication. As a service to our customers we are providing this early version of the manuscript. The manuscript will undergo copyediting, typesetting, and review of the resulting proof before it is published in its final citable form. Please note that during the production process errors may be discovered which could affect the content, and all legal disclaimers that apply to the journal pertain.
Citations
- 1.Brash J, Lyman D. Adsorption of Proteins and Lipids to Nonbiological Surfaces. In: Brash JL, editor. The Chemistry of Biosurfaces. new York: Marcel Dekker; 1971. pp. 177–222. [Google Scholar]
- 2.Vroman L. What Factors Determine Thrombogenicity? Bull N Y Acad Med. 1972;48:302–10. [PMC free article] [PubMed] [Google Scholar]
- 3.Vroman L, Adams AL, Klings M, Fischer G. Fibrinogen, Globulins, albumins, and Plasma at Interfaces. Applied Chemistry at Protein Interfaces; A Symposium at the 166th Meeting of the American Chemical Society; Washington, DC. American Chemical Society; 1975. pp. 255–?. [Google Scholar]
- 4.Cooper SL, Peppas NA, Hoffman AS, Ratner BD, editors. Protein Adsorption on Biomaterials. Washington D. C.: Am. Chem. Soc.; 1982. [Google Scholar]
- 5.Horbett T. Protein Adsorption on Biomaterials. In: Cooper SL, Peppas NA, Hoffman AS, Ratner BD, editors. Biomaterials: Interfacial Phenomena and Applications. Washington D. C.: Am. Chem. Soc.; 1982. pp. 234–43. [Google Scholar]
- 6.Brash J, Hove Pt. Effect of Plasma Dilution on Adsorption of Fibrinogen to Solid Surfaces. Thromb Haemostas. 1984;51:326–30. [PubMed] [Google Scholar]
- 7.Lensen HGW, Bargman D, Bergveld P, Smolders CA, Feijen J. High-performance Liquid Chromatography as a Technique to Measure the Competitive Adsorption of Plasma Proteins onto Lattices. J Colloid and Interface Sci. 1984;99(1):1–8. [Google Scholar]
- 8.Vroman L, Adams A. Adsorption of Proteins Out of Plasma and Solutions in Narrow Spaces. J Colloid and Interface Sci. 1986;111(2):391–402. [Google Scholar]
- 9.Wojciechowski P, Hove PT, Brash JL. Phenomenology and Mechanism of the Transient adsorption of Fibrinogen from Plasma (Vroman Effect) J Colloid and Interface Sci. 1986;111(2):455–65. [Google Scholar]
- 10.Elwing H, Askendal A, Lundstrom I. Competition Between Adsorbed Fibrinogen and High-molecular-weight Kininogen on Solid Surfaces Incubated in Human Plasma (the Vroman Effect): Influence of Solid Surface Wettability. J Biomed Mat Res. 1987;21:1023–8. doi: 10.1002/jbm.820210808. [DOI] [PubMed] [Google Scholar]
- 11.Shirahama H, Lyklema J, Norde W. Comparative Protein Adsorption in Model Systems. J Colloid and Interface Sci. 1990;139:177–87. [Google Scholar]
- 12.Leonard EF, Vroman L. Is the Vroman Effect of Importance in the Interaction of Blood with Artificial Materials. J Biomaterial Sci Polym ed. 1991;3(1):95–107. doi: 10.1163/156856292x00105. [DOI] [PubMed] [Google Scholar]
- 13.Wahlgren M, Arnebrant T. Protein Adsorption to Solid Surfaces. Tibtech. 1991;9:201–8. doi: 10.1016/0167-7799(91)90064-o. [DOI] [PubMed] [Google Scholar]
- 14.Wojciechowski P, Brash JL. The Vroman Effect in Tube Geometry: The Influence of Flow on Protein Adsorption Measurements. J Biomater Sci Polymer Edn. 1991;2(3):203–16. doi: 10.1080/09205063.1991.9756660. [DOI] [PubMed] [Google Scholar]
- 15.Brash JL, Hove PT. Protein Adsorption Studies on “Standard” Polymeric Materials. J Biomater Sci Polymr Edn. 1993;4(6):591–9. doi: 10.1163/156856293x00230. [DOI] [PubMed] [Google Scholar]
- 16.Vroman L. Letter to the Editors. J Biomat Sci Polym Ed. 1994;6(2):223. [PubMed] [Google Scholar]
- 17.Claesson PM, Blomberg E, Froberg JC, Nylander T, Arnebrant T. Protein Interactions at Solid Surfaces. Adv Colloid and Interface Sci. 1995;57:161–227. [Google Scholar]
- 18.Lin JC, Cooper SL. In Vitro Fibrinogen Adsorption from Various Dilutions of Human Blood Plasma on Glow Discharge Modified Polyethylene. J Colloid and Interface Sci. 1996;182:315–25. [Google Scholar]
- 19.Lee JH, Lee HB. Platelet Adhesion onto Wettability Gradient Surfaces in the Absence and Presence of Plasma Proteins. J Biomed Mat Res. 1998;41:304–11. doi: 10.1002/(sici)1097-4636(199808)41:2<304::aid-jbm16>3.0.co;2-k. [DOI] [PubMed] [Google Scholar]
- 20.Derand H, Malmsten M. Protein Interfacial Behavior in Microfabricated Analysis Systems and Microarrays. In: Malmsten M, editor. Biopolymers at Interfaces. New York: Marcel Dekker; 1998. pp. 393–413. [Google Scholar]
- 21.Malmsten M, editor. Biopolymers at Interfaces. New York: Marcel Dekker; 1998. [Google Scholar]
- 22.Jung S-Y, Lim S-M, Albertorio F, Kim G, Gurau MC, Yang RD, et al. The Vroman Effect: A Molecular Level Description of Fibrinogen Displacement. J Am Chem Soc. 2003;125(42):12782–6. doi: 10.1021/ja037263o. [DOI] [PubMed] [Google Scholar]
- 23.Krishnan A, Siedlecki CA, Vogler EA. Mixology of Protein Solutions and the Vroman Effect. Langmuir. 2004;20(12):5071–8. doi: 10.1021/la036218r. [DOI] [PubMed] [Google Scholar]
- 24.Brash JL, Lyman DJ. Adsorption of Plasma Proteins in Solution to Uncharged, Hydrophobic Polymer Surfaces. J Biomed Mat Res. 1969;3:175–89. doi: 10.1002/jbm.820030114. [DOI] [PubMed] [Google Scholar]
- 25.Tripp BC, Magda JJ, Andrade JD. Adsorption of Globular Proteins at the Air/Water Interface as Measured via Dynamic Surface Tension: Concentration Dependence, Mass-transfer Considerations, and Adsorption Kinetics. J Colloid and Interface Sci. 1995;173:16–27. [Google Scholar]
- 26.Krishnan A, Siedlecki C, Vogler EA. Traube-Rule Interpretation of Protein Adsorption to the Liquid-Vapor Interface. Langmuir. 2003;19:10342–52. [Google Scholar]
- 27.Krishnan A, Sturgeon J, Siedlecki CA, Vogler EA. Scaled Interfacial Activity of Proteins at the Liquid-Vapor Interface. J Biomed Mat Res. 2004;68A:544–57. doi: 10.1002/jbm.a.20104. in press. [DOI] [PubMed] [Google Scholar]
- 28.Krishnan A, Liu Y-H, Cha P, Allara DL, Vogler EA. Scaled Interfacial Activity of Proteins at a Hydrophobic Solid/Aqueous-Buffer Interface. J Biomed Mater Res. 2005;75A(2):445–57. doi: 10.1002/jbm.a.30444. [DOI] [PubMed] [Google Scholar]
- 29.Krishnan A, Wilson A, Sturgeon J, Siedlecki CA, Vogler EA. Liquid-Vapor Interfacial Tension of Blood Plasma, Serum and Purified Protein Constituents Thereof. Biomaterials. 2005;26:3445–53. doi: 10.1016/j.biomaterials.2004.09.016. [DOI] [PubMed] [Google Scholar]
- 30.Krishnan A, Liu Y-H, Cha P, Allara DL, Vogler EA. Interfacial Energetics of Blood Plasma and Serum Adsorption to a Hydrophobic Self-Assembled Monolayer Surface. Biomaterials. 2006;27:3187–94. doi: 10.1016/j.biomaterials.2005.12.032. [DOI] [PubMed] [Google Scholar]
- 31.Krishnan A, Liu Y-H, Cha P, Allara DL, Vogler EA. Interfacial Energetics of Globular-Blood Protein Adsorption to a Hydrophobic Surface from Aqueous-Buffer Solution. Journal of the Royal Society Interface. 2006;3:283–301. doi: 10.1098/rsif.2005.0087. [DOI] [PMC free article] [PubMed] [Google Scholar]
- 32.Noh H, Vogler EA. Volumetric Interpretation of Protein Adsorption: Partition Coefficients, Interphase Volumes, and Free Energies of Adsorption to Hydrophobic Surfaces. Biomaterials. 2006 doi: 10.1016/j.biomaterials.2006.07.038. in review. [DOI] [PubMed] [Google Scholar]
- 33.Horbett TA. The Role of Adsorbed Proteins in Tissue Response to Biomaterials. In: Ratner B, Hoffman A, editors. Biomaterials Science: An Introduction to Materials in Medicine. 2. San Diego: Elsevier Academic Press; 2004. pp. 237–46. [Google Scholar]
- 34.Noh H, Vogler EA. Volumetric Interpretation of Protein Adsorption: Mass and Energy Balance for Albumin Adsorption to Particulate Adsorbents with Incrementally-Increasing Hydrophilicity. Biomaterials. 2006 doi: 10.1016/j.biomaterials.2006.08.005. in review. [DOI] [PubMed] [Google Scholar]
- 35.Slomkowski S, Sosnowski S, Przerwa E. Reversible Adsorption of Spherical Particles from Binary Mixtures: Long-time Behavior. C R Chimie. 2003;6:1393–401. [Google Scholar]
- 36.Ariola F, Krishnan A, Vogler EA. Interfacial Rheology of Blood Proteins Adsorbed to the Aqueous-Buffer/Air Interface. Biomaterials. 2006;27:3404–12. doi: 10.1016/j.biomaterials.2006.02.005. [DOI] [PubMed] [Google Scholar]
- 37.Lee S, Ruckenstein E. Adsorption of Proteins onto Polymeric Surfaces of Different Hydrophilicities - A Case Study with Bovine Serum Albumin. J Colloid and Interface Sci. 1988;125(2):365–79. [Google Scholar]
- 38.Jeon J, Superline R, Raghavan S. Quantitative Analysis of Adsorbed Serum Albumin on Segmented Polyurethane Using FT-IR/ATR Spectroscopy. Applied Spectroscopy. 1992;46(11):1644–8. [Google Scholar]
- 39.Graham DE, Phillips MC. Proteins at Liquid Interfaces. J Colloid and Interface Sci. 1979;70(3):415–26. [Google Scholar]
- 40.Feijter JAD, Benhamins J, Veer FA. Ellipsometry as a Tool to study the Adsorption Behavior of Synthetic and Biopolymers at the Air-Water Interface. Biopolymers. 1978;17:1759–72. [Google Scholar]
- 41.Brynda E, Cepalova N, Stol M. Equilibrium Adsorption of Human Serum Albumin and Human Fibrinogen on Hydrophobic and Hydrophilic Surfaces. J Biomed Mat Sci. 1984;18:685–93. doi: 10.1002/jbm.820180609. [DOI] [PubMed] [Google Scholar]
- 42.Lassen B, Malmsten M. Structure of Protein Layers during Competitive Adsorption. J Colloid Interface Sci. 1996 Jun 25;180(2):339–49. [Google Scholar]
- 43.Wen-Yih Chen H-MH, Chien-Chen Lin, Fu-Yung Lin, Yu-Chia Chan. Effect of Temperature on Hydrophobic Interaction between Proteins and Hydrophobic Adsorbents: Studies by Isothermal Titration Calorimetry and the van’t Hoff Equation. Langmuir. 2003;19(22):9395–403. [Google Scholar]
- 44.Zhou C, Friedt J-M, Angelova A, Choi K-H, Laureyn W, Frederix F, et al. Human Immunoglobulin Adsorption Investigated by Means of Quartz Crystal Microbalance Dissipation, Atomic Force Microscopy, Surface Acoustic Wave, and Surface Plasmon Resonance Techniques. Langmuir. 2004;20(14):5870–8. doi: 10.1021/la036251d. [DOI] [PubMed] [Google Scholar]
- 45.Beverung C, Radke C, Blanch H. Protein adsorption at the oil/water interface: characterization of adsorption kinetics by dynamic interfacial tension measurements. Biophysical Chemistry. 1999;81:59–80. doi: 10.1016/s0301-4622(99)00082-4. [DOI] [PubMed] [Google Scholar]
- 46.Anderson NL, Anderson NG. The Human Plasma Proteome: History, Character, and Diagnostic Prospects. Molecular and Cellular Proteomics. 2002;1(11):845–67. doi: 10.1074/mcp.r200007-mcp200. [DOI] [PubMed] [Google Scholar]
- 47.Putnam FW. Alpha, Beta, Gamma, Omega - The Roster of the Plasma Proteins. In: Putnam FW, editor. The Plasma Proteins: Structure, Function, and Genetic Control. New York: Academic Press; 1975. pp. 58–131. [Google Scholar]
- 48.Richards FM. Areas, Volumes, Packing and Protein Structure. Ann Rev Biophys Bioeng. 1977;6:151–76. doi: 10.1146/annurev.bb.06.060177.001055. [DOI] [PubMed] [Google Scholar]
- 49.Chothia C. Structural Invariants in Protein Folding. Nature. 1975;254:304–8. doi: 10.1038/254304a0. [DOI] [PubMed] [Google Scholar]
- 50.Miller S, Lesk A, Janins J, Chothia C. The Accessible Surface Area and Stability of Oligomeric Proteins. Nature. 1987;328(27):834–6. doi: 10.1038/328834a0. [DOI] [PubMed] [Google Scholar]
- 51.Miller S, Janin J, Lesk A, Chothia C. Interior and Surface of Monomeric Proteins. J Mol Biol. 1987;196:641–56. doi: 10.1016/0022-2836(87)90038-6. [DOI] [PubMed] [Google Scholar]
- 52.Tsai J, Taylor R, Chothia C, Gerstin M. The Packing Density in Proteins: Standard Radii and Volumes. J Mol Bio. 1999;290:253–66. doi: 10.1006/jmbi.1999.2829. [DOI] [PubMed] [Google Scholar]
- 53.Gerstein M, Chothia C. Packing at the Protein-Water Interface. Proc Natl Acad Sci. 1996;93:10167–72. doi: 10.1073/pnas.93.19.10167. [DOI] [PMC free article] [PubMed] [Google Scholar]
- 54.Miller S, Janin J, Leak AM, Chothia C. Interior and Surface of Monomeric Proteins. J Mol Biol. 1987;196:641–56. doi: 10.1016/0022-2836(87)90038-6. [DOI] [PubMed] [Google Scholar]
- 55.Feder J. Random Sequential Adsorption. J Theor Biol. 1980;87(2):237–54. [Google Scholar]
- 56.Swendsen RH. Dynamics of Random Sequential Adsorption. Phys Rev A. 1981;24(1):504–8. [Google Scholar]
- 57.Vogler EA. Structure and Reactivity of Water at Biomaterial Surfaces. Adv Colloid and Interface Sci. 1998;74(13):69–117. doi: 10.1016/s0001-8686(97)00040-7. [DOI] [PubMed] [Google Scholar]
- 58.Aste T, Weaire DL. The pursuit of perfect packing. Bristol, PA: Institute of Physics Pub; 2000. [Google Scholar]