Abstract
COSMIC is currently the most comprehensive global resource for information on somatic mutations in human cancer, combining curation of the scientific literature with tumor resequencing data from the Cancer Genome Project at the Sanger Institute, U.K. Almost 4800 genes and 250000 tumors have been examined, resulting in over 50000 mutations available for investigation. This information can be accessed in a number of ways, the most convenient being the Web-based system which allows detailed data mining, presenting the results in easily interpretable formats. This unit describes the graphical system in detail, elaborating an example walkthrough and the many ways that the resulting information can be thoroughly investigated by combining data, respecializing the query, or viewing the results in different ways. Alternate protocols overview the available precompiled data files available for download.
Keywords: COSMIC, cancer, somatic, mutation, database
INTRODUCTION
The Catalogue of Somatic Mutations in Cancer (COSMIC) is currently the most comprehensive global resource accessing the world literature on somatic mutations in human cancer. The system is designed to preserve and improve the usefulness of published somatic mutation data by full curation of the scientific literature for genes known to be involved in cancer, as defined in the Cancer Gene Census (Futreal et al., 2004). It has been further extended to include tumor resequencing results from the Cancer Genome Project (CGP) at the Wellcome Trust Sanger Institute.
Since its initial release in 2004, COSMIC has grown to include data from nearly 4800 genes investigated for somatic mutations in cancer; almost 250000 tumor samples have been investigated, resulting in over 50000 mutations. The system is regularly updated, receiving new data once every two months. COSMIC now contains details of most of the genes known to have tumor-promoting point mutations, and curation of fusion events between multiple genes has commenced, since these are also common occurrences in cancer.
In this unit, the Basic Protocol describes how to examine the data in COSMIC using the graphical Web system. Two alternate protocols briefly describe accessing the data at a more basic level, using exported datasheets or by obtaining a copy of the database itself. The Commentary section discusses the context within which COSMIC exists, some of the issues it resolves, and some that may be encountered. Some examples are provided to illustrate how easily and precisely the data can be investigated.
INVESTIGATING THE COSMIC WEB SITE
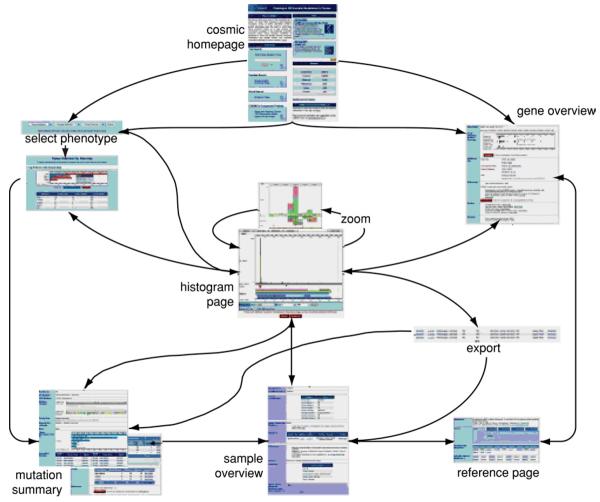
The main COSMIC Web site is accessible via the Internet (http://www.sanger.ac.uk/cosmic). Its front page contains all the options on searching the data, together with an overview of the site's current contents and additional descriptions. This protocol will inform the reader how to retrieve data from the system and how to examine it using the graphical and tabular views to extract the greatest useful information. Each Web page interconnects as much as possible, allowing continuous rounds of query specialization, leading to a Web-like workflow rather than a linear one (Fig. 10.11.12). An example walkthrough shows some of COSMIC's main capabilities.
Figure 10.11.12.
The main COSMIC workflow. After initial selection of a gene or phenotype to examine, the detail pages link together in a web, allowing navigation through sample, gene, and mutation details, together with redefinition, specialization, or generalization of the initial selection. For color version of this figure see http://www.currentprotocols.com.
NOTE: All examples, names, and numbers refer to release v33 (September, 2007) and will change over time.
Necessary Resources
Hardware
Any Internet-connected computer
Software
Web-browsing software such as Internet Explorer, Firefox, Safari, Netscape
Files
No input files required
The COSMIC home page: Getting started
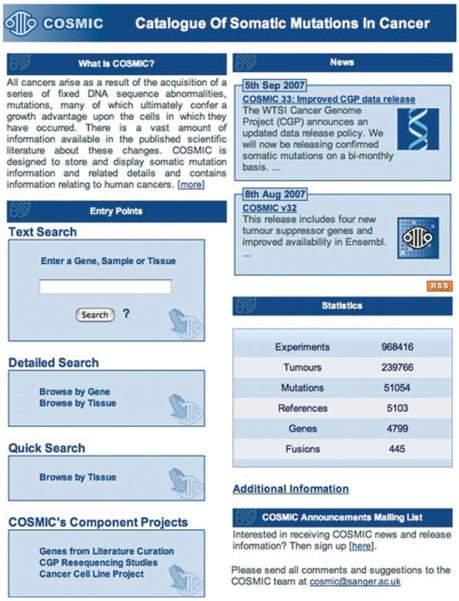
1. Access the main COSMIC home page at http://www.sanger.ac.uk/cosmic. This should look similar to Figure 10.11.1 (the per-release news items and current content statistics will change frequently).
Figure 10.11.1.
The main COSMIC home page detailing current content statistics and top-level search options. The statistics are regenerated every release; in this case, the numbers relate to the October 2007 release. For color version of this figure see http://www.currentprotocols.com.
COSMIC can be searched in a number of different ways, requiring different parameters. The easiest method is to type a gene name, tissue type, or cancer morphology into the Text Search box. Alternatively, the Detailed Search allows navigation to a gene name or precise cancer phenotype, offering lists of options from which to choose. The Quick Search allows the overview of the genotype information for tumors from a chosen tissue site (e.g., “lung”) in one step. Finally, the Genes from Literature Curation describes those genes which have received complete literature curation, as distinct from those which are from CGP sources only. Also on this page are links to recent announcements from COSMIC, and a running total of the system's current contents.
Simple COSMIC searching
2. To perform a simple search, enter the search term of choice in the Text Search box. In this example, enter KRAS into the search box to perform a search by gene (searching is not case-sensitive). The search results window is displayed, with each option providing a small description.
Most searches in COSMIC are performed simply through the Text Search box. It is possible to search COSMIC for gene names and their HUGO synonyms. Simple searches can also be performed for tissue types (primary locations such as “pancreas,” or subspecializations such as “uterus,” classified in COSMIC as Soft Tissue: Striated Muscle: Uterus), tumor morphology (e.g., “glioma”), sample name (e.g., “HCC38”), or a mutation description (e.g., the common KRAS mutation “c.35G>A”; “p.G12D”). If a COSMIC ID number (the numeric internal database identifier) is known for any of these, it can also be used in a simple search to retrieve very specific datapoints (the KRAS p.G12D mutation has ID number 521). Search terms can be combined: 521 mutation will return only mutations, excluding, for instance, all samples with “521” in their name.
Often a number of options are returned; KRAS returns 82. The first is usually most useful, in this case, a link to the gene summary page for KRAS, followed by 81 mutations identified so far in this gene.
Selecting the link most relevant to the query will display the appropriate summary page. While COSMIC can be navigated gene-centrically or tissue-centrically, summary pages are available to describe all key data including genes, tissues (cancer phenotypes), papers, CGP studies, mutations and samples, and it is links to these that are provided.
Examining the Gene Summary page
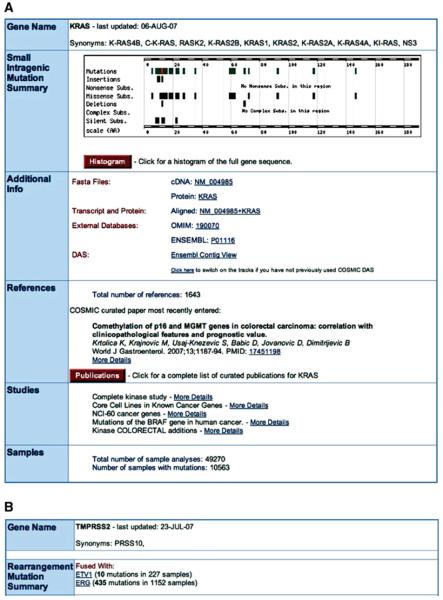
3. Click on the top link, “gene: KRAS,” which will show the summary information for the KRAS gene. A page similar to Figure 10.11.2 A will appear, summarizing all the information stored in COSMIC about the gene.
Figure 10.11.2.
(A) The Gene overview page for KRAS, providing summary statistics of the mutation data, links to the data source overview pages (paper or study) and a series of links external to COSMIC. (B) For a gene with fusion data (e.g., TMPRSS2), an extra element is inserted after the graphical mutation summary, detailing its fusion partners and mutation statistics. For color version of this figure see http://www.currentprotocols.com.
In the Mutation Summary, the spread of mutations across the gene is shown graphically (the scale is the peptide sequence of the gene's product). The mutations combined are drawn in green, with the most frequently mutated position highlighted in red, and the subsequent breakdown by mutation type drawn in black. The mutations graphic is clickable, producing a small menu offering further details and navigation options. The Histogram button links to the core Histogram page detailed in the next section.
Additional Info comprises a list of links to views of the gene's sequence in three forms and to external database links, including the option to view all COSMIC's KRAS data integrated into Ensembl's ContigView via their DAS technology. To use this for the first time, click the lower DAS link to turn on COSMIC's data sources in Ensembl and show the mutation data aligned to the human genome sequence, complete with Ensembl genome browser annotations.
The References section provides a summary of the publications used to compile these data, with links to the papers cited.
The Studies section details the CGP studies' contribution, with links to the study summary pages.
Finally, the Samples section shows the total number of samples investigated in this gene, together with the number which were mutated.
Additionally, if a gene is involved in a fusion event with another gene, a section is inserted under the mutation summary (Figure 10.11.2B), detailing the genes' fusion partners together with summary totals. Links are provided to the fusion summary page for the gene pairs.
The Histogram page: Tissue spread, mutation frequencies, and spectra
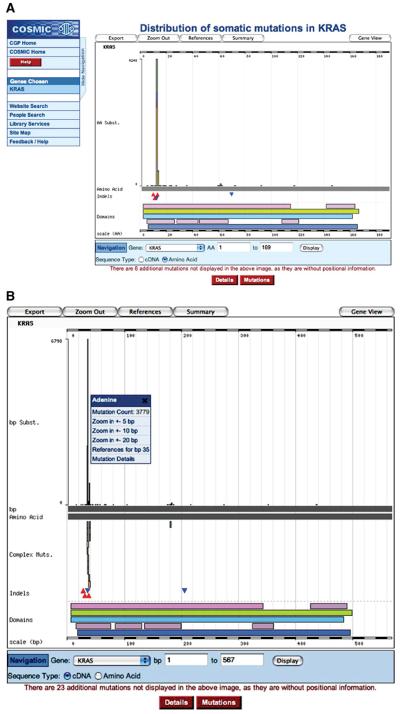
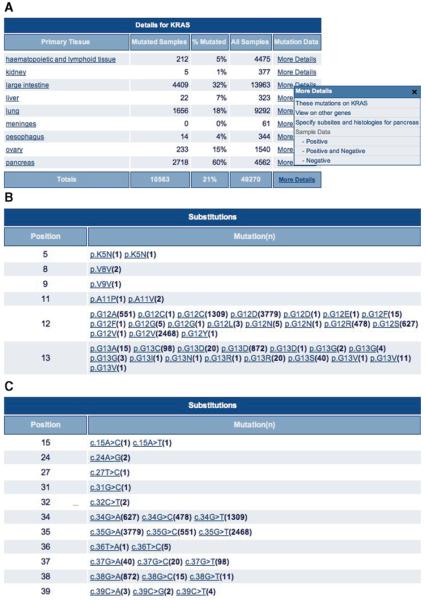
4. Click the red Histogram button under the mutation graphic. A page will appear describing the gene's mutation spectrum in much more detail, shown at the amino acid level by default (Fig. 10.11.3A). Click the Sequence Type “cDNA” button under the graphic and then press Display to obtain the nucleotide view of the graphic (Fig. 10.11.3B). In the table below the graphic, the Details tab is selected by default (Fig. 10.11.4A). Click the Mutations button to view tabulated details of the mutations on the gene (Fig. 10.11.4B).
Figure 10.11.3.
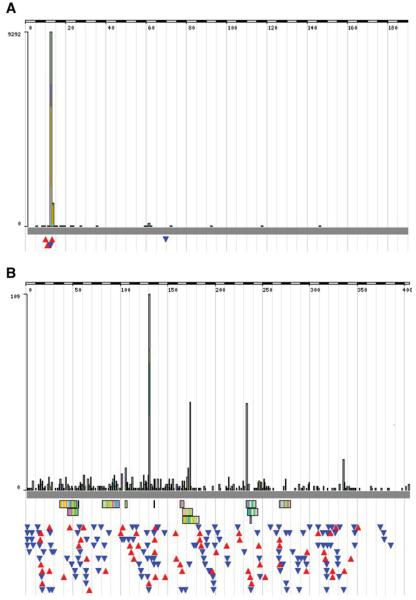
Graphical representation of the mutation spectrum across the KRAS gene on the amino acid scale (A) and on the nucleotide scale (B). Note the novel introduction of complex mutations. Frequently two or three of these equal nucleotide substitutions, these often result in missense mutations at the peptide level, not separable in the amino acid view (A). The small popup menu (shown in B; available for all mutation types) offers zooming options and details links. For color version of this figure see http://www.currentprotocols.com.
Figure 10.11.4.
(A) Details table from the histogram page, detailing the per-tissue and total sample counts and mutation rates. Only a small portion is shown; 13 tissue types are above “haematopoietic and lymphoid tissue” and 18 below “pancreas.” Clicking on the More Details column shows a small popup menu, linking to tabular details of the samples examined for the tissue type chosen. (B) Excerpt from the Mutations table on the histogram page viewed at the amino acid level, detailing (in this sample of a large table up to codon 13 of KRAS) each sequence variant observed on the gene, together with the number of times observed (in parentheses) and a link to its own summary page. Subsequently this table may display details of other mutation types. (C) Excerpt from the Mutations table of the histogram page, detailing at the nucleotide level all the sequence variants observed up to codon 13 (nucleotide 39) of KRAS. A count of each mutation is shown, together with a link to that mutation's summary page. For color version of this figure see http://www.currentprotocols.com.
The default peptide-view graphic (Fig. 10.11.3A) shows a histogram of the single-base substitutions identified in the gene, color coded by residue according to the color scheme used in Ensembl (http://www.ensembl.org). Underneath this are insertions (red triangles) and deletions (blue triangles). Below this are indications of protein structure together with links to their source (e.g., Pfam, InterPro). Below this are options for zooming into the gene sequence and for selecting amino acid versus nucleotide views. Under the graphic, a statement indicates how many mutations were reported in the gene but were not detailed enough to place on the histogram. At the top of the graphic, buttons are offered to export the data represented by the graphic, together with gene/reference summary pages.
Two tables are available beneath the graphic. The default Details table (Fig. 10.11.4A) contains a breakdown of mutation frequencies per primary tissue type, with totals at the bottom. The Mutations table (Fig. 10.11.4B) describes all the mutations observed on the gene, together with counts of times observed (in brackets) and links to mutation summary pages. Similar mutations may arise a number of times with different counts (e.g., mutation p.G12 V in Fig. 10.11.4B was counted 2468 times in one instance and 1 time in another). This is usually because the underlying nucleotide change is different, but results in the same effect in the expressed product. The p.G12 V mutation counted 2468 times resulted from the simple c.35G>T substitution, while the p.G12 V counted only once was caused by the compound c.35_36GT>TC substitution (classified ‘complex’). The mutation table is broken down by mutation type (most KRAS mutations are single-base substitutions). All mutation descriptions in COSMIC, as seen here, are compliant with Human Genome Variation Society (HGVS) nomenclature (denDunnen and Antonarakis 2000; http://www.hgvs.org/mutnomen/), which recommends specific syntaxes for the precise reporting of sequence changes.
Changing the histogram view from amino acid to cDNA provides a nucleotide-centric picture (Fig. 10.11.3B). The scale on the graphic changes, as do the pictured results. Complex compound substitutions can now be seen as small vertical bars. Primarily 2-bp compound equal substitutions, these usually result in simple missense mutations, only existing as complex compound substitutions at the nucleotide level. Notice that the Mutations table also changes when the graphic is changed to the cDNA view (Fig. 10.11.4C).
Tabulating selected data
5. Click on the More Details link on the right side of the Details table. In Figure 10.11.4A, the link has been clicked for “pancreas,” resulting in a popup box. The three top links offer methods to refine the query used to produce the histogram page. Under Sample Data, export functions are available to tabulate the data summarized in the table. Click the Positive and Negative link.
The three export options allow the viewing of all the data for that tissue for that gene (i.e., KRAS/pancreas), just the mutant samples, or just those without mutations. The tabulated data include sample name and phenotype details, together with mutation details and a link to PubMed for the originating publication. CGP data, released prepublication, have no PubMed link.
The Histogram page: Zooming
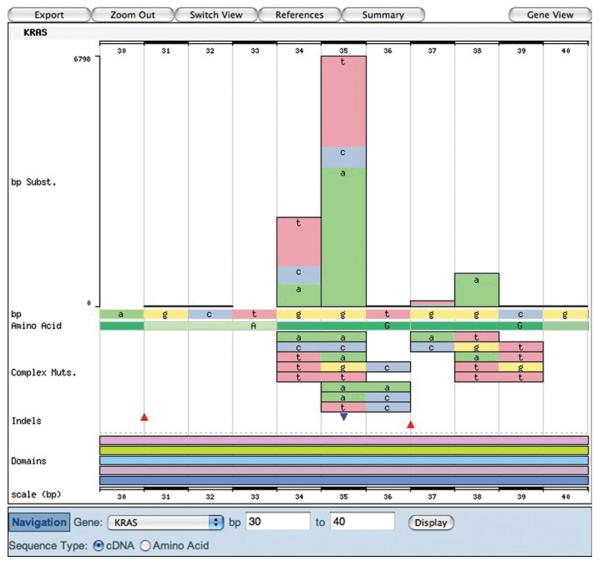
6. Click the browser's “back” button to return to the histogram page in cDNA view. Click the peak mutant shown in Figure 10.11.3B, and a small popup menu will offer zooming options and further details links. Click the “Zoom in +−5bp” option, and the view will zoom in on the 10 bp surrounding the selected nucleotide (Fig. 10.11.5).
Figure 10.11.5.
The histogram graphic showing the cDNA view of KRAS when zoomed in to the mutation peak between 30 and 40 bp (of the CDS). For color version of this figure see http://www.currentprotocols.com.
The zoomed view shows much more clearly the details of the region, including color-coded annotated nucleotides. (If the zoom window expands beyond 50 bp, the annotations no longer fit and are removed.) The wild-type cDNA and amino acid sequences are labeled on the x axis. Above is the substitution histogram, and below are details of complex compound substitutions followed by insertions and deletions. Note that the tables below the graphic also change with zooming. The Mutations table will only show the sequence variants within the graphic window [in this case, nucleotides 30 to 40 of the KRAS coding domains (CDS) sequence]. The Details table will only count Mutated Samples if they have a mutation between the boundaries, thus reducing the calculated mutation frequency.
7. Click on Zoom Out at the top to return to the full gene view.
Searching COSMIC: Defining a detailed phenotype
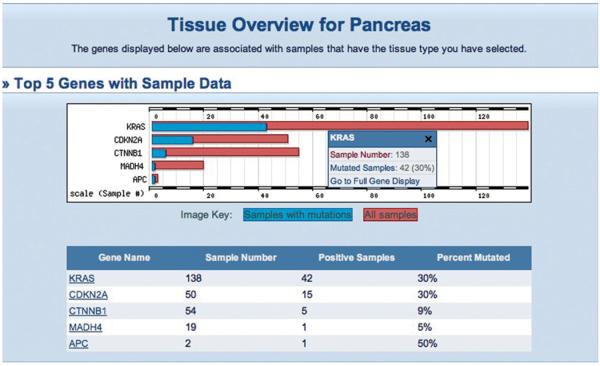
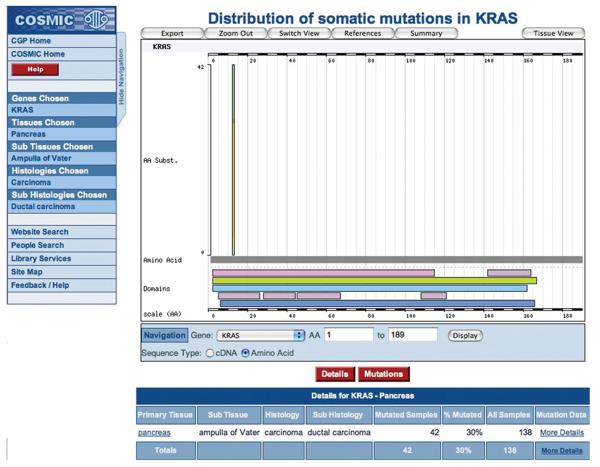
8. Clicking on a primary tissue link from the Details table on the Histogram page (left-hand column of Fig. 10.11.4A) allows further specialization of the phenotype being investigated. This detailed phenotype search is also available via the Browse by Tissue option on the main COSMIC home page. Options are offered from the COSMIC database, which can be selected singly or in multiples. In this example, to specify a tumor site (tissue), select “pancreas,” click Next, then “ampulla of Vater,” and click Next. To further specialize by tumor morphology (histology), select “carcinoma” and click Next, then select “ductal carcinoma” and click Next. The Tissue Summary page will present a list of genes with statistics to show how many tumor samples have been examined in each gene, and the tumor type's mutation frequency in that gene (Fig. 10.11.6). Click on the KRAS gene in the table to go to the Histogram page with the new specialized query, which will now display only mutations for the new phenotype selection (Fig. 10.11.7).
Figure 10.11.6.
The five most mutated genes in the specialized phenotype, ductal carcinoma of the pancreatic ampulla of Vater (Pancreas: Ampulla of Vater; Carcinoma: Ductal Carcinoma). The small popup menu summarizes the tabulated data for the selected gene, and a link to the histogram page. For color version of this figure see http://www.currentprotocols.com.
Figure 10.11.7.
Starting from the Tissue Overview in Figure 10.14.6, the histogram and tables reflect specialized phenotypes, showing only the data from samples with this specific cancer type. For color version of this figure see http://www.currentprotocols.com.
These selection pages behave differently depending on the number of selections made. At the beginning, selecting five tissues or less will allow further specialization of the tumor site, selecting more will simply skip to the histology selection. The histology section will only offer further specialization if one choice is made. Once a specific selection is made (and a selection does not have to be this specific), the resulting page will show which genes have been analyzed through the selected phenotype and which were mutated in any of the samples. The five genes with the highest mutation frequency will be described in more detail, both graphically and in a table (Fig. 10.11.6). The ordering of these five genes is a statistical evaluation of their impact in cancer, a combination of the mutation frequency, and the number of samples examined. Clicking on a gene name in the table or a gene's bar in the chart produces the histogram page (as described above). However, the graphic and tables now reflect only the mutations found in the phenotype specified (Fig. 10.11.7), so the numbers are much reduced in both.
To view the full details of the gene again (i.e., remove the specialized phenotype), click on the Switch View button above the histogram graphic. While navigating specialized phenotypes, the current tissue/histology selection is shown in the sidebar on the left hand side; clicking on these links allows you to respecialize.
Examining a mutation in more detail
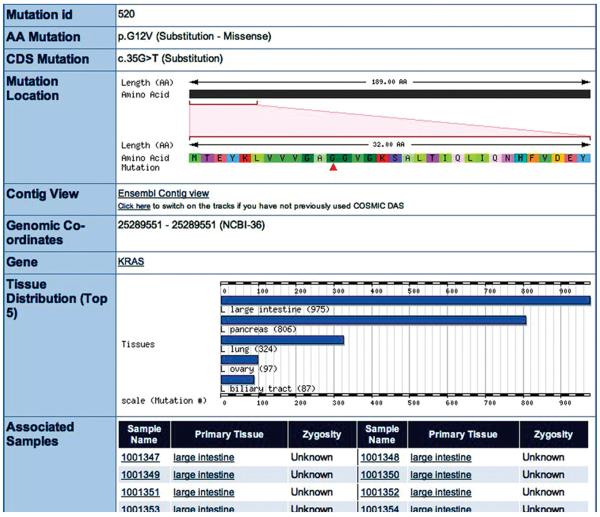
9. Click on the top portion of the mutant peak in the KRAS tissue histogram picture (green, Fig. 10.11.7), and then click the Mutation Details link in the popup menu. (Alternatively, click on the Mutations button under the histogram to reveal the Mutations table then click on “p.G12 V”). The Mutation Summary page is presented (Fig. 10.11.8).
Figure 10.11.8.
The Mutation Summary page for the highly oncogenic c.35G>T KRAS mutation. All details of this mutation are presented here, including the Associated Samples list, which is a potentially very long list of samples in which this mutation has been found. Sample names and tissues are linked. For color version of this figure see http://www.currentprotocols.com.
This page presents all the information available for the sequence change selected. The COSMIC mutation ID at the top can be used in a search from the front page, as can the mutation descriptions. The ‘p.’ and ‘c.’ descriptions are the very precise descriptive HGVS-compliant nomenclatures at the protein and cDNA levels, respectively. The position of the mutated residue is indicated graphically on the CDS scale of the gene. Underneath this are the coordinates of the mutation on the current genome golden path sequence (NCBI36 at the time of writing), together with a link to view the mutation in a genomic context in the Genome Browser at Ensembl via its DAS technology. The lower histogram graphic indicates the five tissues in which this mutant was most frequently found. Beneath this is a potentially very long list of samples, in which this mutation has been observed. Links are available to go back to the Tissue Summary and Gene Summary pages.
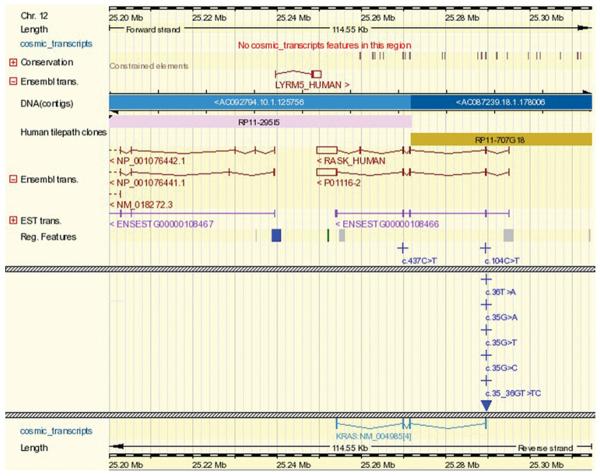
10. In the box labeled Contig View, click on the link labeled “Click here to switch on the tracks if you have not previously used COSMIC DAS” to be directed to the Ensembl view of this COSMIC data. In Ensembl, zoom out a few times to view the genomic context (Fig. 10.11.9)
Figure 10.11.9.
COSMIC data viewed in the Ensembl genome browser, starting from the Mutation Summary in Figure 10.11.8. By default initially zoomed into the coordinates immediately around the mutation specified (KRAS c.35G>T), zooming out gives a view of the genomic context of the COSMIC gene and its mutation spectrum (crosses denote substitutions, filled triangles denote insertions and deletions). Closely positioned mutations are arranged vertically, so if there are many (as in KRAS), the page can become very long. Hashed grey horizontal bars have been used in the figure to indicate where data have been cut. For color version of this figure see http://www.currentprotocols.com.
After clicking the Contig view link, an Ensembl DAS view is presented, extremely zoomed in to the mutation position. After zooming out, a view similar to Figure 10.11.9 shows the KRAS gene structure and the position of mutations, together with surrounding genes and other genomic information. Further DAS tracks can be selected in Ensembl to show significantly more data.
Examining a sample in more detail
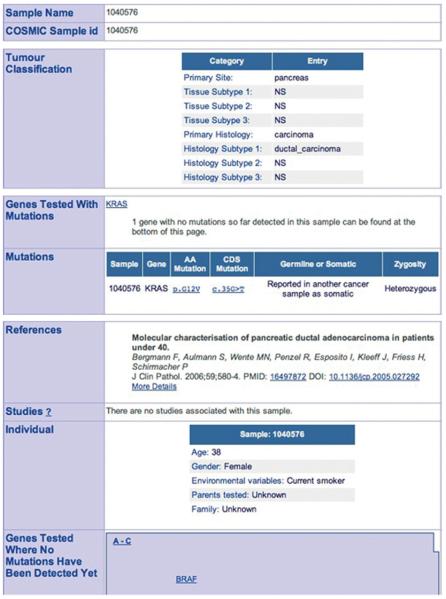
11. Click the browser's “back” button to return to the Mutation Summary page (Fig. 10.11.8), then click on a sample name from the long list on the Mutation Summary page (e.g., “1040576,” the first pancreas sample part way down this page). The Sample Summary page will be shown (Fig. 10.11.10), detailing all available information about the sample.
Figure 10.11.10.
Selected information boxes from the Sample Overview page, detailing a choice from the c.35G>T Mutation Summary page. This page can be very long, as it brings together all the information about the sample, which can be extensive. This figure only includes data of importance. Further details can include genotypically synonymous samples, external data sources with further information (LOH analysis, extensive genotyping), and further isolated data points extracted from the paper about the sample (e.g., stage, grade, ethnicity, karyotype). CGP samples often include a link to the CGP study, together with microsatellite instability and genotyping data. In this page, the list of mutations and nonmutant genes can be somewhat lengthy. For color version of this figure see http://www.currentprotocols.com.
This page can become very long, as it shows all the data available for the selected sample. The page begins with the sample name; this is accurate as far as possible, but where a publication uses a non-unique or ambiguous name, it is replaced by a COSMIC database reference (this can be a number with an E or S prefix, but is more typically a single 7-digit ID). Other details include information on the sample itself and the individual it came from (where available; e.g., age, ethnicity) and the exact phenotype of the sample. Under these details, a list of genes is shown in which the sample has mutations, followed by a listing of the individual mutations with their zygosity and somatic status. Further details include the publications describing the sample and a list of genes examined in this sample that were not mutant.
CGP samples (as opposed to those derived from the literature) are often examined more thoroughly, usually offering a more extensive list of investigated genes together with microsatellite LOH data and intensive microarray CGH analysis. CGP studies often offer prepublication data; in these cases, the information is grouped into “studies” rather than publications, which are navigated similarly.
Viewing the contents of a paper
12. Click on the More Details link in the reference box on the Sample Summary page (Bergmann et al., 2006).
A paper often describes the analysis of many samples through many genes. In this example, seven samples have been examined in both the KRAS and BRAF genes and three mutations were found, all in KRAS. All the details are shown here, per paper, with links to PubMed and the originating journal article (in many cases, the DOI link requires a journal subscription). A similar summary view is available for CGP studies, which are groups of functionally related genes for CGP prepublication data.
Further navigation in the histogram: Exporting
13. The paper's list of genes are separated in alphabetical brackets (not shown). For the Bergmann paper, click on the J-L tab, then click KRAS, and then click the Histogram button to return to the histogram as seen before. Click on the scale bar just above 100 to zoom in on this position, then click the Export button.
The Navigation box below the graphic allows the histogram to be changed in many ways, including zooming options whereby nucleotide or amino acid coordinates can be input for a very specific view, changing the default amino acid view to a nucleotide view (and vice versa), and selecting a completely new gene to examine. Above the histogram, more buttons provide further navigation. The Summary button returns to the Gene Summary page, the References button provides a complete listing of all publications used to generate the data onscreen, Zoom Out returns the histogram to the full gene view, and the Export button allows the data summarized in the graphic to be exported in tabular format. A number of export formats are provided; the HTML and the two Text links simply render the data onscreen, so it can be viewed or cut-and-pasted into another application. The MS Excel option saves the data in a file on the client computer in Microsoft Excel spreadsheet format.
Examining gene fusions
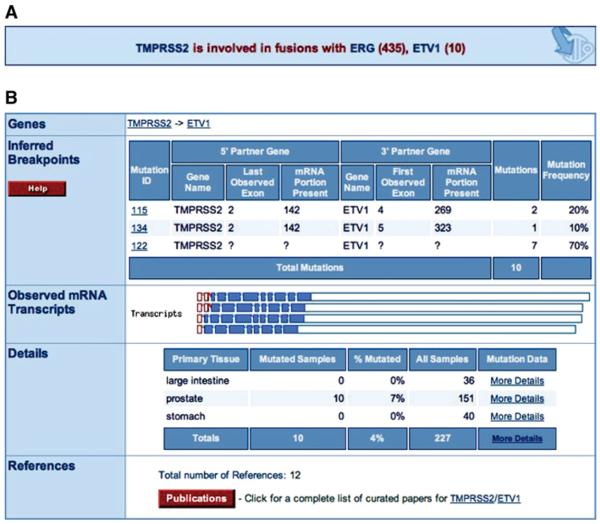
14. Press the browser's back button to return to the KRAS histogram (Fig. 10.11.7). In the navigation box under the histogram, a pull-down menu offers a similar view of all the genes in COSMIC. Select TMPRSS2 and press the Display button. Click ETV1 in the information box under the TMPRSS2 histogram (Fig.10.11.11A), and the Fusion Summary page will be displayed (Fig. 10.11.11B), detailing the different fused structures observed. Click mutation “115” in the Inferred Breakpoints table to retrieve details for this mutation.
Figure 10.11.11.
(A) The information box displayed under the histogram when COSMIC has information on fusion events involving the selected gene (in this example, TMPRSS2). (B) The Fusion Summary page for the TMPRSS2/ETV1 gene pair. Inferred breakpoints are displayed in the table, and observed mRNAs are displayed graphically. Similar to the Mutation Summary page, there is a tabulated breakdown of mutation frequencies by primary tissue type. Finally, the publications used to generate the data are summarized. Clicking on a mutation ID or a graphically rendered transcript provides further information on that individual fusion mutation. For color version of this figure see http://www.currentprotocols.com.
In this case, TMPRSS2 has no classic small mutations, but an information box indicates that COSMIC has data of fusion events involving this gene, mostly with ERG, but also with ETV1 (Fig. 10.11.11A). These are specified in the Mutations table (press the red Mutations button), which also link to the fusion variant of the Mutation Summary page. However, the first step in this example is to view the summary of a fused gene pair.
Figure 10.11.11B shows the Fusion Summary page for the selected gene pair. In order to accurately describe the published data while ensuring navigability, the fusion data are described in two ways, Inferred Breakpoints and Observed mRNAs. This is due to many papers using expression technologies such as RT-PCR to determine fusions between genes. A number of these studies identify more than one transcript per sample, some finding more than four different products between the same gene pair in one tumor. This implies significant alternative splicing of the mRNAs expressed from the fused gene pair. In order to simplify these data for display and navigation, the position of the genomic breakpoint has been inferred from the experimental data while maintaining the original results.
To do this, it has been assumed that each sample's breakpoint lies between the most 3′ expressed exon of the 5′ gene partner and the most 5′ exon of the 3′ gene partner, from the mRNAs reported in that sample. For instance, in sample “MET26-LN,” two TMPRSS2/ETV1 fusion mRNAs were identified, both containing the downstream sequence from exon 4 of ETV; one fusion (ID 14) contained only the first exon of TMPRSS2, while the other (ID 15) contained the first two exons. Since both were observed in the same sample, the default assumption is that these are splice variants of a fusion between somewhere downstream of TMPRSS2 exon 2 and somewhere upstream of ETV1 exon 4, and the inferred breakpoint for this sample (ID 115) reflects this.
The Mutation Details page (not shown, but accessed by clicking “115” from the Fusion Summary page in Fig. 10.11.11B) shows the mutation ID, whether it is an inferred or observed fusion mRNA, and the HGVS-compliant syntax describing the exact details of the mutation, followed by two graphical representations of the mutation. The first graphic describes the mutant mRNA in relation to its wild-type parent genes, the second shows the related mutations. Lastly, a listing of samples containing this fusion mutation is presented.
The Sample Summary page also describes fusion mutations if present, replacing the standard mutations table with a tabulated inferred breakpoint and a graphical list of observed mRNAs; this can be seen by clicking on “MET26-LN” in the Mutation Details page.
Core COSMIC workflow
15. Before beginning a new search, it is useful to review the main pathways through the data in COSMIC. The workflow and interrelationships of the core pages are summarized in Figure 10.11.12.
ACCESSING SPREADSHEETS VIA FTP
The data in the COSMIC database can be examined in several ways. The Web site is the easiest method of visualizing the data, but other offline methods are occasionally useful. All the data in COSMIC are exported onto its FTP site automatically every release, thus ensuring its contents are always up to date. The FTP site is described at the bottom of the “Additional information” link on the COSMIC home page, and can be found at ftp://ftp.sanger.ac.uk/pub/CGP/cosmic.
Necessary Resources
Hardware
Any Internet-connected computer.
Software
FTP client software (including Web browsers), Spreadsheet software.
Files
Input files are downloaded from the COSMIC FTP site.
1. Open a Web browser or FTP client to the URL ftp://ftp.sanger.ac.uk/pub/CGP/cosmic. Open the data_export directory and select a gene (e.g., ABL1).
2. Click on the .xls file to download the MS Excel file, or the .csv file to download the comma-separated-values file, which should work in any spreadsheet program. Open the file to examine the data.
All the data in COSMIC have been exported in the standard export format (using an automated version of the export utility described in step 13 of the Basic Protocol). Each file contains the complete dataset for that gene, including sample phenotype and mutation details for all mutant and nonmutant samples, together with publication details and other information.
3. Go back to the main FTP site and open the fasta files folder. Select and open a sequence file (e.g., ABL1 cdna.txt).
The sequences for each gene in COSMIC are made available in this folder in fasta format. Both cDNA (coding domain only) and translated peptide are provided.
4. Go back to the main FTP site and open the kinase_export folder. Choose a file (e.g., CosmicKinaseExport.csv) and open it in a spreadsheet program (e.g., MS Excel).
Gene sequences are provided here, similar to the fasta_files folder, but with more information, and not in fasta format. Further details provided are gene name, Genbank and Swissprot accession numbers, and cDNA (coding domain only) and peptide sequences.
EXPLORING THE ORACLE DATABASE DIRECTLY
As well as exporting the data from COSMIC in spreadsheets, the whole COSMIC database is exported and made available at ftp://ftp.sanger.ac.uk/pub/CGP/cosmic/oracle_export. This file contains the entire database that is used to drive the Web site and export utility. However, this requires significantly more IT infrastructure, and it is recommended that an IT specialist be employed to do this.
Necessary Resources
Hardware
Any modern (post-2000) computer should be sufficient to run a minimal Oracle install
Software
Oracle database (COSMIC fits easily within the declared constraints of Oracle's free Express edition, http://www.oracle.com/technology/products/database/xe/index.html)
Files
Input files are downloaded from the COSMIC FTP site (“oracle export” section)
1. Download the Oracle export file from the FTP site, decompress it, and install it into the Oracle server using the Import utility (“imp”). Once successful, the database can be investigated using the SQL language with reference to the structure of the schema, available diagrammatically in PDF format in the oracle_exports folder.
Although it usually requires specialized informatics personnel, this is the most powerful method of analysis, as all data are individually available and custom-combinable, both within COSMIC and, potentially, between this and other databases. This method will only be required for complex data mining. Export files are available for each release since v14 (January, 2006), for Oracle version 9 and 10 g only. They are all compressed using “gzip” to ensure small download size (recent releases, e.g., v33, are ~50 Mb).
COMMENTARY
Background Information
COSMIC grew out of the need to combine cancer somatic data, which was available from many sources, but mostly distributed throughout the scientific literature. The literature is not searchable by any aggregate or automated methods, and online resources usually comprise single-locus databases, which though sometimes extensive (IARC p53 database, Petitjean et al., 2007) do not provide phenotype-specific genetic overviews. Larger online resources (e.g., OMIM, Hamosh et al., 2002; HGMD, Cooper et al., 2005) store minimal information, usually only on high-frequency mutant alleles, thus losing much context detail. COSMIC solves most of these drawbacks by extracting as much detail as possible from targeted literature and combining this with CGP's own data as it is confirmed in the laboratory. Large datasets are therefore made available for deep data mining, while maintaining sample sizes that can still achieve good statistical significance.
The COSMIC project can be subdivided into two distinct portions. Just over half its contents are derived from complete and up-to-date manual curation of the scientific literature for nominated genes from the Cancer Gene Census (Futreal et al., 2004). Most of these genes promote tumorigenesis via simple point mutations, but curation has begun more recently of oncogenic gene fusion events, usually occurring via chromosomal rearrangements. The other half of COSMIC's contents are confirmed somatic mutation data derived exclusively from the tumor resequencing project (Cancer Genome Project or CGP) at the Sanger Institute. The (largely prepublication) CGP data are further subdivided between two studies, the “cancer cell line project,” which aims to resequence all point-mutated cancer genes through a large series of almost 800 common cancer cell lines, and the “CGP resequencing project,” which has the ultimate aim of sequencing tumors of specific types through a selection of over 4000 candidate genes. Approximately half of the tumor analysis experiments described in COSMIC are derived from literature curation, the other half from CGP laboratories. Nearly 50000 mutations have been curated, with ~90% deriving from the literature curation study, which focuses on genes known to be mutated in cancer. Much lower mutation rates derive from the CGP, which is hunting for novel oncogenes. Four color-coded Web sites allow the investigation of the data, independently or in combination (Fig. 10.11.13):
Curated scientific literature (gold; http://www.sanger.ac.uk/genetics/CGP/Classic)
CGP resequencing project (red; http://www.sanger.ac.uk/genetics/CGP/Studies)
Cancer cell line project (green, http://www.sanger.ac.uk/genetics/CGP/CellLines)
All of the above, merged (blue; http://www.sanger.ac.uk/genetics/CGP/cosmic)
Figure 10.11.13.
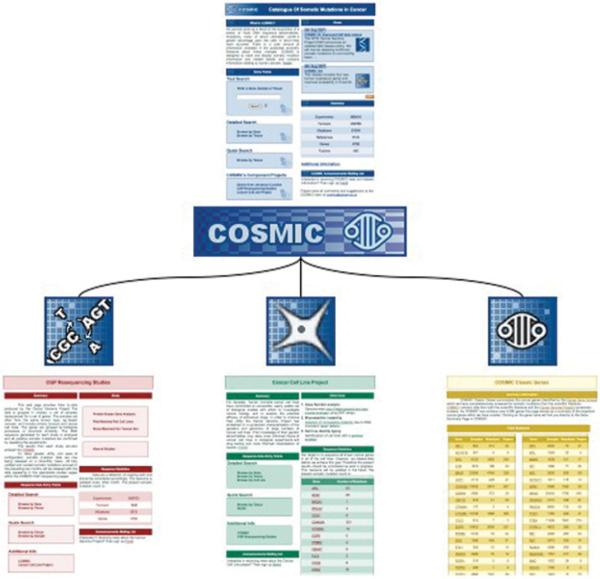
The COSMIC Web site overviews the data from three distinct subprojects. The gold pages describe the data derived from curation of the scientific literature, the red pages display results from the CGP resequencing project, and the green pages detail results of the cancer cell line project. The gold page is simply descriptive, while the green and red pages front Web sites that allow full independent navigation of the subproject's data. For color version of this figure see http://www.currentprotocols.com.
With an emphasis on data quality, all the information contained in all the papers published for nominated genes has been curated manually. Occasionally, the published data are inconsistent or incomplete, and this may cause a paper to fail to be included in COSMIC. As of October 2007, COSMIC version 33 contained 55 fully curated genes, for which over 5000 individual papers were manually scrutinized. For the CGP data, the highest data quality is maintained by only releasing mutation data once the mutation is confirmed somatic by re-sequencing several times (“oversequencing”) with a matched normal sample when available (not for many cell lines) from the same individual.
Once curated, the information is configured to international standards before publication, most significantly for mutation and tumor classification data. Each gene in COSMIC has a single reference cDNA sequence, to which all mutations are localized; if the literature describes an alternative transcript, the mutations' coordinates are recalculated to COSMIC's equivalent before being additionally localized to the human genome, currently golden path NCBI36. Each mutation is given a numeric ID and two short descriptions. These descriptions use the HGVS recommendations on mutation nomenclature to generate concise yet precise definitions of the sequence change observed at both the nucleotide level (“c.” prefix) and amino acid level (“p.” prefix). Numerous international standards exist for the classification of tumor phenotypes, many of which focus on specialized phenotypes. To allow COSMIC to encompass as broad a range of cancer phenotypes as possible while maintaining highly detailed phenotype information, a new tumor classification nomenclature has been defined. For each sample curated, the published description is retained, but also translated into COSMIC's classification system, which is used for Web site navigation.
Literature data are considered releasable only once the entire paper has been fully cu-rated; the paper itself is a coherent and finite unit of curation. The CGP equivalent to a paper is a “study,” a group of related samples examined through a group of related genes. This means it is possible to combine papers or studies for subsequent meta-analyses of the data. These studies are usually ongoing, and each is at a different stage of completeness. Mutation data are released into COSMIC once confirmed. The absence of any mutations at a particular point does not indicate its sequence to be wild-type, but could simply mean it has yet to be fully examined.
Critical Parameters
COSMIC contains as much detail as can be extracted from each study curated; however, there are four key, “minimum-information-set” parameters. These key elements, while fairly obvious, will benefit from further clarification.
Sample
Every sample must have a name. Sometimes, however, the name is not published (the sample is merely one of a stated count), or it has an overly simple name such as “1” (32 entries) or a common name such as the cell line “PC-3” (36 entries). If a published sample has no name, it is given an anonymous reference, usually the database ID value (older data have an E or S prefix). For samples with simple or common names, the original name is kept, but given a new database entry; a pre-existing entry with the same sample name is never reused unless there is genotypic evidence that it is identical. In the case of PC-3, 36 entries are maintained: most are cell lines, but some are primary tumors, some are prostate cancers, some are lung, and the spread of analyzed genes varies widely. If a number of samples are stored with the same name, a link at the top of the Sample Summary page can be used to browse the full list. A sample is an instance of a portion of a tumor being examined for mutations. Potentially, a number of samples can be taken from a single tumor, and a number of tumors can be obtained from one individual, and each of these samples can vary slightly in their mutation spectra. While reports of such an extensive analysis are rare, COSMIC does contain such analyses and does retain the aggregations between sample/tumor/individual, although it has yet to be represented on the Web site. Primary tumors have been identified from many sources other than (the most usual) surgery and autopsy, including blood, stool, and urine. The exact source of the sample is recorded, since different interpretations may be placed on the analysis of a primary tumor than a cell line, the latter of which would be expected to have a higher number of sequence variants. Further features attributable to a sample, tumor, or individual (including cell lines) are often published, such as a tumor's karyotype, an individual's ethnicity, or the exact derivation of multiple samples from a single tumor. These are held and displayed (on the Sample Summary page) as Features, nonstandard extra details that do not fit within the usual data expected by COSMIC.
Tumor classifications
As described above, COSMIC uses a new standard of tumor classification, designed to encompass as much detail in as broad a range of phenotypes as possible. Sometimes the change from the published classification is minor or expected, such as “Bone: Femur; Osteosarcoma: Microcellular” becoming “Bone: Femur; Osteosarcoma: Small cell.” On other occasions, a substantial change may lead to difficulties finding the right data; for instance, a sample with the published phenotype “Brain: Cerebellum; Haemangioblastoma” will be translated in COSMIC to “Soft Tissue: Blood Vessel: Brain; Haemangioblastoma,” since the tumor originates in blood vessel, not brain-specific tissue. Of course, simply using “Haemangioblastoma” as a search term from the front page is acceptable and negates the need to know how to navigate to it. A spreadsheet of the relationships between published tumor classifications and their COSMIC counterparts is available from the Additional Information link on the COSMIC home page.
Genes
A gene in COSMIC refers to a single representative transcript for a given gene; splice variants are not available. The transcript accession number, usually an “NM_”-prefixed reference sequence, is versioned and does not necessarily refer to the latest version. Similarly, gene names are not necessarily the latest HUGO-approved identifiers, but should at least always exist in HUGO's list of synonyms for that gene name. Gene names, synonyms, and transcript accession numbers are all acceptable terms for searching COSMIC. Additionally, the cDNA sequence in COSMIC refers to the coding domains (CDS) only. Untranslated regions (UTRs) are only used in COSMIC where they have an impact in gene fusions, which may fuse a portion of the donor gene to the upstream region of the acceptor gene, altering its splicing or frame.
Mutations
As discussed, two types of mutation are represented in COSMIC: simple/small sequence changes (point mutations or small insertions, deletions, replacements) and complex genome rearrangements resulting in the fusion of two or more genes. These are treated slightly differently on the Web site. Simple mutations are drawn in the Histogram graphic, probably COSMIC's core page. Point mutations, mostly missense changes, are by far the most common variant type in COSMIC and are easy to locate on the gene sequence, forming the vertical axis of the graph. The other simple mutation types are represented singly underneath the graph, as the exact change more rarely coincides (the notable exception to this is EGFR, which generates a significantly vertically extended graphic). All the mutations in the graphic are also displayed in the Mutations table, divided into their different types, along with any fusion mutations. The latter cannot be drawn in the histogram graphic, which is focused on a single gene sequence. Each mutation (of every type) also has a details page, linked from the Histogram page. Fusions additionally have a summary page for each fused gene pair. Mutation counts and frequencies, as well as spectra, are detailed in the Histogram page for simple mutations, and in the fusion gene pair summary page for fusions. Mutation counts are presented throughout the Web site, as this is possibly the most important information the system provides. In all these cases, the Mutations count refers to all the mutations seen in all the samples for the selection chosen, such that if one sample has two mutations in one gene, it is counted twice. This value does not reflect the number of mutant samples or unique sequence changes (totals of these are usually in the release news item).
Anticipated Results
The results of a query depend entirely on the selection chosen during Web site navigation. Some examples have been selected to demonstrate the ease with which significant examinations of tumor mutability can be obtained.
Type of oncogene
The literature-curated genes have large amounts of mutation data in their histograms, and these can be interpreted immediately by the spread of mutations across the x axis and the numbers of types involved. Figure 10.11.14 presents examples of a clear gain-of-function (KRAS, Fig. 10.11.14A) and loss-of-function (PTEN, Fig. 10.11.14B) mutation spectrum. KRAS is a transcriptional activator, signaling to the MAP/ERK pathway to promote cellular growth (among other responses) upon binding to a GTP molecule. This signaling is inactivated by hydrolyzing the GTP to GDP, requiring a GAP helper molecule, and this interaction with GAP is where p.G12 is key. If p.G12 is mutated, GAP cannot deactivate KRAS signaling, leading to a huge overactivation of downstream elements promoting growth (Scheffzek et al., 1997). The COSMIC histogram reflects this, showing almost 90% of KRAS mutations to be missense changes at p.G12 (Fig. 10.11.14A). Conversely, PTEN is a tumor suppressor gene, negatively regulating cell cycle progression at G1 via the PI3 K signaling pathway (Mutter, 2001). Any sequence change that reduces PTEN's effectiveness has a resulting upregulating change on cell cycle activity, potentially promoting tumor formation. Again, this is reflected in COSMIC's histogram for the gene, which shows a wide spread of mutations of all types across its coding domain (Fig. 10.11.14B).
Figure 10.11.14.
COSMIC's histogram can give an immediate indication of a gene's oncogenic mutability. (A) Gain-of-function. The KRAS histogram shows only a single spike of a missense mutations at residue 12, known to be the protein's key mutant position, regulating its transcriptional activation capacity via the MAP/ERK pathway. Mutating p.G12 causes a gain-of-function overactivation of downstream growth promotion signals, resulting in tumorigenesis. (B) Loss-of-function. The PTEN histogram, conversely, shows a wide mutation spectrum, spread across the entire gene's length and including all mutation types. This clear loss-of-function mutation pattern is indicative of a tumor suppressor gene, whereby tumorigenesis occurs after the gene's growth-inhibiting effect is destroyed. For color version of this figure see http://www.currentprotocols.com.
Simple mining: Mutation spectrum analysis
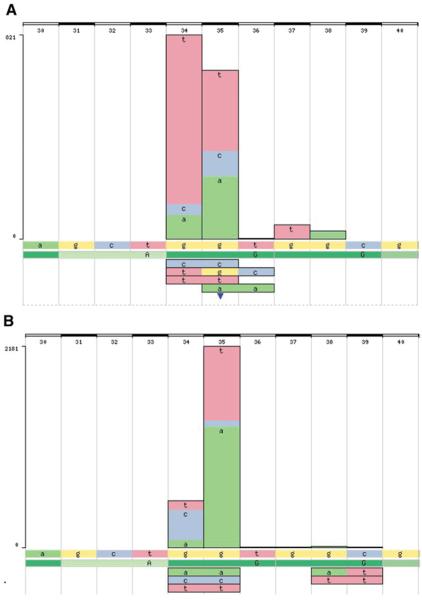
As described, KRAS is almost exclusively oncogenic when the p.G12 residue (and to a much lesser extent, p.G13) is mutated. However, there are a number of mutations possible at this position, and their relative frequencies vary significantly between different tissues. By zooming in at this position and viewing the histogram at the nucleotide level (±5 bp), major tissue-specific differences in the mutation spectrum become apparent (Fig. 10.11.15). KRAS has a very significant involvement in the generation of tumors of the pancreas; almost 60% of pancreatic tumors have a KRAS mutation. Figure 10.11.15B shows the mutation spectrum in KRAS for these tumors, defining the major mutations as c.35 g>a and c.35 g>t, the former more frequent. Nucleotide c.35 g accounts for 80% of mutations in the pancreas, whereas only 20% were found at c.34 g. The spectrum of mutations in lung (Fig. 10.11.15A) shows a very different pattern. At nucleotide c.35 g, the relative proportions of c.35 g>a and c.35 g>t mutations are reversed. More striking is the overrepresentation of nucleotide c.34 g, with mutations at c.35 g now representing only 42% of the total. Furthermore, over 80% of the c.34 g changes were g>t. This is easily explained by the polycyclic aromatic hydrocarbon carcinogens in tobacco smoke (the most frequent cause of lung tumors), for which g>t transversions are characteristic (Pfeifer et al. 2002). It is more difficult to explain the mutation preference for guanidine at c.34 in lung tumors versus that for guanidine at c.35 in pancreas tumors; hints can be found in the literature suggesting carcinogen-specific sequence context preferences (e.g., Shibutani et al. 1999).
Figure 10.11.15.
Using COSMIC's histogram to view the tissue-specific mutation spectra in the KRAS gene for (A) lung and (B) pancreas. For color version of this figure see http://www.currentprotocols.com.
Alternate views on the same data selection
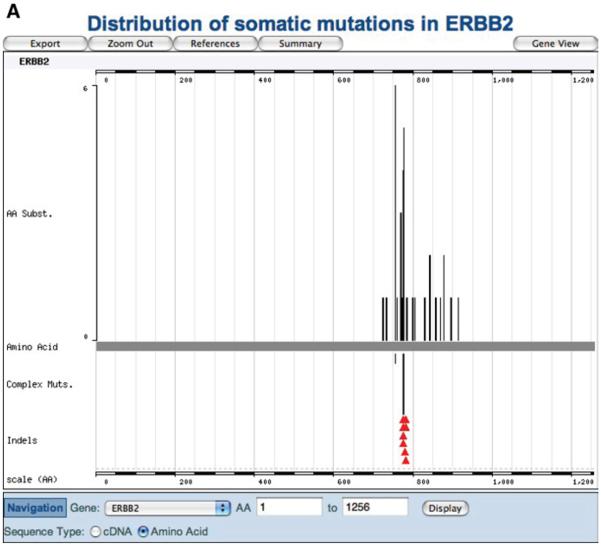
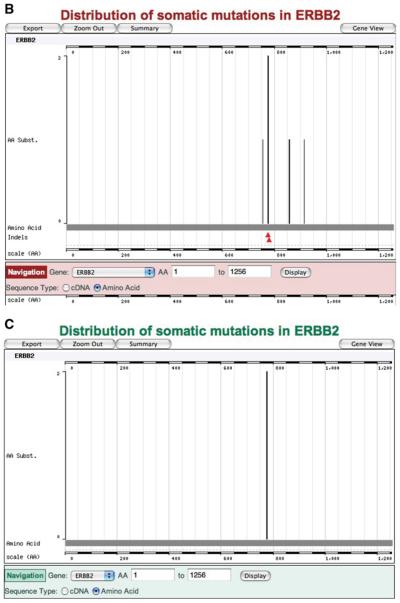
Many of the genes for which literature curation is complete also form part of CGP's analysis and data release; data from these sources can be viewed separately in differently colored Web sites. The dominant oncogene ERBB2 most clearly demonstrates this. By October 2007, 78 ERBB2 mutations were visible in the COSMIC Web pages (Fig. 10.11.16A); some of these data derived from the scientific literature, some from the CGP laboratories directly. Ten of these mutations were visible on COSMIC's red pages (the CGP re-sequencing site; Fig. 10.11.16B), indicating the data derived from the CGP, including published and prepublication information. However, only two of these mutations were found in the cell lines used in CGP's Cancer Cell Line Project, presented on COSMIC's green pages (Fig. 10.11.16C).
Figure 10.11.16.
The same data selection (a mutation summary of the ERBB2 gene, with domain structures removed) shows significantly different data when viewed between COSMIC's three color-coded Web sites: (A) the main COSMIC site (blue), (B) the CGP resequencing site (red), and (C) the Cancer Cell Line Project (green). For color version of this figure see http://www.currentprotocols.com.
Troubleshooting
Ascertainment bias
The mutation details curated from the literature are as accurate a reflection of each publication as possible. However, realistic (rather than simply precise) frequency values are difficult to calculate, since there are a number of ways that ascertainment bias in the literature may skew the aggregated data that COSMIC uses. The three most common of these are discussed.
1. Studies reporting exclusively negative data are rarely published. Many such studies are conducted, but they are usually considered of too little impact for the scientist to report or the publisher to print. This may have the effect of artificially raising mutation frequencies on the Web site. It is unknown what, if any, tissue-or gene-specific patterns exist to this bias.
2. Studies publishing mutation data infrequently examine the entire length of the gene for mutations, often focusing instead on known mutation hotspots. This is probably best demonstrated by KRAS. Since this gene's key mutation position is at p.G12 and (to a much lesser extent) p.G13, these two codons are often examined to the exclusion of the other 187 codons. This not only means that whole-gene mutation frequencies are skewed, it also caused another mutation hotspot to be missed entirely, until its identification 25 years after the original p.G12 hotspot was found (Edkins et al., 2006). Studies of tumor suppressor genes (e.g., PTEN) are less frequently so skewed, since they must examine a gene's entire length for random loss-of-function mutations.
3. A surprising proportion of papers reporting cancer mutations are incomplete, inconsistent, or difficult to interpret accurately. In order to maintain the highest data quality, these papers are removed from the curation process and simply presented in COSMIC as “Listed,” indicating that curation of was attempted but abandoned. By October 2007, over 5000 papers had been examined for curation, but almost 30% had to be simply “Listed” due to quality issues.
Unexpected result set
Once a query for the system has been selected and the results page (most often the Histogram page) has been reached, if the results are not quite as expected, a number of checks can be made to determine if a navigation error is to blame.
The Web-like workflow of COSMIC allows continued rounds of query specialization and redefinition, and it is thus important to check what is displayed before interpreting it. It is possible to view the histogram graphic or tables having defined a very specialized phenotype, zoomed into a specific region of the gene sequence, and requested nucleotide view rather than the default amino acid view (as in Fig. 10.11.15, for instance). It needs to be remembered that the tables below the graphic reflect only the data selected to draw it, so the tissue-specific mutation frequencies will be calculated only accounting for mutations between the zoomed nucleotides. Additionally, the number of mutations displayable between the amino acid and nucleotide views can change, as some papers only report the sequence changes at the peptide level, excluding nucleotide details; these are not accounted for in the nucleotide view since there are no bases for positioning them. Further rounds of phenotype specialization will automatically return to the default histogram view (amino acid, zoomed out). If the onscreen data look odd, the gene and phenotype details, together with any selected sequence coordinates, are presented onscreen for checking the current selection.
A further source of potential confusion is the presence of three COSMIC Web sites (Fig. 10.11.16). COSMIC's blue pages are selected by default. The red and green pages need to be specifically selected at the top level, but once selected, the data presentation is identical. If the expected data do not appear, check that the correct site has been chosen; this is easy, as the graphics and text are color coded. Generally, the green pages will have less mutation data than the red pages, and the red pages will have less than the blue. COSMIC blue overviews all the combined data from green, red, and literature curation (specified on a separate gold Web page).
New Releases
Recently COSMIC moved to a bimonthly release schedule (starting September 2007), in order to expedite the release of CGP data onto COSMIC's red site. As soon as mutation data have been confirmed as somatic in the CGP laboratories, it will be tagged for inclusion in the next bimonthly release. This improved data release policy will expedite the prepublication release of CGP's confirmed somatic mutation data.
COSMIC began in February 2004 with only four genes. Although growing slowly at first, the system now contains almost 4800 genes, with over 50000 mutations found in nearly 250000 tumor samples. As mentioned above, the data from CGP laboratories is being submitted as fast as it can be generated, and the curation of the literature has been so successful, that the genes from the Cancer Gene Census (Futreal et al., 2004) with simple mutations are now almost finished, completing the original aim of the COSMIC project. While simple mutation data will continue to be updated, in order for the project to continue to grow and be of consistently increased usefulness, curation of literature for gene fusions is now underway, with initial datasets already released.
Announcements about new developments in COSMIC are made occasionally, via an opt-in email list. To subscribe, visit http://lists.sanger.ac.uk/mailman/listinfo/cosmic-announce. Additionally, suggestions on improving the system are always welcomed at the email address cosmic@sanger.ac.uk.
Literature Cited
- Bergmann F, Aulmann S, Wente MN, Penzel R, Esposito I, Kleeff J, Friess H, Schirmacher P. Molecular characterisation of pancreatic ductal adenocarcinoma in patients under 40. J. Clin. Pathol. 2006;59:580–584. doi: 10.1136/jcp.2005.027292. [DOI] [PMC free article] [PubMed] [Google Scholar]
- Cooper DN, Stenson PD, Chuzhanove NA. The human gene mutation database (HGMD) and its exploitation in the study of human mutational mechanisms. Curr. Protoc. Bioinform. 2005;12:1.13.1–1.13.20. doi: 10.1002/0471250953.bi0113s12. [DOI] [PubMed] [Google Scholar]
- denDunnen JT, Antonarakis SE. Mutation nomenclature extensions and suggestions to describe complex mutations: A discussion. Hum. Mutat. 2000;15:7–12. doi: 10.1002/(SICI)1098-1004(200001)15:1<7::AID-HUMU4>3.0.CO;2-N. [DOI] [PubMed] [Google Scholar]
- Edkins S, O'Meara S, Parker A, Stevens C, Reis M, Jones S, Greenman C, Davies H, Dalgliesh G, Forbes S, Hunter C, Smith R, Stephens P, Goldstraw P, Nicholson A, Chan TL, Velculescu VE, Yuen ST, Leung SY, Stratton MR, Futreal PA. Recurrent KRAS codon 146 mutations in human colorectal cancer. Cancer Biol. Ther. 2006;5:928–932. doi: 10.4161/cbt.5.8.3251. [DOI] [PMC free article] [PubMed] [Google Scholar]
- Futreal PA, Coin L, Marshall M, Down T, Hubbard T, Wooster R, Rahman N, Stratton MR. A census of human cancer genes. Nat. Rev. Cancer. 2004;4:177–183. doi: 10.1038/nrc1299. [DOI] [PMC free article] [PubMed] [Google Scholar]
- Hamosh A, Scott AF, Amberger J, Bocchini C, Valle D, McKusik VA. Online Mendelian Inheritance in Man (OMIM), a knowledgebase of human genes and genetic disorders. Nucleic Acids Res. 2002;30:52–55. doi: 10.1093/nar/30.1.52. [DOI] [PMC free article] [PubMed] [Google Scholar]
- Mutter GL. PTEN, a protean tumor suppressor. Am. J. Pathol. 2001;158:1895–1898. doi: 10.1016/S0002-9440(10)64656-1. [DOI] [PMC free article] [PubMed] [Google Scholar]
- Petitjean A, Mathe E, Kato S, Ishioka C, Tavtigian SV, Hainaut P, Olivier M. Impact of mutant p53 functional properties on TP53 mutation patterns and tumor phenotype: lessons from recent developments in the IARC TP53 database. Hum. Mutat. 2007;28:622–629. doi: 10.1002/humu.20495. [DOI] [PubMed] [Google Scholar]
- Pfeifer GP, Denissenko MF, Olivier M, Tretyakova N, Hecht SS, Hainaut P. Tobacco smoke carcinogens, DNA damage and p53 mutations in smoking-associated cancers. Oncogene. 2002;21:7435–7451. doi: 10.1038/sj.onc.1205803. [DOI] [PubMed] [Google Scholar]
- Scheffzek K, Ahmadian MR, Kabsch W, Wiesmuller L, Lautwein A, Schmitz F, Wittinghofer A. The Ras-RasGAP complex: Structural basis for GTPase activation and its loss in oncogenic RAS mutants. Science. 1997;277:333–338. doi: 10.1126/science.277.5324.333. [DOI] [PubMed] [Google Scholar]
- Shibutani S, Fernandes A, Suzuki N, Zhou L, Johnson F, Grollman AP. Mutagenesis of the N-(Deoxyguanosin-8-yl)-2-amino-1-methyl-6-phenylimidazo[4,5-b]pyridine DNA adduct in mammalian cells. J. Biol. Chem. 1999;274:27433–27438. doi: 10.1074/jbc.274.39.27433. [DOI] [PubMed] [Google Scholar]
Internet Resources
- COSMIC home page. http://www.sanger.ac.uk/cosmic.
- Ensembl home page. http://www.ensembl.org.
- Cancer Gene Census. http://www.sanger.ac.uk/genetics/cgp/census.


