Peptide mass fingerprinting (PMF) is a powerful method of protein identification, based on the accurate mass determination of a generally incomplete mixture of peptides derived from proteolytic or chemical fragmentation. The protein is first isolated from a complex mixture, by one- or two-dimensional gel electrophoresis, possibly preceded by liquid phase chromatographic steps. After digestion, the peptide masses are usually acquired by MALDI-TOF mass spectrometry, after which the resultant peptide ‘fingerprint’ is used to search databases of theoretical digests (for recent reviews, see [1,2]).
Although PMF is a powerful technique, it is compromised by several factors, including, in the MALDI-TOF mass spectrum, the under-representation of Lys- terminated peptides relative to the more basic Arg-terminated peptides [3], the absence of very small or very large peptide products from the spectrum, the complete absence of some peptides from the fingerprint and the presence of peptides derived from other proteins that might be present in the sample. The last problem is particularly important in terms of the resolution of mixtures of proteins. Effective methods to deconvolute peptide maps deriving from more than one protein could obviate additional purification steps.
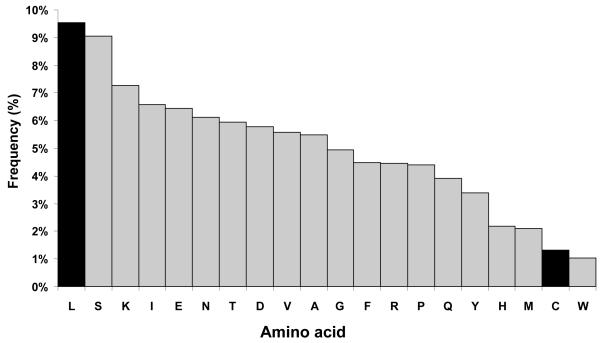
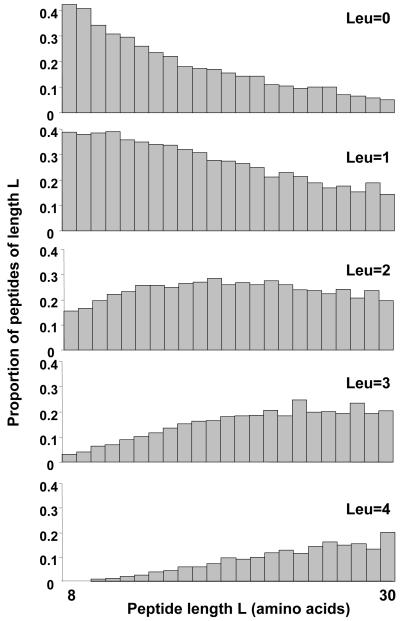
As part of a study of the dynamics of the yeast proteome, we have used leucine, labelled with the stable isotope deuterium, to label yeast proteins in vivo. All the metabolically stable hydrogen atoms in the amino acid have been labelled with deuterium (nonadeuterated leucine, abbreviated to d9-leu), and peptides generated from proteins labelled with deuterated leucine show peaks with masses that are 9n Da higher than the parent peptide, where n is the number of leucine residues. This shift in mass is sufficiently large to separate the natural isotope envelopes of the unlabelled and labelled peptides, facilitating identification. Leucine is the most abundant amino acid in the yeast proteome (Figure 1) and we estimate that of the approx. 350,000 tryptic peptides in the total yeast proteome, over 68% of those between 8 and 30 amino acids in length contain at least one leucine residue (Figure 2). Further, the ability to define, with clarity, n, (where n = 0, 1, 2 or more) provides clear identification of the number of leucine residues in each peptide and permits discrimination, through metabolic labelling, of the isobaric pair leucine and isoleucine. These additional data are readily submitted to some search engines, notably MASCOT [4] (http://www.matrixscience.co.uk) and thus can be used to enhance the specificity of searching. In this paper, we report the utility of leucine labelling as a means of enhancing protein identification in PMF.
Figure 1. Abundance of amino acids in the yeast proteome.
The 6452 yeast protein entries in SwissProt release 39 were analysed for the relative abundance of different amino acids. Each amino acid was expressed as a percentage of the total number of amino acids in the proteome.
Figure 2. Distribution of leucine residues in the yeast proteome tryptic peptides.
The set of theoretical tryptic peptides derived from the yeast proteome (with no cleavages at Arg-Pro and Lys-Pro) were analysed for the presence of different numbers of leucine residues. The data are expressed for peptides in the range of 8 to 30 amino acids, covering a mass range that is readily accessible to most MALDI-TOF mass spectrometers.
The haploid yeast strain BY4712 (ATCC 200875, MATa, leu2Δ0, [5]) which carries a mutation in the leu2 gene, was used throughout. Yeast were initially grown in glucose-limited chemostat culture as described previously [6] in a medium containing 100mg/L d0 or d10 D,L leucine at a dilution rate of 0.1h-1. Cells, (40ml at an A600 of ca. 1.5) were harvested at steady state, resuspended in 300μl 100mM HEPES, pH7.5 containing one EDTA-free protease inhibitor cocktail tablet/10ml (Roche Diagnostics Ltd) and lysed by vortexing with glass beads (6 × 45s with 45s cooling). DNase (6μl of lmg/ml, Sigma Chemical Co.) and RNase (2μl of lmg/ml, Sigma Chemical Co.) were added and the lysate was held at 4 °C for 1 h. The lysate was centrifuged at 6000rpm for 10 min and the supernatant assayed for protein (Coomassie plus protein assay, Pierce). Proteins (150μg) from labelled, unlabelled or a 50:50 mixture of labelled and unlabelled cells, were then solubilised in 8M urea, 2% (w/v) CHAPS for 1h at 37°C, before application to 13cm Immobiline pH 3-10 dry strips (AP Biotech) for in-gel rehydration (180Vh at 30V, 360Vh at 60V) and isoelectric focussing (500Vh at 500V, l000Vh at 1000V and 16000Vh at 8000V) using an IPGphor isoelectric focussing system (AP Biotech). Second-dimension analysis was by 12% linear SDS-PAGE followed by Coomassie blue staining. Gels were visually inspected, the same spot was excised from each gel and peptides were obtained by in-gel digestion and extraction using a MassPrep™ digestion robot (Micromass, Manchester UK). Peptides were analysed using a MALDI-TOF mass spectrometer (M@LDI™, Micromass, Manchester UK) covering the m/z range of 1000 to 4000 Th. The spectra were evaluated by manual searching using MASCOT.
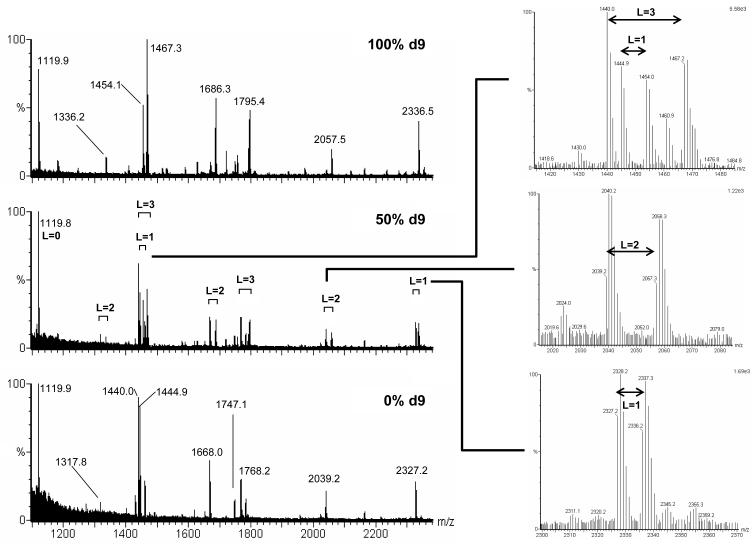
This strain of Saccharomyces cerevisiae, a leucine auxotroph (having an absolute requirement for leucine in the growth medium), when grown in the presence of 98 atom percent excess (APE) decadeuterated (d10) leucine, incorporated labelled leucine into proteins at a rate dictated by the rate of protein synthesis. Since the cells were grown in chemostat culture at a dilution rate of approx. 0.1h-1, the half time for replacement of the biomass was 6.9h, and after approx. 50h of growth, over 99% of the leucine in the protein would be labelled. When proteins from a 50h sample were resolved by 2-DE and analysed by mass spectrometry, the leucine containing peptides were heavier than their unlabelled counterparts by 9n Da, reflecting the metabolic lability of the alpha carbon-attached deuterium atom in d10 leucine, which would be rapidly exchanged for a hydrogen atom during transamination. The proteins in the supernatant fraction from a 6,000g clearing centrifugation step were mixed in approx. equal amounts with proteins from unlabelled cells grown in identical fashion, and the three preparations (100% d9, 50% d9 and 0% d9) were analysed by 2-DE and MALDI-TOF mass spectrometry. Typical spectra, from the spot corresponding to 3-phosphoglycerate kinase, are given in Figure 3.
Figure 3. Representative mass spectra obtained through labelling with nonadeuterated leucine.
A yeast leucine auxotroph was grown in the presence of 98 atom percent excess decadeuterated leucine, or in the presence of unlabelled leucine. A protein extract was prepared from each culture and after determination of the protein concentration, roughly equal amounts of protein from each preparation were mixed to form the 50% d9 sample. Each sample (100% d9, 50% d9 and 0% d9) was separated by 2DE, stained with Coomassie Blue and the same spot from each gel was excised and digested with trypsin. The MALDI-TOF mass spectra from 1100 Th to 2400 Th are given in the left-hand panels. Three sections of the spectrum from the 50% d9 mixture are shown in greater detail in the right-hand panels, defining pairs corresponding to peptides containing 1, 2 or 3 leucine residues. (The peptides show increments of 9 Th even though decadeuterated leucine was used as precursor because the alpha carbon hydrogen is metabolically labile via transamination).
After growth in the presence of d10 leucine, mass spectra comprised a mixture of peaks displaced from the ‘true’ masses by multiples of 9 Da, as well as undisplaced peptides that therefore contained no leucine residues. Unsurprisingly, these were predominantly the lower mass peptides in the spectra. Comparison with the spectra from cells grown in the presence of unlabelled leucine permitted clear identification of those peptides for which the mass shift (9n Da, where n = 1,2,3...) indicated the presence, and number of leucine residues. Indeed, similar information could usually be gleaned when the two preparations were mixed prior to PMF, yielding a single mass spectrum at 50% d9, where obvious doublets of peptides indicated leucine-containing residues (Figure 3). Close inspection of the spectrum allows resolution of interdigitated peaks, such as those seen between 1440 and 1470 Da, where a 27 Da separation (3 leucine residues) surrounds a second peptide containing a single leucine residue.
Because leucine is an abundant amino acid in Saccharomyces cerevisiae, (and indeed, most other proteomes - in chicken proteins for example, leucine is also the most abundant amino acid at 8.8 % of the total) most peptides (65% of the yeast proteome tryptic peptides) will contain at least one leucine residue. The reduction in search space that accrues from knowledge of the number of leucine residues varies with peptide length and the number of leucine residues (higher numbers are less frequent). When knowledge of the number of leucine residues extends to more than one peptide, the gain is multiplicative. The information on leucine content, when available for several peptides, can improve search efficiency quite substantially.
Not all search engines are able to include information on amino acid composition. The MASCOT search engine (http://www.matrixscience.com) includes this capability by appending a composition string after each peptide mass. For example, the peptides shown in Figure 3 would be entered as:
1119.9 comp(0[L])
1440.0 comp(3[L])
1668.0 comp(2[L])
2327.2 comp(l[L])
Using the MASCOT search engine, searches were performed using peptides obtained from the ‘mixture’ experiment described previously, permitting recovery of the peptide mass and the number of leucine residues (Table 1). These peptides were obtained in a typical, high-throughput proteomics experiment, and no particular effort was made to recalibrate each spectrum, which contain m/z values that are in error from the true values by between 60 and 190ppm. To test the search algorithm more stringently, we used two or three peptides to match against the S. cerevisiae database, or the entire SwissProt database. Additionally, the importance of search mass tolerance was explored using three mass accuracy values, of 50, 200 and 500ppm. Use of two peptides failed to identify the protein as first choice when searched against the entire SwissProt database. However, the correct match scored first at 200ppm and 500ppm mass accuracy when composition data were included, but not when these data were omitted. The gain in the MOWSE score when additional composition data were included was considerable, (although none of these scores reached MASCOT’s probabilistic definition of a ‘significant’ match). With three peptides, a high probability match was obtained at 200ppm against the entire SwissProt database and against the yeast database was also obtainable at 500ppm. In all three matches, the improvement obtained by inclusion of composition data is readily apparent, moving all three search results from a non-significant to a significant match.
Table 1. Search gain using composition information.
A subset of peptides taken from the spectra in Figure 3 were used to search the S. cerevisiae proteome database or the entire protein database, using different mass accuracy values (PPM). Table entries shaded in grey are those defined as significant by MASCOT. The search terms are those required by MASCOT (see text).
| PHOSPHOGLYCERATE KINASE (EC 2.7.2.3).- Saccharomyces cerevisiae | ||||||
|---|---|---|---|---|---|---|
| Observed | Mr(expt) | Mr(calc) | Delta | Start | End | Miss |
| 1317.80 | 1316.79 | 1316.73 | 0.06 | 404 - | 415 | 1 |
| 1440.00 | 1438.99 | 1438.81 | 0.18 | 108 - | 121 | 0 |
| 1768.20 | 1767.19 | 1767.00 | 0.19 | 197 - | 213 | 0 |
| Peptide search terms | Full database | Yeast | ||||
|---|---|---|---|---|---|---|
| PPM | Result | Score | PPM | Result | Score | |
|
1768.2 comp(3[L])
1440.0 comp(3[L]) |
200 | 3rd | 48 | 200 | 1st | 48 |
|
1768.2
1440.0 |
200 | - | - | 200 | 1st | 29 |
|
1768.2 comp(3[L])
1440.0 comp(3[L]) |
500 | 8th | 42 | 500 | 1st | 41 |
|
1768.2
1440.0 |
500 | - | - | 500 | 3rd | 23 |
| Peptide search terms | Full database | Yeast | ||||
|---|---|---|---|---|---|---|
| PPM | Result | Score | PPM | Result | Score | |
|
1317.8 comp(2[L])
1768.2 comp(3[L]) 1440.0 comp(3[L]) |
200 | 1st | 76* | 200 | 1st | 70* |
|
1317.8
1768.2 1440.0 |
200 | 2nd | 51 | 200 | 1st | 44 |
|
1317.8 comp(2[L])
1768.2 comp(3[L]) 1440.0 comp(3[L]) |
500 | 1st | 60 | 500 | 1st | 60* |
|
1317.8
1768.2 1440.0 |
500 | - | - | 500 | 1st | 35 |
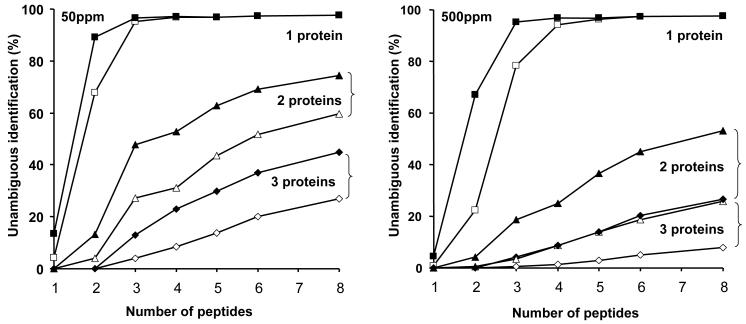
The demonstration of gain from this single example, chosen at random from our dataset, can be generalised by simulation studies. For this analysis, we chose a larger database, comprising in excess of 18,000 proteins in the C. elegans proteome (Figure 4). Calculations were performed on a four-processor R12000 Silicon Graphics Origin 200 Server using an implementation of our protein database search software pepMapper (http://wolf.bms.umist.ac.uk/mapper). The software reads a FASTA- formatted input file containing the protein sequences and reports all proteins that contain at least one peptide consistent with the search data. Simulations were carried out for between 20,000 and 100,000 steps depending on the complexity of the calculation, for both single proteins and protein mixtures. For a simulation step, a random protein (or proteins) was selected, followed by a fixed number of randomly chosen peptides from that protein, ensuring at least one peptide from each protein was selected. Simulations were run for between 1 and 8 peptides, and for 1, 2 or 3 proteins, considering monoisotopic masses, up to 1 missed tryptic cleavage and either 50 or 500 ppm measure mass accuracy. The masses of selected peptides, along with any attendant search criteria, were supplied to the pepMapper algorithm. For simulations considering protein mixtures, an iterative search protocol was implemented where matching peptides to the top-scoring protein were removed from the search list in a stepwise fashion until all masses were accounted for. The success of each simulation was assessed for different numbers of proteins and peptides, with and without the inferred leucine information, as the percentage unambiguous identification. This is the percentage of times in the simulation that the true protein (or proteins) are consistent with all the search data.
Figure 4. Theoretical analysis of protein identification using additional data defining number of leucine residues.
This analysis was conducted using the C. elegans proteome. Limited numbers of peptides, derived from one, two or three proteins, were used to search the proteome database either without (open symbols) or with (closed symbols) additional information concerning the number of leucine residues. The data were searched at a high (50ppm) and low (500ppm) mass tolerance.
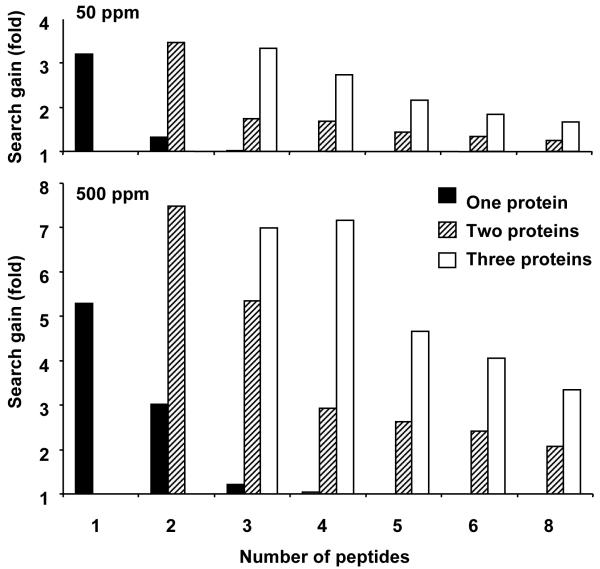
The modelling data explored the ability to identify a protein in isolation, or in a mixture of two or three proteins (a typical proteome experiment that deals with native complexes). At a tolerance of 50ppm, a single protein can be readily identified by one or two peptides. The gain in protein identification through inclusion of composition data is three-fold for a single peptide, but falls proportionately as the overall search becomes highly efficient at two or more peptides. When mixtures of two or three proteins are considered, the composition data has the most dramatic effect with fewer peptides, but maintains a two-fold improvement throughout the analysis. At a mass accuracy of 500ppm, the effect of composition data is easier to discern. For two peptides derived from a single protein, leucine composition information permits a three-fold gain in unambiguous identification. As increased numbers of peptides are used in the search pattern, the gain falls off, because the identification is already highly successful. When a mixture of two proteins is simulated, the gain is more pronounced. The search gain efficiency is summarised in Figure 5. As can be seen, the composition data have the largest effect (up to eight-fold search gain) at high mass tolerance values and when there are multiple proteins contributing peptides to the mixture.
Figure 5. Gains in search efficiency deriving from data defining number of leucine residues in peptides.
Search gain is defined as (identification with leucine data/identification without leucine data). This parameter was calculated for mixtures of one, two or three proteins, for up to eight peptides derived from the mixture, and at two levels of mass accuracy.
Metabolic labelling with stable isotope amino acids has considerable potential for improving protein identification by peptide mass fingerprinting. The metabolic oxidation and utilisation of leucine means that the labelling protocol might be more complex in intact animals or in animal cell lines, but the fact that leucine is an essential amino acid, and that the d10 derivative is relatively inexpensive, means that it might be readily adopted for other cell culture systems. Since the goal is to incorporate adequate ‘heavy’ leucine into cellular proteins, there is no requirement to replace all the amino acids with the labelled derivative, as labelling efficiencies between 20% and 80% would be amenable to analysis, since both the light’ and ‘heavy’ peptides would be discernible. Thus, the labelling window can be kept short to diminish the possibility of reutilisation of stable isotope following amino acid oxidaton. If necessary, it would be relatively simple to co-analyse samples from a labelled and an unlabelled culture to confirm that peptides are indeed the labelled derivatives (rather than a peptide that is fortuitously 9n Da heavier).
There have been other studies that have employed ‘heavy’ amino acids in proteome analysis. Veenstra and colleagues labelled Escherichia coli proteins with decadeuterated leucine [7] and measured the increase in mass of the intact proteins by Fourier Transform Ion Cyclotron Resonance (FTICR) mass spectrometry. The difference in mass between the ‘heavy’ and light’ forms of the protein was then used to calculate the number of leucine residues. However, we note that these calculations assumed a mass difference of 10Da per leucine residue, although in our studies, we have observed the complete metabolic lability of one deuterium atom in yeast, presumed to be the alpha carbon deuterium, lost by transamination. It is possible that this process does not occur in E. coli (although that would be surprising) or that leucine flux in the bacterium is dramatically different from that in S. cerevisiae. Such uncertainties emphasise the importance of monitoring the metabolic fate of the labelled amino acids in the system under investigation. Chen and colleagues [8] used dideuterated glycine or trideuterated methionine to improve protein identification in PMF. However, the small mass shifts attendant upon incorporation of these amino acids mean that the ‘heavy’ and ‘light’ peptides have overlapping natural isotope envelopes, making resolution of the two peaks particularly difficult at masses greater than 2000 Da. The choice of d9-leucine means that ‘heavy’ and ‘light’ peaks, even for peptides containing a single leucine residue, are readily resolved over the useable mass range of most MALDI-TOF mass spectrometers.
Acknowledgments
This work was supported by the BBSRC (project grant 26/G13495 to RJB, SJG & SGO and the COGEME (Consortium for the Functional Genomics of Microbial Eukaryotes) programme (SGO, Co-ordinator). We are grateful to Prof Jane Hurst for assistance with the analysis of the yeast peptidome.
References
- [1].Mann M, Hendrickson RC, Pandey A. Annu. Rev. Biochem. 2001;70:437–473. doi: 10.1146/annurev.biochem.70.1.437. [DOI] [PubMed] [Google Scholar]
- [2].Gevaert K, Vandekerchove J. Electrophoresis. 2000;21:1145–1154. doi: 10.1002/(SICI)1522-2683(20000401)21:6<1145::AID-ELPS1145>3.0.CO;2-Z. [DOI] [PubMed] [Google Scholar]
- [3].Brancia FL, Butt A, Beynon RJ, Hubbard SJ, Gaskell SJ, Oliver SG. Electrophoresis. 2001;22:552–559. doi: 10.1002/1522-2683(200102)22:3<552::AID-ELPS552>3.0.CO;2-C. [DOI] [PubMed] [Google Scholar]
- [4].Perkins DN, Pappin DJ, Creasy DM, Cottrell JS. Electrophoresis. 1999;20:3551–3567. doi: 10.1002/(SICI)1522-2683(19991201)20:18<3551::AID-ELPS3551>3.0.CO;2-2. [DOI] [PubMed] [Google Scholar]
- [5].Brachmann CB, Davies A, Cost GJ, Caputo E, Li J, Hieter P, Boeke JD. Yeast. 1998;14:115–132. doi: 10.1002/(SICI)1097-0061(19980130)14:2<115::AID-YEA204>3.0.CO;2-2. [DOI] [PubMed] [Google Scholar]
- [6].Baganz F, Hayes A, Farquhar R, Butler PR, Gardner DC, Oliver SG. Yeast. 1998;14:1417–1427. doi: 10.1002/(SICI)1097-0061(199811)14:15<1417::AID-YEA334>3.0.CO;2-N. [DOI] [PubMed] [Google Scholar]
- [7].Veenstra TD, Martinovic S, Anderson GA, Pasa-Tolic L, Smith RD. J. Am. Soc. Mass Spectrom. 2000;11:78–82. doi: 10.1016/S1044-0305(99)00120-8. [DOI] [PubMed] [Google Scholar]
- [8].Chen X, Smith LM, Bradbury EM. Anal. Chem. 2000;72:1134–1143. doi: 10.1021/ac9911600. [DOI] [PubMed] [Google Scholar]


