

Abstract
The sensitivity of a population of neurons, and therefore the amount of sensory information available to an animal, is limited by the sensitivity of single neurons in the population and by noise correlation between neurons. For decades, therefore, neurophysiologists have devised increasingly clever and rigorous ways to measure these critical variables (Parker and Newsome, 1998). Previous studies examining the relationship between the responses of single middle temporal (MT) neurons and direction-discrimination performance uncovered an apparent paradox. Sensitivity measurements from single neurons suggested that small numbers of neurons may account for a monkey's psychophysical performance (Britten et al., 1992), but trial-to-trial variability in activity of single MT neurons are only weakly correlated with the monkey's behavior, suggesting that the monkey's decision must be based on the responses of many neurons (Britten et al., 1996). We suggest that the resolution to this paradox lies (1) in the long stimulus duration used in the original studies, which led to an overestimate of neural sensitivity relative to psychophysical sensitivity, and (2) mistaken assumptions (because no data were available) about the level of noise correlation in MT columns with opposite preferred directions. We therefore made new physiological and psychophysical measurements in a reaction time version of the direction-discrimination task that matches neural measurements to the actual decision time of the animals. These new data, considered together with our recent data on noise correlation in MT (Cohen and Newsome, 2008), provide a substantially improved account of psychometric performance in the direction-discrimination task.
Introduction
Psychophysical performance depends on several critical features of the underlying neural pathways, including the sensitivity of single neurons, the amount of noise correlation between sensory neurons, and the amounts of noise (if any) introduced at the pooling and decision stages. An early attempt to measure these factors directly in behaving animals involved comparing psychophysical and neural sensitivity to motion direction; electrophysiological recordings were obtained from the middle temporal area (MT) of extrastriate cortex while monkeys discriminated opposed directions of motion in a noisy motion stimulus (Newsome et al., 1989; Zohary et al., 1994). These authors reported that the sensitivity of MT neurons is, on average, equivalent to psychophysical sensitivity, raising the possibility that performance is based on the responses of small numbers of neurons (Barlow, 1972). However, trial-to-trial correlation between fluctuations in neural responses and the animal's choices (choice probability) was weak, suggesting that performance is based on signals pooled from many neurons (Britten et al., 1996). These data can be reconciled if substantial noise is introduced at the decision stage (Shadlen et al., 1996).
Although this set of studies has been very influential, it and many others like it (Celebrini and Newsome, 1994; Hernández et al., 2000; Prince et al., 2000; Recanzone et al., 2000; Uka and DeAngelis, 2003, 2004; Barberini et al., 2005) suffers from the key weakness that the time course of the neural measurements was not well matched to the time course of perceptual decisions. Neural measurements were made during a 2 s viewing interval, but recent experiments suggest that monkeys avail themselves of only a few hundred milliseconds of stimulus exposure in making decisions in this task (Roitman and Shadlen, 2002; Cohen and Newsome, 2008; Kiani et al., 2008). Experimental estimates of neural sensitivity may therefore be artificially inflated relative to the measured psychophysical sensitivity. Indeed, a recent reaction time study by Cook and Maunsell (2002) indicates that, in a motion detection task, MT neurons are substantially less sensitive relative to psychophysical sensitivity than previously thought.
A second weakness of the original MT studies is that their models assumed that neurons in columns encoding different motion directions were uncorrelated, which had not been tested directly (Zohary et al., 1994; Shadlen et al., 1996). We found recently that the trial-to-trial noise in stimulus-evoked responses are in fact positively correlated for all MT neurons with a common spatial receptive field (Cohen and Newsome, 2008), which greatly affects estimates of population sensitivity.
Our study assesses the direction information available in MT by measuring the sensitivity of single neurons on the timescale of perceptual decisions using a reaction time task. To relate the physiological measurements to performance, we adapted the model of Shadlen and colleagues to incorporate our updated measurements of neural sensitivity as well as new data on noise correlation (Cohen and Newsome, 2008). We found that, on average, even optimally tuned MT neurons are considerably less sensitive than the monkey, and the updated model now provides a better account of psychophysical performance.
Materials and Methods
The subjects in this experiment were two adult male rhesus monkeys (Macaca mulatta, weighing 13–15 kg). Before electrophysiological recordings, we implanted each animal with a scleral search coil for measuring eye movements (Judge et al., 1980), a head-holding device (Evarts, 1968), and a recording cylinder (Crist Instruments) that provided access to MT. The monkeys performed a discrimination task for liquid rewards while seated in a primate chair with their heads restrained. All surgical and behavioral procedures conformed to guidelines established by the National Institutes of Health and were approved by the Institutional Animal Care and Use Committee of Stanford University.
Behavioral task and visual stimuli
All visual stimuli were presented on a cathode ray tube monitor positioned 57 cm from the monkey's eyes. For the primary experiments, we trained two monkeys to perform a reaction time version of a two-alternative, forced-choice (2AFC) direction-discrimination task in which monkeys discriminated opposed directions of motions in a stochastic random-dot display (Roitman and Shadlen, 2002) (Fig. 1a). The monkeys fixated a central spot of light for 200 ms (“fixation period”), and then two saccade targets appeared (“target period”), each corresponding spatially to one of the two opposed directions of motion. The duration of the target period was selected from a truncated exponential distribution (minimum of 150 ms, mean of 900 ms, maximum of 1800 ms) to discourage anticipation of the stimulus onset (Roitman and Shadlen, 2002). The motion stimulus then appeared (“stimulus period”) in the receptive field of the MT neuron under study (see below, Recording methods). Once the stimulus period began, the monkey was free to indicate its direction judgment at any time by making a saccadic eye movement to one of the two targets flanking the stimulus. When the monkey's eye left the fixation point, the fixation point and motion stimulus disappeared, leaving only the two saccade targets present on the screen. To discourage rapid guessing, on correctly completed trials, the reward was delivered a minimum of 800 ms after the onset of the stimulus (for reactions times shorter than 800 ms) or immediately after the saccade.
Figure 1.
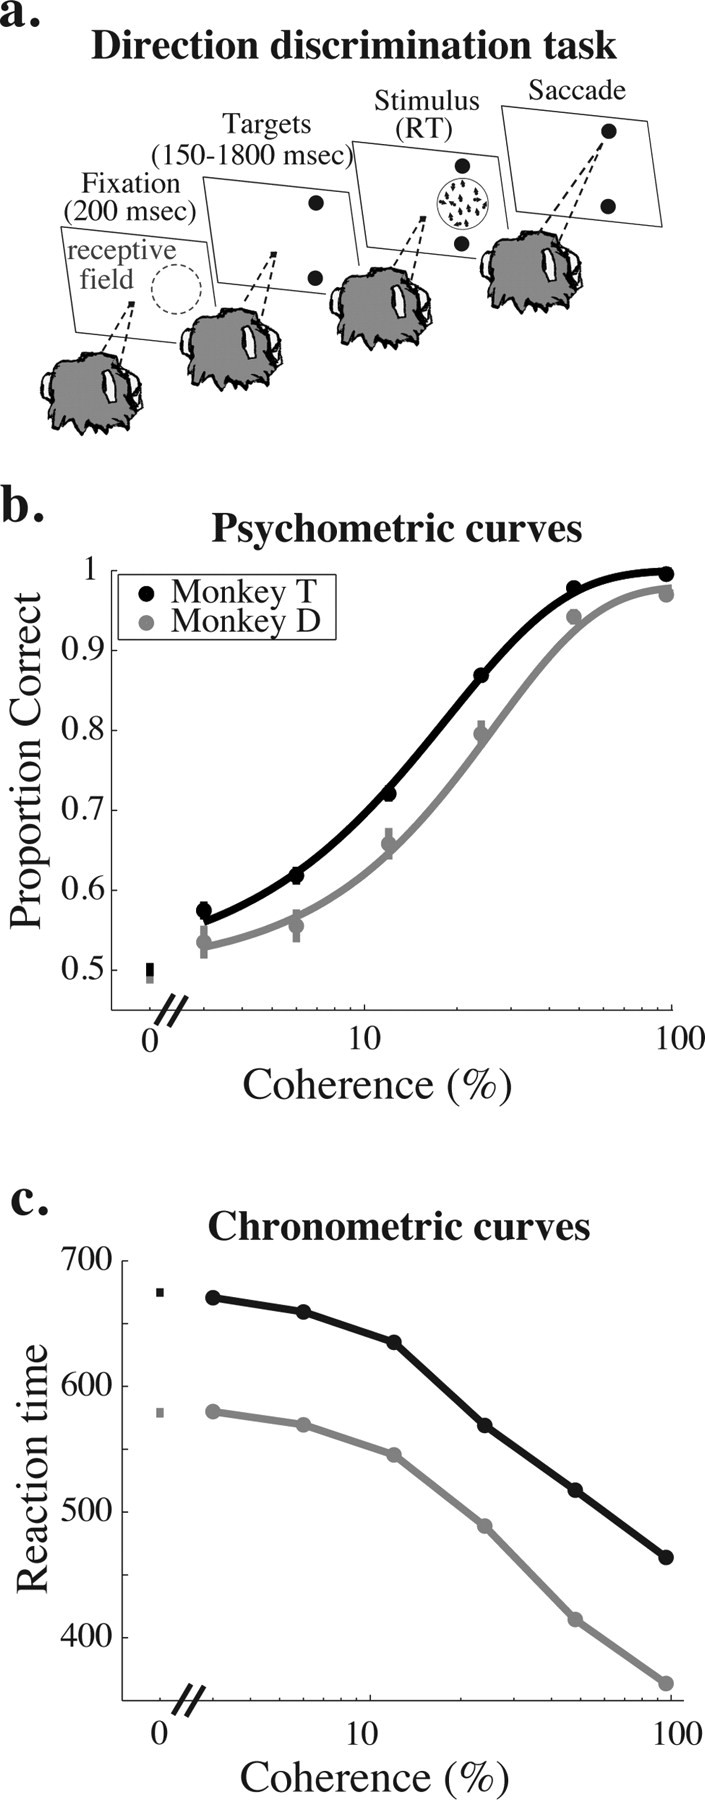
Task and behavioral data. a, Schematic diagram of the behavioral task. In each experiment, we recorded from a well isolated single MT neuron whose receptive field is schematized by the region enclosed by the blue dashed circle in the first panel. A trial begins when the monkey fixates a central spot of light (1st panel, fixation period). After 200 ms, two saccade targets appear, the position of which indicates the axis of motion to be discriminated, which was typically the preferred-null axis of the neuron under study (2nd panel, target period). After a random interval (drawn from a truncated exponential with a mean of 1100 ms, minimum of 150 ms, maximum of 1800 ms), the stimulus appears in the receptive field of the neuron under study (3rd panel, stimulus period). The monkey is free to indicate his direction judgment with a saccade to the appropriate target at any point after the stimulus appears. The stimulus and fixation point disappear as soon as the eyes leave the fixation window (4th panel), and reaction time (RT) is defined as the time the stimulus was on the screen. b, Mean psychometric performance as a function of coherence for monkey T (black) and monkey D (gray). Mean performance data are based on all trials that contributed neural data to subsequent analyses (for inclusion criteria, see Materials and Methods). Error bars represent SEM. c, Mean reaction time as a function of coherence for monkey T (black) and monkey D (gray). Data are based on the same set of behavioral trials as in b. Error bars represent SEM.
We only included trials for analysis if they met all of the following criteria: (1) the monkey viewed the stimulus for at least 150 ms without his eyes leaving the fixation point, (2) the monkey initiated a saccade within 3 s of stimulus onset, and (3) the monkey made a single saccade to one of the targets immediately after breaking fixation. During the fixation, target, and stimulus periods, the monkey was required to maintain fixation within a circular window (1–1.5° radius). On successfully completed trials, we defined the monkey's reaction time as the time from the onset of the stimulus to the time the monkey's eye left the fixation window.
We used stochastic random-dot stimuli that were similar to those used in many previous studies (Britten et al., 1992; Roitman and Shadlen, 2002). We varied the strength of motion, and therefore the difficulty of the task, by changing the probability that, on a given frame, a given dot was replotted in apparent motion in one of two opposite directions (motion coherence). In each experiment, we selected a range of motion coherences that spanned psychophysical threshold, and motion direction and coherence were randomly interleaved from trial to trial. In most experiments, there were twice as many 0% coherence trials as any other single coherence. The monkeys received liquid rewards for correct choices on trials with nonzero coherence. For 0% coherence (random-motion noise) trials, the monkeys were rewarded randomly with a probability of 0.5.
To prevent the monkey from using low-level visual cues to solve the task (e.g., when a dot appears in the top right-hand corner of the screen, the correct answer is left), we used a new seed for the random-number generator on each trial. Therefore, the exact placement of random dots over space and time differed on each trial, resulting in small spatiotemporal fluctuations in motion energy that were unique to each trial. The net motion energy in these fluctuations is zero on average, but slight fluctuations can in fact influence psychophysical judgments on individual trials (Bair, 1995; Neri and Levi, 2006; Kiani et al., 2008) and thereby influence choice probability measurements. For a subset of neurons recorded from monkey T, therefore, we used the same random-number seed on all 0% coherence trials to control for effects of stimulus variance.
Recording methods
We recorded extracellular action potentials from 265 well isolated, direction-selective MT neurons on tungsten microelectrodes using standard techniques (Britten et al., 1992). The neurons were recorded from four hemispheres in two monkeys (185 neurons from monkey T and 80 neurons from monkey D). At the beginning of each recording session, we inserted a stainless steel guide tube 1–3 mm past the dura. We advanced either one or two microelectrodes through the guide tube into the brain using a hydraulic microdrive (Narishige). We identified MT by the pattern of gray and white matter transitions during descent, the topographic organization of MT, and the well known electrophysiological properties of MT neurons. We isolated neurons through a spike waveform template-matching algorithm (EXPO; Peter Lennie) or a dual window discriminator (Bak Electronics).
After isolating a neuron, we qualitatively measured the spatial receptive field of the neuron, and then, for most experiments, we quantitatively measured a direction-tuning curve by displaying fully coherent motion in eight different directions (500 ms exposure) while the monkey fixated a small spot of light. We fit a circular Gaussian function to the firing rate data to determine the preferred direction of the neuron. We selected strongly direction-selective neurons for study, our criterion being that distributions of responses to 100% coherent motion in the preferred and opposite (null) direction were nonoverlapping. We chose this criterion so that our results could be directly compared with previous studies that used the same criterion (Britten et al., 1992, 1996).
The main results in Figures 2–6 are from experiments in which we recorded from a single neuron on a single microelectrode (85 experiments from monkey T and 30 experiments from monkey D). In these experiments, we chose stimulus parameters such that the neuron under study would be ideally suited to perform this direction discrimination. We placed the stimulus in the receptive field of the neuron, and the monkey discriminated motion in the preferred direction of the neuron from motion in its null direction. The coherent dots moved at the preferred speed of the neuron. We included for analysis all neurons for which the monkey completed at least 30 trials per direction and coherence (mean of 51 trials for monkey T, 46 trials for monkey D).
Figure 2.

Neurometric (gray) and psychometric (black) curves for four example experiments. a, A rare experiment in which neurometric and psychometric thresholds were not significantly different. b, c, More typical examples in which psychometric performance was significantly better than neurometric performance. d, In a few experiments, the neuron failed to completely differentiate preferred from null motion even at the highest coherence.
Figure 3.
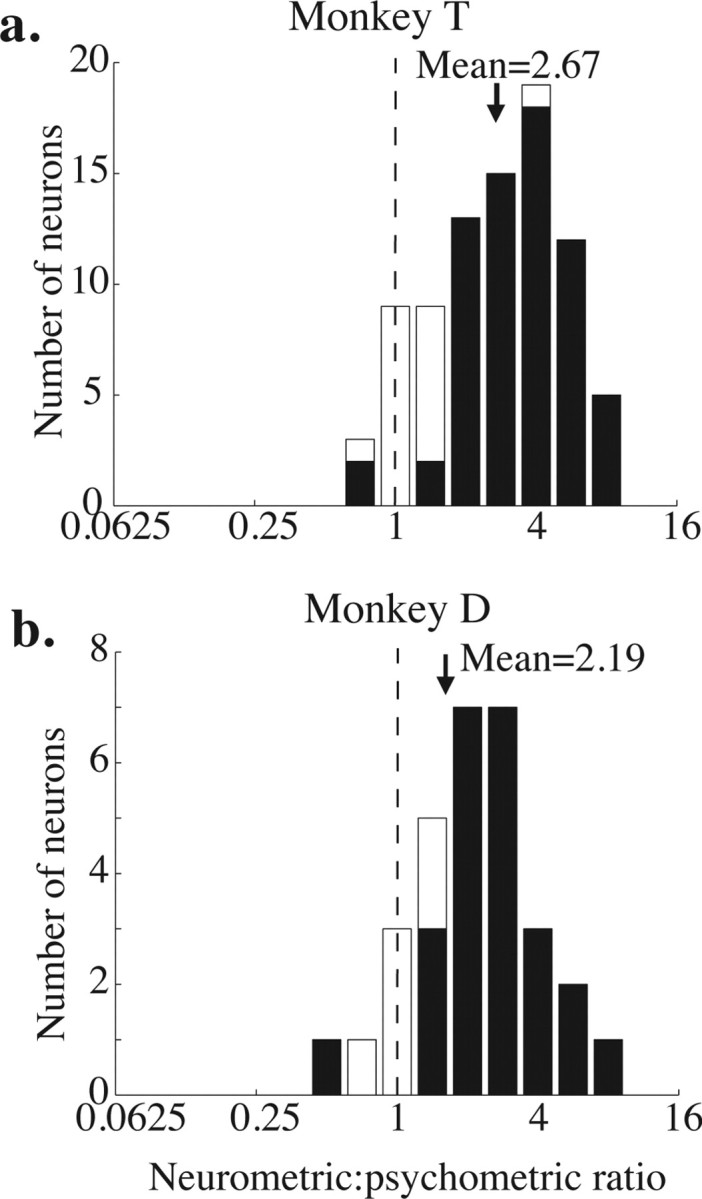
Frequency histograms of neurometric to psychometric ratios (neurometric threshold divided by psychometric threshold) for each monkey. The black arrow indicates the geometric mean of each distribution. The means of both distributions are significantly >1 (p < 0.01, t test on the log-transformed ratios). a, Monkey T. b, Monkey D.
Figure 4.
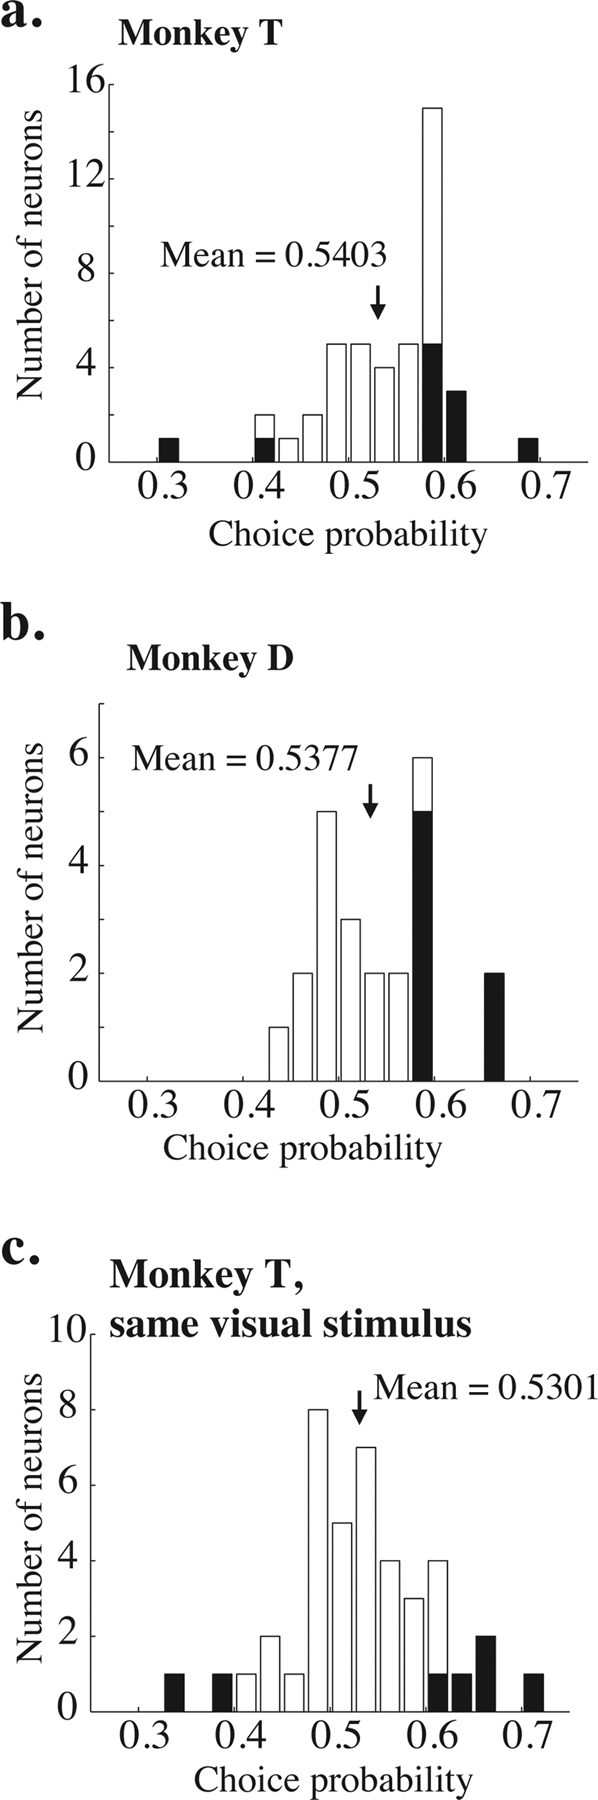
Frequency distributions of measured choice probabilities. a, Choice probabilities measured on 0% coherence trials for 44 neurons in monkey T; a different random-number seed was used on each trial. The shaded bars indicate experiments for which the choice probability was significantly different from 0.5 (p < 0.05, bootstrap test described in Materials and Methods). The black arrow indicates the mean of the distribution. The mean is significantly >0.5 (t test, p < 0.05). b, Same, for 30 neurons in Monkey D. Again, the mean is significantly >0.5 (t test, p < 0.05). c, Same, for 41 neurons in monkey T, but using the same random-number seed for every trial in a given experiment. The mean remains significantly >0.5 (p < 0.05).
Figure 5.

Time course of choice probability aligned to the onset of the stimulus (left) and the initiation of the saccade (right). The thickness of the line represents the mean ± SE a, Monkey T. b, Monkey D.
Figure 6.

Frequency histogram of the correlation between firing rate and reaction time for 0% coherence trials in which the monkey reported motion in the preferred (upward bars) and null (downward bars) directions of a neuron. The shaded bars indicate individual experiments for which this correlation was significantly different from 0 (Pearson's correlation, p < 0.05). The mean of the distribution of correlation coefficients for preferred direction choices is significantly <0 (t test, p < 0.001). The mean of the distribution for null direction choices is not significantly different from 0 (t test, p = 0.56).
The “off-axis” results in Figure 7 come from data collected primarily for experiments reported previously (Cohen and Newsome, 2008) in the same two monkeys as the data presented here. In these experiments, we clamped two tungsten microelectrodes (0.8–3 MΩ; FHC) together such that their tips were separated slightly in depth (range of ∼200–800 μm). We recorded from pairs of single neurons, one on each electrode, with primarily overlapping receptive fields, and we placed the stimulus in the approximate union of the two receptive fields. We picked the stimulus speed that best drove both neurons.
Figure 7.
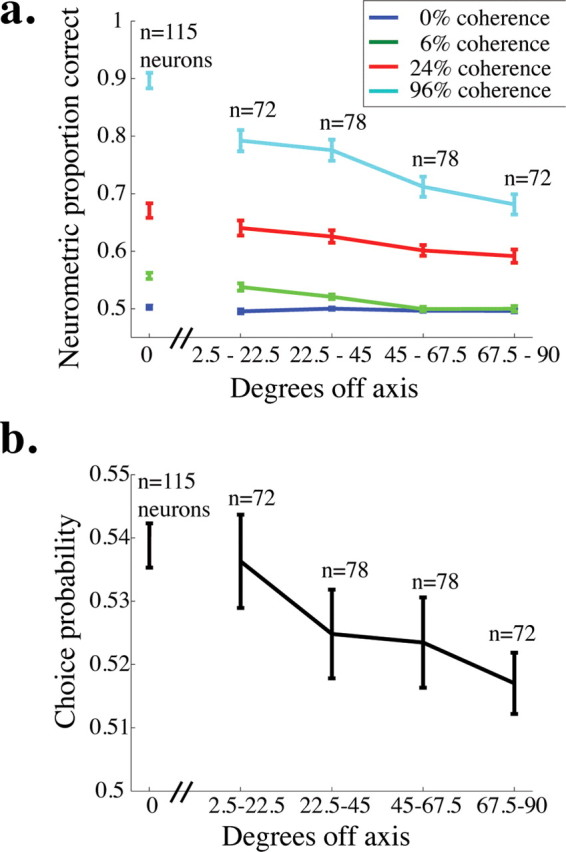
Neurometric performance and choice probability for off-axis neurons. a, Mean neurometric performance is plotted as a function of the angle between the preferred direction of the neuron and the axis of motion being discriminated for four example coherences. The break in the x-axis after 0° off axis indicates that the data for on-axis neurons were collected in a separate set of experiments from the off-axis neurons (see Materials and Methods). Error bars represent SEM. b, Mean choice probability is plotted as a function of the angle between the preferred direction of the neuron and the axis of motion being discriminated (choice probability was measured for only 0% coherence trials). Conventions as in a.
The monkey performed the usual 2AFC motion discrimination task, but the axis of discrimination did not correspond to the preferred-null axis of either neuron. Instead, on randomly interleaved trials, the monkey discriminated motion about either the axis that bisected the angle between the preferred directions of the neurons under study or the orthogonal axis. Therefore, for each neuron, we have data for two angles between the preferred direction of the neuron and the motion axis, so each neuron contributes twice to the results in Figure 7. The difference in the preferred directions of the two neurons ranged from 3° to 178° in this dataset, corresponding to 1° to 89° off axis.
Data analysis
Time period for calculating spike rates.
A primary goal of this study was to calculate the sensitivity and choice probability of MT neurons during the reaction time direction-discrimination task and compare these results with sensitivities calculated during the fixed duration version of the same task (Britten et al., 1992, 1996). We therefore adapted the methods used to calculate neural sensitivity and choice probability in the previous studies to the data from our reaction time task.
In the fixed duration task (Britten et al., 1992), each trial had the same length, so neural sensitivity and choice probability were calculated based on spike counts from the entire 2 s stimulus presentation period. The fact that trials in a reaction time task have different durations presents some difficulties for data analysis. For example, the visual transient, which is a period of characteristically high firing rate near the beginning of the stimulus presentation, will contribute more to the firing rate for short trials than for long trials. Also, the “motor preparation time,” which is the interval after the decision has been made but before the saccade is executed, can comprise a nontrivial fraction of the entire reaction time (as much as 300 ms) (Mazurek et al., 2003). Ideally, one would like to exclude spikes occurring during this interval because these spikes are presumably irrelevant to the monkey's choice.
We experimented with excluding portions of the initial transient response and portions of the motor preparation time from our analyses. Within reasonable limits, however, these manipulations did not qualitatively affect the distributions of neural sensitivity and choice probability computed from our dataset (data not shown). We therefore selected the simplest option, calculating the firing rate on each trial (spike count/reaction time) for the entire stimulus duration before saccade onset.
Neural sensitivity.
As in previous studies, we calculated the sensitivity of single neurons in our direction-discrimination task by constructing a “neurometric function” (for detailed methods, see Britten et al., 1992). For each coherence, we used distributions of responses to preferred- and null-direction motion to calculate the receiver operating characteristic (ROC). The area under the ROC curve represents the proportion of trials in which an ideal observer could correctly distinguish preferred from null-direction motion at this coherence given only the firing rate of the neuron under study and that of a hypothetical “antineuron” with the opposite preferred direction but otherwise identical response properties (Green and Swets, 1966). Thus, coherences for which the distributions of firing rates overlap minimally will have ROC area near unity, meaning that the firing of this neuron is sufficient to perfectly discriminate preferred- from null-direction motion at this coherence. Coherences at which the two distributions overlap completely will have ROC area of 0.5, meaning that an ideal observer would achieve only chance performance at this coherence. The neurometric curve is the fraction of trials the ideal observer could correctly discriminate at each of the coherences we tested (see Fig. 2, gray lines).
We then compared the monkey's psychometric curve and the neurometric curve by fitting each with a Weibull function given by the following:
 |
where p is the proportion of correct responses, and c is the coherence of the stimulus. The parameter α represents the coherence at which the proportion of correct responses is 82%; we used this value for the neurometric or psychometric threshold. The parameter β represents the slope of the curve.
For each experiment, we used a bootstrap technique similar to that presented by Uka and DeAngelis (2004) to test whether the measured psychophysical and neurometric thresholds differed significantly. We computed 2000 mock psychometric functions from the observed (binary) distribution of correct and incorrect choices at each coherence, and we computed 2000 mock neurometric functions from the observed response distributions to preferred- and null-direction motion at each coherence. We considered the psychometric and neurometric thresholds to differ if the 95% confidence intervals for the means of the two bootstrapped distributions did not overlap (p < 0.05).
To generate each mock psychometric function, we sampled randomly (with replacement) from the observed distribution of correct and incorrect choices, building up a total number of “trials” for each coherence equal to the number of trials obtained in the actual experiment. We then fitted a cumulative Weibull to these mock data and calculated a threshold as described above. To compute each mock neurometric function, we sampled randomly (with replacement) from the observed distributions of firing rates for preferred and null directions at each coherence, again building up a total number of trials equal to that obtained in the actual experiment at each coherence. We then computed ROC curves from these mock data, fitted a cumulative Weibull to the set of ROC values for each neurometric function, and calculated a neural threshold as described above.
Choice probability.
We calculated the trial-to-trial covariation between fluctuations in single-unit firing rates and behavioral choice using the choice probability metric (Britten et al., 1996). For 0% coherence trials, we divided the complete distribution of responses of each neuron into subdistributions of trials in which the monkey guessed motion in the preferred direction of the neuron and trials in which the monkey guessed null-direction motion. We then calculated an ROC curve from these two distributions and measured the area under the ROC curve to estimate the proportion of trials on which an ideal observer could predict the monkey's impending choice based on the firing rate of the neuron under study.
We tested whether the choice probability of a neuron differed significantly from chance (0.5) using a permutation test. From the distribution of firing rates measured in each experiment (for 0% coherence stimuli), we randomly assigned each trial as either a preferred-direction or null-direction choice with the same probability that the monkey actually chose each direction. We then recomputed choice probability for the new distribution of firing rates as described above. We repeated this process 2000 times for each neuron to construct a distribution of choice probabilities expected by chance. We defined a significant choice probability as one that fell outside the 95% confidence interval for the mean of this distribution.
To compute the time course of the choice probability effect (see Fig. 6), we filtered the raw spike trains with an exponential with a time constant of 100 ms and computed an average firing rate over time. This filter is causal; that is, a spike affects the filtered firing rate after it occurs but not before. We chose this time constant so that our results can be easily compared with those of a recent study of the dynamics of MT responses during a motion detection task (Cook and Maunsell, 2002).
Designation of off-axis preferred directions.
For the off-axis neurons in Figure 7, we needed to designate one of the two directions along the axis of discrimination as the “preferred” direction for the purposes of calculating choice probability or neurometric performance. Before beginning each experiment, we measured responses to 500 ms presentations of fully coherent motion in each of the two directions to be discriminated. We designated the direction that elicited the higher response to be the preferred direction.
Pooling model
We used a neuronal pooling model similar to one developed by Shadlen et al. (1996) to test whether the measurements of neural sensitivity, choice probability, and noise correlation between pairs of MT neurons (Cohen and Newsome, 2008) observed in the reaction time task could account for the monkeys' psychometric performance. The model has been described in detail previously (Shadlen et al., 1996), so here we will describe only the basic structure of the model and the aspects in which our model differs from the previously published model.
The model simulates the responses of populations of MT neurons to the same set of stimuli used in our experiments, computes a decision variable from the pooled (summed) population responses, and renders a psychophysical choice based on the computed decision variable. We simulated the responses of a population of MT neurons whose preferred directions ranged from 0° to 350° in increments of 10°. In all of our simulated trials, the model discriminated upward from downward motion. On each trial, the model makes a decision by comparing the summed firing rates of two pools of neurons, the pool of neurons whose preferred directions have an upward component and those whose preferred directions have a downward component. We varied motion coherence, direction (up or down), the number of neurons in each pool, and the breadth of each pool (the greatest angle between the preferred direction of a neuron and the axis of motion for a neuron to be considered part of a pool, termed θ). We simulated responses of each neuron in the population to 10,000 trials of each motion direction and coherence.
As in the original model (Shadlen et al., 1996), we simulated the responses of individual MT neurons to reflect both the mean and the variance of the responses of the neurons we recorded. In addition, we simulated noise correlation between pairs of MT neurons that depended on the difference in their preferred directions as well as whether they contributed to the same or opposite pools (Cohen and Newsome, 2008), and we simulated reaction times to reflect the distributions of reaction times observed in our experiments.
Mean responses.
The response, ri,φ(k,c), of the ith MT neuron with preferred direction φ° from the up–down axis of motion on the kth trial of coherence c could be written as follows:
 |
where 〈ri,φ(c)〉 is the average response of the neuron to a stimulus of coherence c, and ε is a noise term.
The average response depends on both the coherence and φ, the angle between the preferred direction of a neuron and the up–down axis of motion. (The maximum allowable φ for a neuron to be considered part of the pool was θ, which we varied.) For optimally tuned neurons (those whose preferred directions were either up or down, so φ = 0°), the average firing rate (spikes per second) we recorded was as follows:
 |
for motion in the preferred direction of the neuron and
 |
for motion in the null direction of the neuron. These equations represent best-fit lines (Britten et al., 1993) of the average responses of the neurons in our main dataset at each of the coherences we tested.
For neurons with nonzero φ, we modeled the mean response by assuming cosine tuning. Therefore, the mean response for off-axis neurons was as follows:
 |
We tried other reasonable tuning functions, and we found that the assumption of cosine tuning did not qualitatively affect our results (data not shown).
Covariance of simulated responses.
In the original pooling model (Shadlen et al., 1996), the correlation in the trial-to-trial fluctuations in response to a given stimulus (noise correlation) between pairs of MT neurons placed important constraints on the performance of the simulated population of MT neurons. Estimates of noise correlation in the original model were based on data from pairs of neurons that were recorded on the same electrode and therefore typically had very similar tuning (Zohary et al., 1994; Bair et al., 2001). Based on these results, the original model postulated that neurons within a pool have relatively high noise correlation and that noise between pools was independent.
In more recent experiments (Cohen and Newsome, 2008), we found that noise correlation depends on both the difference between the preferred directions (ΔPD) of two neurons and whether they belonged to the same or different perceptual pools, and that noise correlation was, on average, positive for all pairs of neurons with overlapping receptive fields. We therefore simulated covariance between pairs of neurons in our model to match the noise correlation observed in our experiments. The correlation C between neurons i and j when the two neurons are in the same or different pools was given by the following:
and
where PDi is the preferred direction of neuron i, and all directions are in degrees (Cohen and Newsome, 2008, their Fig. 4).
We used a method very similar to the one used in the original pooling model to impose noise correlation in our simulated MT responses. The variance of the distribution of responses of a particular neuron to a stimulus of a given direction and coherence was 1.5 times the mean. We chose the Fano factor of 1.5 because it is physiologically realistic and the same as that used in the original model (Shadlen et al., 1996).
As in the original pooling model, we imposed noise correlation according to the desired correlation matrix, C, by calculating its matrix square root, Q, such that
 |
Q is the unique matrix square root of C such that every eigenvalue has a non-negative real part.
We then formed a correlated matrix of standard deviates for the N neurons by generating a vector of independent, normal deviates, x, with zero mean and unit variance and multiplied it by Q. The resulting matrix,
 |
has covariance C (for a complete derivation, see Shadlen et al., 1996, their Appendix 1).
We then offset and scaled y to get our matrix of noisy responses. Therefore, the responses, r, of the population of MT neurons on the kth trial with coherence c is a 1 by N vector and could be written as follows:
 |
where 〈r(c)〉 is a 1 by N vector of average responses that depends on each neuron's θ as above.
We generated simulated responses of the population of MT neurons while varying direction, coherence, pool size, and θ, which is the maximum φ to be considered part of a pool. For simulations in which θ was nonzero, we randomly selected the preferred directions of the neurons in one pool from a uniform distribution of allowable preferred directions and then set the preferred directions of the neurons in the opposite pool to be 180° opposite to the preferred directions in the first pool. Note that, for θ = 180°, neurons whose preferred directions are orthogonal to the axis of motion being discriminated might belong to either pool. In this case, we added orthogonal neurons to both pools, and their responses differed only in the pool-dependent noise correlation we imposed. We then calculated the psychometric data of the model and the choice probability for each simulated neuron.
Reaction time.
We wanted our version of the pooling model to capture the short timescale of perceptual decisions revealed by the reaction time task as well as the trial-to-trial variability in reaction times. However, the decision rule or algorithm by which the reaction time on a given trial is determined (Roitman and Shadlen, 2002; Wang, 2002) will likely affect the predictions of the model. Models incorporating decision rules rely on many parameters, any of which may affect predicted psychometric thresholds and choice probabilities. Detailed models of this sort are a subject of active investigation by several laboratories.
Because the goal of our modeling exercise was to show that simple modifications of the original pooling model (Shadlen et al., 1996) can account for our data in the reaction time task, we chose the simplest possible decision rule; reaction times were selected randomly on each trial. We simulated reaction time on a given trial by sampling, with replacement, the distribution of reaction times observed in the actual experiments for each coherence. For example, the reaction time for a given 12% coherence trial was picked from the distribution of reaction times on 12% coherence trials for both monkeys. Therefore, the distributions of reaction times in our simulated trials matched the combined distributions of reaction times of the two monkeys.
Results
Behavior
We trained both monkeys to perform the reaction time direction-discrimination task described in Figure 1a (see Materials and Methods). Figure 1, b and c, shows average psychometric and chronometric curves, respectively, for monkey T (black) and monkey D (gray). Consistent with previous results in this task and many others (Roitman and Shadlen, 2002), psychophysical performance was more accurate (Fig. 1b) and reaction times were shorter (Fig. 1c) as coherence increased. These relationships held for both monkeys individually, although monkey T generated significantly lower psychophysical thresholds (t test, p < 0.01; mean threshold, 18.1 and 25.8% coherence for monkeys T and D, respectively) and had slower reaction times than monkey D (t test, p < 0.001; mean reaction time, 674 and 585 ms on 0% coherence trials for monkeys T and D, respectively).
Sensitivity of single neurons
Figure 2 shows four examples of neurometric (gray) and psychometric curves (black) measured simultaneously. The curves in Figure 2a are primarily overlapping, and the corresponding neurometric and psychometric thresholds are statistically indistinguishable, meaning that the monkey, given perfect access to the firing rates of his MT neurons, could have achieved the observed psychometric performance by relying solely on the responses of the neuron we recorded. These neurons were the exception, however. More typically, neurometric thresholds were higher than psychometric thresholds (for example, Fig. 2b,c), meaning that the monkey's psychometric performance was better than could be achieved based on the motion information available in the responses of a single neuron. In a few cases, such as the example in Figure 3d, neurometric performance was substantially below 100% correct, even at the highest coherence tested. We selected for study only neurons whose distributions of responses to 500 ms presentations of fully coherent motion in the preferred and null directions did not overlap (see Materials and Methods). At the highest coherences, however, the monkeys' reaction times were usually shorter than 500 ms, so some neurons, like the one in Figure 2d, did not fully discriminate motion at the highest coherence.
Figure 3 shows frequency histograms of the ratio between the neurometric and psychometric thresholds for each experiment and each monkey. Ratios less than 1 indicate that the neurometric threshold was lower than the corresponding psychometric threshold, so the monkey performed worse than the signaling of the single neuron. Ratios greater than 1 indicate that the monkey performed better than the single neuron. The geometric mean of both distributions is significantly greater than 1, indicating that, on average, the monkeys performed better than they could have based on a single neuron (geometric mean, 2.67 for monkey T, p < 0.001; geometric mean, 2.19 for monkey D; t test, p < 0.005 in both cases).
Shaded bars on the histogram indicate experiments in which the neurometric and psychometric thresholds were significantly different (p < 0.05, bootstrap test described in Materials and Methods). Of the 85 experiments in monkey T, 67 (79%) yielded significantly different neurometric and psychometric thresholds. Of these, neurometric thresholds were higher than the corresponding psychometric thresholds in 65 of 67 experiments (97%). In monkey D, 24 of 30 (80%) experiments yielded significantly different neurometric and psychometric thresholds, and, of these, neurometric thresholds were higher in 23 (96%).
The mean neurometric threshold for the two monkeys was not significantly different (mean of 51% coherence for monkey T and 56% coherence for monkey D; t test, p = 0.31), indicating that their neurons showed the same average sensitivity to motion direction. Because their psychometric thresholds were different, their mean neurometric to psychometric ratios were different as well. Even the monkey with poorer psychometric performance, however, had a mean neurometric threshold more than twice his mean psychometric threshold (Fig. 3b).
Choice probability
We quantified the correlation between firing rate and choice (choice probability) on 0% coherence trials by using ROC analysis as described in Materials and Methods. Figure 4, a and b, illustrates histograms of choice probability for monkeys T and D, respectively. The means of both distributions are significantly >0.5 (t test, p < 0.05; mean of 0.5403 and 0.5377 for monkeys T and D, respectively). Mean choice probability was not significantly different for the two monkeys (t test, p = 0.56). The filled bars on the histograms indicate individual experiments for which the choice probability was significantly different from 0.5 (p < 0.05, permutation test as described in Materials and Methods). For the two monkeys, 21 of 25 neurons (84%) with significant choice probabilities were in the intuitively appropriate direction, with higher firing rates for preferred-direction choices. There was no correlation between psychometric threshold and choice probability for either monkey (r = 0.006, p = 0.96 for monkey T; r = −0.09, p = 0.33 for monkey D). There was also no significant correlation between neurometric threshold and choice probability (p = 0.39, ANCOVA with monkey identity as a coregressor).
On most experiments, the random-dot placement in each 0% coherence trial was created using a different seed for our random-number generator. To determine whether small amounts of random-motion energy accounted for choice probability, we used the same random seed for 41 experiments in monkey T. Figure 4c shows the frequency histogram of choice probabilities for these experiments. Consistent with a previous report (Britten et al., 1996), the mean choice probability in these experiments (0.5301) was significantly >0.5 (t test, p < 0.05) and statistically indistinguishable from the mean choice probability from experiments in monkey T in which a new random seed was used for each trial (t test, p = 0.22).
Significant choice probabilities (and also the correlation between firing rate and reaction time; see below) show that the firing rate of MT neurons during the stimulus presentation interval is closely related to the monkey's decision process. We examined the detailed time course of choice probability in an effort to gain insight into the dynamics of the decision process. We first filtered the spike trains (see Materials and Methods) to obtain a firing rate at each millisecond for each neuron for each 0% coherence trial. We then computed choice probability using the instantaneous firing rates at each millisecond for each neuron.
Figure 5, a and b, depicts the average choice probability at each time point across all neurons for monkeys T and D, respectively; the width of the line represents the mean ± SE. The traces are aligned to stimulus onset in the left panels and to saccade initiation in the right panels. At the beginning of the trial, the mean choice probability is near 0.5 for both monkeys, indicating that neural activity before motion signals reach MT is not correlated with the monkey's eventual perceptual judgment. Both monkeys' choice probability rises after stimulus onset, peaking at different times for the two monkeys (∼200 ms after stimulus onset for monkey T and ∼120 ms for monkey D). For both monkeys, mean choice probabilities fall as the saccade approaches; monkey T's reaches chance levels ∼150 ms before the saccade, whereas monkey D's mean choice probability reaches chance ∼70 ms before the saccade. The slow decay in choice probability may be in part attributable to the 100 ms exponential filter we used to determine firing rates on each trial (see Materials and Methods). However, the slow rise in choice probability cannot be attributable to the filter because the exponential filter is causal and is consistent with previous results in MT (Cook and Maunsell, 2002) and secondary visual cortex V2 (Nienborg and Cumming, 2006).
Correlation between MT firing rates and reaction time
Choice probability measures the correlation between the trial-to-trial fluctuations of MT responses and the monkey's binary decision. The reaction time task gives us an additional handle on the monkey's decision process: his response time. Figure 6 depicts a frequency histogram of the correlation coefficients between the firing rate of each neuron and the reaction time of the monkey on 0% coherence trials. We computed the correlation coefficients independently for trials on which the monkey chose the preferred direction of the neuron (upward bars) and trials on which it chose the null direction (downward bars). Shaded boxes indicate experiments for which the correlation coefficient was significantly different from zero.
For preferred-direction choices, reaction times were significantly faster on trials in which the firing rate of the neuron was higher than average. The mean correlation coefficient was −0.161 for the two monkeys combined, and this was significantly less than 0 for the combined distribution (t test, p < 0.001) as well as for each monkey individually (t test, p < 0.01; data not shown). For the 41 neurons in monkey T in which we used the same random-number seed on each 0% coherence trial, the mean correlation coefficient was −0.176, which was also significantly different from 0 (t test, p < 0.01) and was not significantly different from the mean correlation coefficient for the rest of the neurons in our sample (t test, p = 0.30). For null-direction choices, firing rate and reaction time were not significantly correlated (mean of −0.01 across both monkeys; t test, p = 0.56).
Off-axis neurons
In separate experiments, we obtained neurometric threshold and choice probability data for 150 MT neurons while the monkey performed the direction-discrimination task along an axis different from the preferred-null axis of the neuron under study (first presented by Cohen and Newsome, 2008). Figure 7a shows average neurometric performance (area under the ROC curve) as a function of the angle between the preferred direction of the neuron and the axis of motion the monkey was discriminating (termed φ) for four different coherences. For each nonzero coherence, performance predictably decreased as a function of φ. Perhaps surprisingly, neurometric performance was nearly 70% correct on the highest coherence, even for the least sensitive, or farthest off-axis, group of neurons (φ between 67.5° and 90°).
Figure 7b depicts average choice probability as a function of φ (error bars represent the SEM). Again, choice probability predictably decreases as a function of φ, but notably, it is significantly >0.5 for each bin (t test, p < 0.05). This result is consistent with other studies showing that even very off-axis neurons have choice probability >0.5 in the fixed duration version of this task (Britten et al., 1996) and in other tasks involving moving stimuli (Purushothaman and Bradley, 2005) (W. H. Bosking and J. H. R. Maunsell, unpublished observations). Together, these results suggest that even the least sensitive neurons carry useful motion information (Fig. 7a) and their responses are correlated with the monkey's decisions (Fig. 7b).
Because the data for off-axis neurons were collected in a separate set of experiments from the on-axis neurons (in which task difficulty, similarity between the tuning of the a neuron and the stimulus, and other factors were different), we analyzed the relationship between degrees off-axis and neurometric performance (Fig. 7a) and choice probability (Fig. 7b) without including the on-axis neurons. For the off-axis neurons (all data points to the right of the hash marks on the x-axis of each figure), there was a significant negative correlation between degrees off axis and proportion correct for the higher two coherences shown (96% coherence, r = −0.38, p < 0.0001; 24% coherence, r = −0.24, p < 0.01) and a nonsignificant trend toward a negative correlation for 6% coherence (r = −0.08, p = 0.11). There was also a weak but significant correlation between choice probability and degrees off axis for these neurons (r = −0.13, p < 0.05). These results indicate that the responses of neurons whose preferred directions are far from the relevant axis of motion are less informative and less correlated with behavior than neurons whose preferred directions are more closely aligned with the axis of motion being discriminated.
Measurements of neural sensitivity and correlation in the reaction time task better account for observed psychometric performance and choice probability
A central goal of this study was to reconcile the monkey's psychophysical performance with the neurophysiological data in the reaction time task. Specifically, we instantiated a version of a pooling model (Shadlen et al., 1996) (see Materials and Methods) to determine whether our measurements of neural sensitivity in the reaction time task, considered together with the task-dependent noise correlation we measured using simultaneous recordings of pairs of MT neurons in this task (Cohen and Newsome, 2008), could explain our monkeys' psychophysical performance and the neuronal choice probability. We were interested in the predictions of the model as a function of pool size (the total number of neurons in each of the two pools) and θ, the width of each pool (the maximum angle between the preferred direction of a neuron and the axis of motion being discriminated for a neuron to be considered part of one of the pools).
Figure 8a plots the predicted psychometric threshold of the model as a function of pool size for three values of θ. As in the original pooling model based on data from the fixed duration task (Shadlen et al., 1996), performance improves (threshold decreases) as a function of pool size, becoming asymptotic at a pool size of 50–100 neurons because noise common to the entire pool cannot be averaged away by recruiting additional neurons (see Materials and Methods). Predicted psychometric threshold increases with θ; the model predicts a psychometric threshold of ∼10% coherence at asymptote for θ = 0°, 13% coherence for θ = 45°, and 16% coherence for θ = 90°. Monkey T's average threshold was 18.1% coherence (Fig. 8a, bottom dashed line), and monkey D's threshold was 25.8% coherence (Fig. 8a, top dashed line). By comparison, the most similar model in the original study predicted an asymptotic threshold of 6% coherence (Fig. 8a, arrow).
Figure 8.
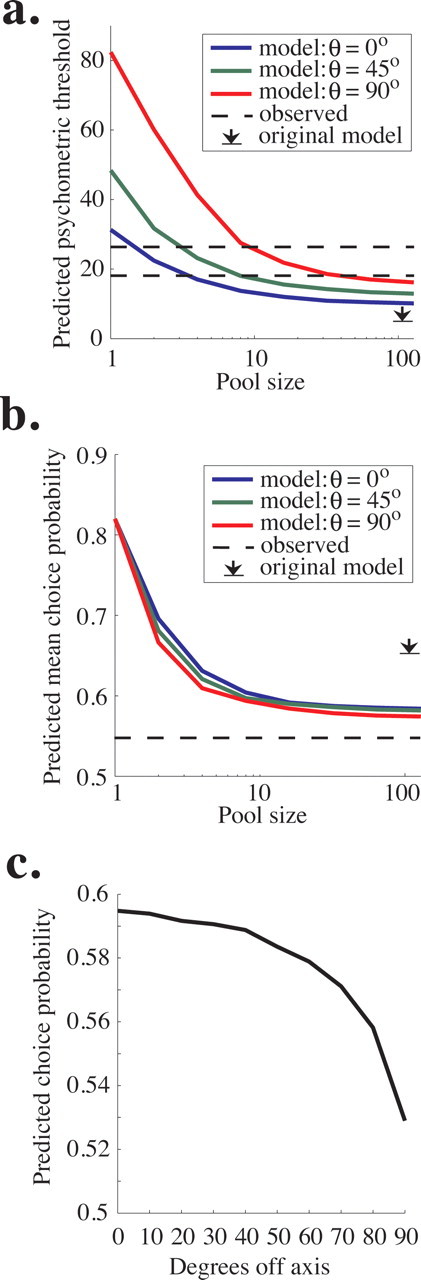
Predictions of the updated pooling model. a, Predicted psychometric threshold as a function of pool size for three values of θ, which can be considered the “width” of the pool. Specifically, θ is the maximum angle between the preferred direction of each neuron in the pool and the axis of motion being discriminated. The dashed lines represent the mean psychophysical threshold observed in experiments for monkey T (top) and Monkey D (bottom), and the black arrow represents the predicted asymptotic performance in the original pooling model (Shadlen et al., 1996). b, The average choice probability predicted by the pooling model as a function of pool size. Predicted choice probability also depends weakly on θ, the maximum angle between the preferred direction of each neuron in the pool and the axis of motion being discriminated. The dashed line represents the average observed choice probability, which was nearly identical for the two monkeys (compare Fig. 5a,b). The black arrow represents the predicted asymptotic choice probability in the original simulations of Shadlen et al. (1996). c, Predicted choice probability is plotted as a function of the angle between the preferred direction of the neuron and the axis of motion being discriminated (compare with Fig. 7b).
Figure 8b depicts the predicted choice probability of the model as a function of pool size for the same three values of θ. The predicted choice probability is the average choice probability of all neurons involved in the decision (and therefore the average of all included values of θ.) Like psychometric threshold, predicted choice probability decreases with pool size and asymptotes ∼50–100 neurons per pool. The initial fall in predicted choice probability occurs because the variance in the outcome of the decision process is spread over an increasing number of noisy neurons, and each individual neuron is therefore less correlated with the final decision as pool size grows. The choice probability remaining at asymptote is attributable again to common noise in the pool of sensory neurons that cannot be decreased by adding additional neurons. In addition, predicted choice probability decreases with θ. The model predicts asymptotic choice probabilities of ∼0.585 for θ = 0°, 0.582 for θ = 45°, and 0.575 for θ = 90°. These values are somewhat higher than our measured choice probability (∼0.54 for both monkeys) (Fig. 8b, dashed line) but are much closer to the observed values than the asymptotic prediction of the original pooling model (0.65) (Fig. 8b, arrow).
Our model predicts lower choice probability than the original model primarily because, having no data to the contrary, the original model assumed that the two pools were independent (had uncorrelated noise). In recent experiments, however, we found that the noise in the responses of the vast majority of MT neurons with primarily overlapping spatial receptive fields, including those with very different preferred directions, is positively correlated to some degree (Cohen and Newsome, 2008), a finding that is consistent with data from motor cortex (Lee et al., 1998; Maynard et al., 1999; Averbeck and Lee, 2003) and primary visual cortex (Kohn and Smith, 2005; Smith and Kohn, 2008). Our current model reflects these widespread positive correlations (see Materials and Methods). Because the model makes decisions by comparing the firing rates of the two pools on each trial, correlated noise between pools decreases choice probability. This result can be appreciated intuitively by recalling that choice probability measures the correlation between the noisy response of a neuron and the monkey's decision. If that noise is also correlated with evidence for the opposite decision, choice probability will necessarily go down. This reasoning in fact suggests a more general inference: choice probability magnitude depends substantially on the difference in correlation between the two pools of sensory neurons, regardless of the absolute correlation levels present in the pools.
To test this inference, we conducted additional simulations, adding a constant amount of correlation to all pairs of MT neurons. Therefore, the correlation Ci,j between neurons i and j was exactly as described in Materials and Methods, plus a constant. We repeated this procedure for several different levels of added correlation, ranging from −0.5 to 0.5. Pleasingly, the resulting choice probabilities were exactly those plotted in Figure 8b as long as no individual pairwise correlations exceeded ±0.8. These results indicate that choice probability magnitude and correlation are intimately entwined; choice probability is determined by the relative correlations between the two pools of neurons.
Unlike in the original model, our predicted choice probability depends slightly on θ (Fig. 8b) because we observed that noise correlation between neurons within a pool decreases as the difference between their preferred directions increases (Cohen and Newsome, 2008). Therefore, the model predicts that choice probability will decrease with the distance between the preferred direction of a neuron and the axis of motion being discriminated. Figure 8c plots predicted choice probability as a function of degrees off axis. This relationship is qualitatively similar to our physiological results (Fig. 7b), although the observed decline in choice probability as a function of degrees off axis was noisy and not as steep as the one plotted in Figure 8c. Predicted choice probability as a function of degrees off axis does not depend on θ, so we plot only a single line here (as opposed to Fig. 8a,b). These results indicate that, in the model, the primary effect of broadening the pool width is incorporating more neurons with low choice probabilities, leading to a lower overall predicted choice probability for high θ (Fig. 8b).
Does choice probability indicate that a neuron is involved in the perceptual decision?
Choice probability was originally conceived as one way to establish that the responses of particular sensory neurons causally contribute to the animal's perceptual decision. The reasoning was that a trial-to-trial covariation between the fluctuations in the response of a neuron and the monkey's choices indicates that the responses of that neuron are likely to contribute to the pool of evidence that influences the monkey's perceptual choices. Indeed, in motion processing tasks similar to ours, the role of optimally tuned MT neurons in perception has been confirmed not only by their significant choice probability (Britten et al., 1996; Dodd et al., 2001; Cook and Maunsell, 2002; Krug et al., 2004; Barberini et al., 2005; Liu and Newsome, 2006) but also from studies using causal techniques such as inactivation through lesions or pharmacology (Newsome et al., 1985; Newsome and Paré, 1988; Schiller, 1993; Schiller and Lee, 1994; Orban et al., 1995; Rudolph and Pasternak, 1999) or activation through microstimulation (Salzman et al., 1990; Salzman and Newsome, 1994; DeAngelis et al., 1998; Bisley et al., 2001; Nichols and Newsome, 2002; Ditterich et al., 2003; DeAngelis and Newsome, 2004). However, new evidence from this study as well as our previous study measuring the responses of pairs of MT neurons (Cohen and Newsome, 2008) leaves open the possibility that (1) choice probability can occur even for neurons that are not causally involved in a task, and (2) these “spurious” choice probabilities can be just as large as those measured from neurons that are causally involved.
The first point is fairly obvious. Neurons that do not contribute causally to downstream decision mechanisms can nevertheless exhibit a significant choice probability if they are positively correlated with those that do. Thus, positive noise correlation within a pool of sensory neurons can lead to “spurious” choice probability effects that are not indicative of causality. The second point, however, is more subtle. One might initially think that choice probabilities should be quantitatively larger for neurons that contribute causally to the decision mechanism, but simulations presented in this section (which are similar to those presented by B. Cumming, oral presentation) show that this is not the case for pool sizes exceeding ∼20 neurons.
We simulated the responses of 1000 neurons with identical tuning and firing properties (Fig. 9a, rectangle). These neurons can be thought of as on-axis neurons in a single perceptual pool. We simulated a choice on each trial based on the responses of a small, randomly selected subset of the population that comprised a decision pool (Fig. 9a, solid oval) but ignored the responses of the remaining neurons (Fig. 9a, dashed oval). Each neuron in the population had a mean firing rate of 50 spikes per second, and we imposed zero-mean, correlated Gaussian noise such that each neuron had a Fano factor of 1.5 using methods similar to those we used for the pooling model in Figure 8. In each simulation, the noise correlation between all pairs in the entire population was the same (regardless of whether the neurons were involved in the decision), and we ran simulations with noise correlation coefficients of 0, 0.05, 0.1, or 0.2 (Fig. 9b, blue, green, red, and cyan lines). We modeled the simplest possible 2AFC task; the monkey chose “yes” when the mean activity of the neurons in the decision pool (Fig. 9a, solid oval) was >50 spikes per second and “no” otherwise. To generate Figure 9b, we simulated responses to 10,000 trials per correlation and pool size; using this method, the simulated “monkey” made 50% “yes” choices (or ∼5000 trials) and 50% “no” choices. We then computed choice probability for each neuron [both those neurons inside the decision pool (solid oval) and those outside the decision pool (dashed oval)].
Figure 9.
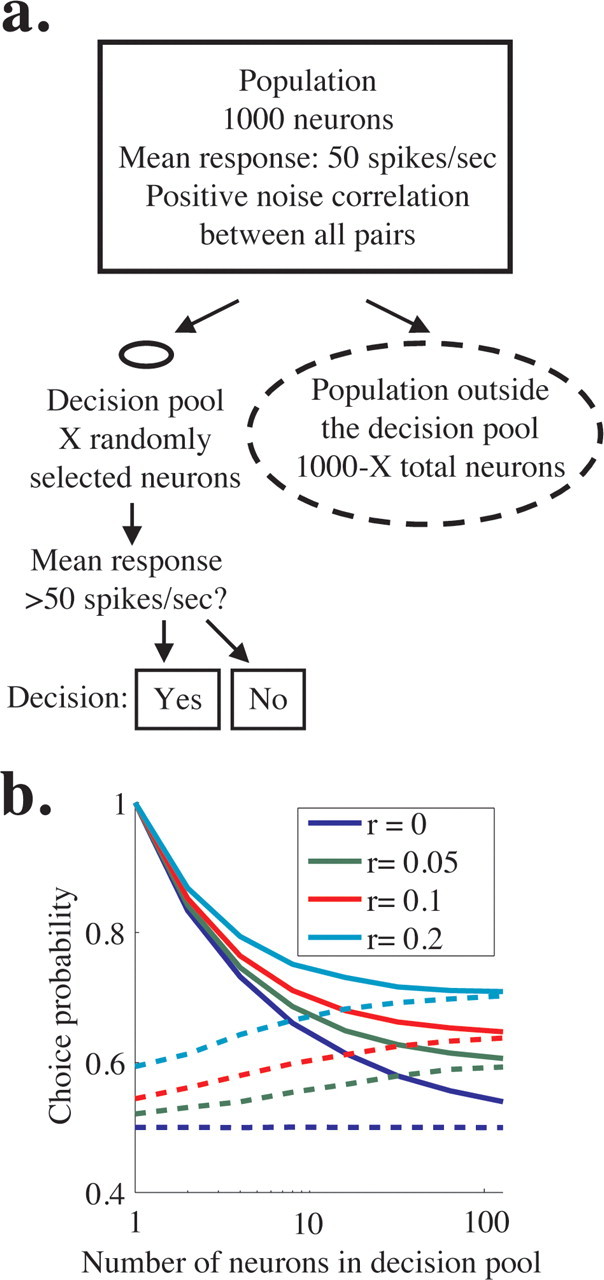
Simulations showing that choice probability is similar for neurons involved and not involved in a decision. a, Schematic of simulations. We simulated the responses of a population of 1000 identically tuned neurons with mean response of 50 spikes/s and constant pairwise noise correlation (rectangle). The decision of the model was based on the responses of a fraction of these neurons that comprised the decision pool (solid oval), and the responses of the rest of the neurons were ignored (dashed lines). The solid oval representing the decision pool is small compared with the dashed oval representing the nondecision pool to represent the relative number of neurons in each. The decision of the model in a hypothetical task was “yes” if the mean activity in the decision pool was >50 spikes/s and “no” otherwise. b, Predicted choice probability for neurons involved (solid lines) and not involved (dashed lines) in a perceptual decision for four uniform levels of noise correlation across the population. Choice probability is plotted as a function of the number of neurons in the decision pool. Choice probability for neurons not involved in the task approaches choice probability for involved neurons for medium to large pool sizes.
We found that, when noise correlation was >0, choice probabilities for neurons not involved in the decision (Fig. 9b, dashed lines) were statistically indistinguishable from those for neurons in the decision pool (solid lines) for larger pool sizes. Using experimentally feasible numbers [sampling 50 neurons from the decision pool (from the solid oval in Fig. 9a) and 50 neurons outside the pool (from the dashed oval) on 100 trials per condition], choice probability within and outside the pool of involved neurons is statistically indistinguishable for all three nonzero correlation levels we tested when pool size is greater than ∼20 neurons (t test, p < 0.05). Although choice probability may still enable us to identify large pools of neurons that include neurons that contribute to the decision process, choice probability alone does not permit distinctions between individual neurons that are or are not causally linked to downstream decision mechanisms.
Discussion
Our primary goal was to reassess the relationship between neural responses and psychophysical performance on a motion discrimination task, taking advantage of new noise correlation data (Cohen and Newsome, 2008) and new MT electrophysiological data obtained during a reaction time task, which limits the acquisition of neural data to the actual timescale of decision making. We found that typical MT neurons are two to three times less sensitive to motion direction signals than is the monkey psychophysically. Our data contrast to those of Britten et al. (1992) who estimated average neural sensitivity to be equal to psychophysical sensitivity using a fixed-duration stimulus, suggesting that the monkeys in their study may not have made use of the full viewing interval, but agree substantially with the conclusions of Cook and Maunsell (2002) who used a reaction time detection task.
Somewhat surprisingly, our choice probability measurements are similar to those obtained by Britten et al. (1996) in the fixed-duration task. If our monkeys used a higher proportion of the viewing interval than the monkeys in the original task and if the fluctuations in neural responses are independent across time (little autocorrelation in the responses), then we would expect higher choice probability in our task. If, however, choice probability is attributable in part to top-down inputs that are present regardless of whether the monkey is actively integrating motion information (Nienborg and Cumming, 2009), choice probability should remain high throughout a long, fixed-duration trial and should be similar in the fixed duration and reaction time tasks. The data from the original studies show a small amount of autocorrelation (Bair et al., 2001) but not enough to account for the absence of a difference in choice probability between the two studies. The absence of higher choice probability in our data should be a subject for future study.
The observation that most single MT neurons are not sensitive enough to account for the monkey's behavior and the absence of neurons with the very large choice probabilities (which would be expected if choices were based on the responses of only a few neurons) suggest that the monkey must make use of many MT neurons to make its decisions. The reaction time task provides additional insight into the relationship between neural activity and the decision-making process, the temporal interval required to form perceptual judgment. We found that high firing rates in MT are associated with short response latencies when the monkey makes a choice in the preferred direction of the neuron under study.
Comparison of psychometric performance and neuronal sensitivity
The most substantial difference between our results and those from the fixed duration task is the measurement of neural sensitivity. The relatively low neural sensitivity in our study can be explained by the much shorter viewing interval in the reaction time task as compared with the 2 s fixed-duration task. The main limitation on the ability of MT neurons to encode stimulus direction is the noise in their responses; integrating neural activity over a longer period of time yields greater estimates of neural sensitivity because some of the noise is averaged out over time. Because trial durations are generally quite short in the reaction time task, estimates of neural sensitivity will necessarily be lower than for trials of longer duration.
The comparison between neural and psychophysical data relies on the assumption that the monkey performed as well as possible given the neural evidence available. Our monkeys generated somewhat worse psychophysical performance than the monkeys in the study by Britten et al. (1992) (18 and 26% coherence thresholds for our monkeys; 5, 12, and 20% threshold for the monkeys in the study by Britten et al., 1992), so one concern is that our monkeys may not have used as much of the available neural evidence as the monkeys in the original studies. Importantly, however, this difference actually predicts results of opposite sign. If our monkeys did not perform up to their full capabilities, the neurometric/psychometric ratio would be lower than in the original study, whereas we found a higher neurometric/psychometric ratio. If anything, then, neuronal sensitivity is even worse relative to psychophysical sensitivity than we report here.
Noise correlation affects choice probability predictions
Consistent with previous studies, we observed a weak correlation between the trial-to-trial fluctuations in MT responses and the monkey's choices (Figs. 4, 5, 7b) as well as the reaction time (Fig. 6). The original pooling model of Shadlen et al. (1996) predicted substantially higher choice probability values than were observed in either the current study or the previous study by Britten et al. (1996). The discrepancy between the original model and the choice probability data appears to be attributable, in part, to a faulty assumption about the level of correlated noise present in the population of MT neurons. Although noise correlation measurements had been obtained for adjacent neurons measured on a single electrode (Zohary et al., 1994), measurements were not available for spatially segregated neurons located, for example, in different direction columns. In the absence of data, Shadlen et al. (1996) assumed that the responses of neurons in different columns were independent.
We recently assessed this assumption by recording simultaneously from two electrodes in MT (Cohen and Newsome, 2008). For pairs of MT neurons with spatially overlapping receptive fields, we found that noise correlation is positive even if the neurons are located in entirely different direction columns. The positive noise correlation presumably derives from common inputs to neurons with similar receptive fields. Positive noise correlation across the entire pool of sensory neurons reduces the choice probability predicted by the pooling model (Fig. 8b) because it reduces the difference in correlation between the two pools. Intuitively, this is easiest to appreciate by considering two neurons with opposite preferred directions. If the choice probability of both neurons is sufficiently large, positive noise correlation becomes mathematically impossible. High choice probability means that, on trials when the monkey chose up, an upward neuron must fire more than its average, whereas a downward neuron fires less than its average; the converse is true when the monkey chooses down. Therefore, the trial-to-trial fluctuations in the responses of the two neurons must be anticorrelated, giving them negative noise correlation. Conversely, if the two neurons have high positive noise correlation, they cannot have high choice probability. We observed moderate but positive noise correlation among oppositely tuned neurons, which caused our model to predict significant but lower choice probabilities than the original pooling model.
A simple pooling model of the reaction time task better accounts for physiological results
Our updated pooling model more closely predicts observed psychometric thresholds and choice probabilities than the original model (Shadlen et al., 1996). The shorter stimulus durations in our task and better noise correlation data (Cohen and Newsome, 2008) improved the predictions of the model. Consistent with previous studies (Purushothaman and Bradley, 2005), our measurements from off-axis neurons indicate that neurons whose tuning was not matched to the stimulus under study carried useful information about motion direction (Fig. 7a) and that trial-to-trial fluctuations in the responses of these neurons were correlated with the monkey's behavior (Fig. 7b). Including these “less sensitive” neurons in the pooling model reduced even further the discrepancy between model predictions and actual data (Fig. 8).
The remaining errors in the updated model are in the same direction as in the original model: lower psychometric threshold and higher choice probability than is actually observed (Fig. 8, compare dashed and colored lines). A possible reason for the remaining discrepancy, as suggested in the original modeling study, is that additional “pooling noise” may occur at the decision stage. By adding an arbitrary amount of pooling noise to our simulations, we could eliminate the remaining error between model and data. Other potential reasons for the remaining discrepancy exist, however, including effects of “motor preparation” time (Mazurek et al., 2003; Kiani et al., 2008) and imprecise estimates of choice probability attributable to very low firing rates for some neurons. Although we have no way to estimate the relative contribution of these factors to our calculations, a combination of the three could certainly account for the remaining difference between model predictions and experimental data.
Concluding remarks
The direction-discrimination task we used is an extensively developed model system for analyzing the neural substrates of perceptual performance. In this report, we rectified the most serious shortcomings of previous studies using this task, most notably the mismatch between the temporal integration interval for psychophysical and neural data and incomplete data on noise correlation. We find that a simple pooling model using these measurements primarily accounts for psychophysical performance. The relationship between psychophysical sensitivity and neural sensitivity may be very different in fundamentally different kinds of discrimination tasks (Snowden et al., 1992; Purushothaman and Bradley, 2005) and sensory modalities (Relkin and Pelli, 1987; Matsumora et al., 2008; Stüttgen and Schwarz, 2008). Our results suggest that a complete account of the neural mechanisms underlying psychophysical performance in other systems will require simultaneous recordings from multiple neurons and measurements of neural sensitivity on the timescale of behavior.
Footnotes
This work was supported by Howard Hughes Medical Institute (HHMI) (W.T.N.), National Institutes of Health Grant EY05603 (W.T.N.), and an HHMI predoctoral fellowship (M.R.C.). We thank Michael Shadlen, Alex Huk, Timothy Hanks, and other members of the Shadlen laboratory for many helpful discussions on all aspects of this project. We thank Stacy Dukunde, Jessica Powell, and Mackenzie Risch for expert technical assistance and Mark Histed, Incheol Kang, Douglas Ruff, Alexandra Smolyanskaya, John Palmer and members of his laboratory, and two anonymous reviewers for helpful comments on a previous version of this manuscript.
References
- Averbeck BB, Lee D. Neural noise and movement-related codes in the macaque supplementary motor area. J Neurosci. 2003;23:7630–7641. doi: 10.1523/JNEUROSCI.23-20-07630.2003. [DOI] [PMC free article] [PubMed] [Google Scholar]
- Bair W. Analysis of temporal structure in spike trains of visual cortical area MT. California Institute of Technology; 1995. PhD thesis. [Google Scholar]
- Bair W, Zohary E, Newsome WT. Correlated firing in macaque visual area MT: time scales and relationship to behavior. J Neurosci. 2001;21:1676–1697. doi: 10.1523/JNEUROSCI.21-05-01676.2001. [DOI] [PMC free article] [PubMed] [Google Scholar]
- Barberini CL, Cohen MR, Wandell BA, Newsome WT. Cone signal interactions in direction-selective neurons in the middle temporal visual area (MT) J Vis. 2005;5:603–621. doi: 10.1167/5.7.1. [DOI] [PubMed] [Google Scholar]
- Barlow HB. Single units and sensation: a neuron doctrine for perceptual psychology? Perception. 1972;1:371–394. doi: 10.1068/p010371. [DOI] [PubMed] [Google Scholar]
- Bisley JW, Zaksas D, Pasternak T. Microstimulation of cortical area MT affects performance on a visual working memory task. J Neurophysiol. 2001;85:187–196. doi: 10.1152/jn.2001.85.1.187. [DOI] [PubMed] [Google Scholar]
- Britten KH, Shadlen MN, Newsome WT, Movshon JA. The analysis of visual motion: a comparison of neuronal and psychophysical performance. J Neurosci. 1992;12:4745–4765. doi: 10.1523/JNEUROSCI.12-12-04745.1992. [DOI] [PMC free article] [PubMed] [Google Scholar]
- Britten KH, Shadlen MN, Newsome WT, Movshon JA. Responses of neurons in macaque MT to stochastic motion signals. Vis Neurosci. 1993;10:1157–1169. doi: 10.1017/s0952523800010269. [DOI] [PubMed] [Google Scholar]
- Britten KH, Newsome WT, Shadlen MN, Celebrini S, Movshon JA. A relationship between behavioral choice and the visual responses of neurons in macaque MT. Vis Neurosci. 1996;13:87–100. doi: 10.1017/s095252380000715x. [DOI] [PubMed] [Google Scholar]
- Celebrini S, Newsome WT. Neuronal and psychophysical sensitivity to motion signals in extrastriate area MST of the macaque monkey. J Neurosci. 1994;14:4109–4124. doi: 10.1523/JNEUROSCI.14-07-04109.1994. [DOI] [PMC free article] [PubMed] [Google Scholar]
- Cohen MR, Newsome WT. Context-dependent changes in functional circuitry in visual area MT. Neuron. 2008;60:162–173. doi: 10.1016/j.neuron.2008.08.007. [DOI] [PMC free article] [PubMed] [Google Scholar]
- Cook EP, Maunsell JH. Dynamics of neuronal responses in macaque MT and VIP during motion detection. Nat Neurosci. 2002;5:985–994. doi: 10.1038/nn924. [DOI] [PubMed] [Google Scholar]
- DeAngelis GC, Newsome WT. Perceptual “read-out” of conjoined direction and disparity maps in extrastriate area MT. PLoS Biol. 2004;2:E77. doi: 10.1371/journal.pbio.0020077. [DOI] [PMC free article] [PubMed] [Google Scholar]
- DeAngelis GC, Cumming BG, Newsome WT. Cortical area MT and the perception of stereoscopic depth. Nature. 1998;394:677–680. doi: 10.1038/29299. [DOI] [PubMed] [Google Scholar]
- Ditterich J, Mazurek ME, Shadlen MN. Microstimulation of visual cortex affects the speed of perceptual decisions. Nat Neurosci. 2003;6:891–898. doi: 10.1038/nn1094. [DOI] [PubMed] [Google Scholar]
- Dodd JV, Krug K, Cumming BG, Parker AJ. Perceptually bistable three-dimensional figures evoke high choice probabilities in cortical area MT. J Neurosci. 2001;21:4809–4821. doi: 10.1523/JNEUROSCI.21-13-04809.2001. [DOI] [PMC free article] [PubMed] [Google Scholar]
- Evarts EV. A technique for recording activity of subcortical neurons in moving animals. Electroencephalogr Clin Neurophysiol. 1968;24:83–86. doi: 10.1016/0013-4694(68)90070-9. [DOI] [PubMed] [Google Scholar]
- Green DM, Swets JA. Signal detection theory and psychophysics. New York: Wiley; 1966. [Google Scholar]
- Hernández A, Zainos A, Romo R. Neuronal correlates of sensory discrimination in the somatosensory cortex. Proc Natl Acad Sci U S A. 2000;97:6191–6196. doi: 10.1073/pnas.120018597. [DOI] [PMC free article] [PubMed] [Google Scholar]
- Judge SJ, Richmond BJ, Chu FC. Implantation of magnetic search coils for measurement of eye position: an improved method. Vision Res. 1980;20:535–538. doi: 10.1016/0042-6989(80)90128-5. [DOI] [PubMed] [Google Scholar]
- Kiani R, Hanks TD, Shadlen MN. Bounded integration in parietal cortex underlies decisions even when viewing duration is dictated by the environment. J Neurosci. 2008;28:3017–3029. doi: 10.1523/JNEUROSCI.4761-07.2008. [DOI] [PMC free article] [PubMed] [Google Scholar]
- Kohn A, Smith MA. Stimulus dependence of neuronal correlation in primary visual cortex of the macaque. J Neurosci. 2005;25:3661–3673. doi: 10.1523/JNEUROSCI.5106-04.2005. [DOI] [PMC free article] [PubMed] [Google Scholar]
- Krug K, Cumming BG, Parker AJ. Comparing perceptual signals of single V5/MT neurons in two binocular depth tasks. J Neurophysiol. 2004;92:1586–1596. doi: 10.1152/jn.00851.2003. [DOI] [PubMed] [Google Scholar]
- Lee D, Port NL, Kruse W, Georgopoulos AP. Variability and correlated noise in the discharge of neurons in motor and parietal areas of the primate cortex. J Neurosci. 1998;18:1161–1170. doi: 10.1523/JNEUROSCI.18-03-01161.1998. [DOI] [PMC free article] [PubMed] [Google Scholar]
- Liu J, Newsome WT. Local field potential in cortical area MT: stimulus tuning and behavioral correlations. J Neurosci. 2006;26:7779–7790. doi: 10.1523/JNEUROSCI.5052-05.2006. [DOI] [PMC free article] [PubMed] [Google Scholar]
- Matsumora T, Koida K, Komatsu H. Relationship between color discrimination and neural responses in the inferior temporal cortex of the monkey. J Neurophysiol. 2008;100:3361–3374. doi: 10.1152/jn.90551.2008. [DOI] [PubMed] [Google Scholar]
- Maynard EM, Hatsopoulos NG, Ojakangas CL, Acuna BD, Sanes JN, Normann RA, Donoghue JP. Neuronal interactions improve cortical population coding of movement direction. J Neurosci. 1999;19:8083–8093. doi: 10.1523/JNEUROSCI.19-18-08083.1999. [DOI] [PMC free article] [PubMed] [Google Scholar]
- Mazurek ME, Roitman JD, Ditterich J, Shadlen MN. A role for neural integrators in perceptual decision making. Cereb Cortex. 2003;13:1257–1269. doi: 10.1093/cercor/bhg097. [DOI] [PubMed] [Google Scholar]
- Neri P, Levi DM. Receptive versus perceptive fields from the reverse-correlation viewpoint. Vision Res. 2006;46:2465–2474. doi: 10.1016/j.visres.2006.02.002. [DOI] [PubMed] [Google Scholar]
- Newsome WT, Paré EB. A selective impairment of motion perception following lesions of the middle temporal visual area (MT) J Neurosci. 1988;8:2201–2211. doi: 10.1523/JNEUROSCI.08-06-02201.1988. [DOI] [PMC free article] [PubMed] [Google Scholar]
- Newsome WT, Wurtz RH, Dürsteler MR, Mikami A. Deficits in visual motion processing following ibotenic acid lesions of the middle temporal visual area of the macaque monkey. J Neurosci. 1985;5:825–840. doi: 10.1523/JNEUROSCI.05-03-00825.1985. [DOI] [PMC free article] [PubMed] [Google Scholar]
- Newsome WT, Britten KH, Movshon JA. Neuronal correlates of a perceptual decision. Nature. 1989;341:52–54. doi: 10.1038/341052a0. [DOI] [PubMed] [Google Scholar]
- Nichols MJ, Newsome WT. Middle temporal visual area microstimulation influences veridical judgments of motion direction. J Neurosci. 2002;22:9530–9540. doi: 10.1523/JNEUROSCI.22-21-09530.2002. [DOI] [PMC free article] [PubMed] [Google Scholar]
- Nienborg H, Cumming BG. Macaque V2 neurons, but not V1 neurons, show choice-related activity. J Neurosci. 2006;26:9567–9578. doi: 10.1523/JNEUROSCI.2256-06.2006. [DOI] [PMC free article] [PubMed] [Google Scholar]
- Nienborg H, Cumming BG. Decision-related activity in sensory neurons reflects more than a neuron's causal effect. Nature. 2009 doi: 10.1038/nature07821. in press. [DOI] [PMC free article] [PubMed] [Google Scholar]
- Orban GA, Saunders RC, Vandenbussche E. Lesions of the superior temporal cortical motion areas impair speed discrimination in the macaque monkey. Eur J Neurosci. 1995;7:2261–2276. doi: 10.1111/j.1460-9568.1995.tb00647.x. [DOI] [PubMed] [Google Scholar]
- Parker AJ, Newsome WT. Sense and the single neuron: probing the physiology of perception. Annu Rev Neurosci. 1998;21:227–277. doi: 10.1146/annurev.neuro.21.1.227. [DOI] [PubMed] [Google Scholar]
- Prince SJ, Pointon AD, Cumming BG, Parker AJ. The precision of single neuron responses in cortical area V1 during stereoscopic depth judgments. J Neurosci. 2000;20:3387–3400. doi: 10.1523/JNEUROSCI.20-09-03387.2000. [DOI] [PMC free article] [PubMed] [Google Scholar]
- Purushothaman G, Bradley DC. Neural population code for fine perceptual decisions in area MT. Nat Neurosci. 2005;8:99–106. doi: 10.1038/nn1373. [DOI] [PubMed] [Google Scholar]
- Recanzone GH, Guard DC, Phan ML, Su TK. Correlation between the activity of single auditory cortical neurons and sound-localization behavior in the macaque monkey. J Neurophysiol. 2000;83:2723–2739. doi: 10.1152/jn.2000.83.5.2723. [DOI] [PubMed] [Google Scholar]
- Relkin EM, Pelli DG. Probe tone thresholds in the auditory nerve measured by two-interval forced-choice procedures. J Acoust Soc Am. 1987;82:1679–1691. doi: 10.1121/1.395159. [DOI] [PubMed] [Google Scholar]
- Roitman JD, Shadlen MN. Response of neurons in the lateral intraparietal area during a combined visual discrimination reaction time task. J Neurosci. 2002;22:9475–9489. doi: 10.1523/JNEUROSCI.22-21-09475.2002. [DOI] [PMC free article] [PubMed] [Google Scholar]
- Rudolph K, Pasternak T. Transient and permanent deficits in motion perception after lesions of cortical areas MT and MST in the macaque monkey. Cereb Cortex. 1999;9:90–100. doi: 10.1093/cercor/9.1.90. [DOI] [PubMed] [Google Scholar]
- Salzman CD, Newsome WT. Neural mechanisms for forming a perceptual decision. Science. 1994;264:231–237. doi: 10.1126/science.8146653. [DOI] [PubMed] [Google Scholar]
- Salzman CD, Britten KH, Newsome WT. Cortical microstimulation influences perceptual judgements of motion direction. Nature. 1990;346:174–177. doi: 10.1038/346174a0. [DOI] [PubMed] [Google Scholar]
- Schiller PH. The effects of V4 and middle temporal (MT) area lesions on visual performance in the rhesus monkey. Vis Neurosci. 1993;10:717–746. doi: 10.1017/s0952523800005423. [DOI] [PubMed] [Google Scholar]
- Schiller PH, Lee K. The effects of lateral geniculate nucleus, area V4, and middle temporal (MT) lesions on visually guided eye movements. Vis Neurosci. 1994;11:229–241. doi: 10.1017/s0952523800001590. [DOI] [PubMed] [Google Scholar]
- Shadlen MN, Britten KH, Newsome WT, Movshon JA. A computational analysis of the relationship between neuronal and behavioral responses to visual motion. J Neurosci. 1996;16:1486–1510. doi: 10.1523/JNEUROSCI.16-04-01486.1996. [DOI] [PMC free article] [PubMed] [Google Scholar]
- Smith MA, Kohn A. Spatial and temporal scales of neuronal correlation in primary visual cortex. J Neurosci. 2008;28:12591–12603. doi: 10.1523/JNEUROSCI.2929-08.2008. [DOI] [PMC free article] [PubMed] [Google Scholar]
- Snowden RJ, Treue S, Andersen RA. The response of neurons in areas V1 and MT of the alert rhesus monkey to moving random dot patterns. Exp Brain Res. 1992;88:389–400. doi: 10.1007/BF02259114. [DOI] [PubMed] [Google Scholar]
- Stüttgen MC, Schwarz C. Psychophysical and neurometric detection performance under stimulus uncertainty. Nat Neurosci. 2008;11:1091–1099. doi: 10.1038/nn.2162. [DOI] [PubMed] [Google Scholar]
- Uka T, DeAngelis GC. Contribution of middle temporal area to coarse depth discrimination: comparison of neuronal and psychophysical sensitivity. J Neurosci. 2003;23:3515–3530. doi: 10.1523/JNEUROSCI.23-08-03515.2003. [DOI] [PMC free article] [PubMed] [Google Scholar]
- Uka T, DeAngelis GC. Contribution of area MT to stereoscopic depth perception: choice-related response modulations reflect task strategy. Neuron. 2004;42:297–310. doi: 10.1016/s0896-6273(04)00186-2. [DOI] [PubMed] [Google Scholar]
- Wang XJ. Probabilistic decision making by slow reverberation in cortical circuits. Neuron. 2002;36:955–968. doi: 10.1016/s0896-6273(02)01092-9. [DOI] [PubMed] [Google Scholar]
- Zohary E, Shadlen MN, Newsome WT. Correlated neuronal discharge rate and its implications for psychophysical performance. Nature. 1994;370:140–143. doi: 10.1038/370140a0. [DOI] [PubMed] [Google Scholar]