Abstract
The cornea's acoustic properties (speed-of-sound, backscatter, attenuation) are related to its state of hydration. Our aim was to determine these properties as a function of corneal hydration using high frequency ultrasound. Bovine corneas were suspended in a Dexsol-equivalent corneal preservation medium at 33°C and then immersed successively in 75%, 50%, 25% medium and distilled water. Using a 38-MHz focused ultrasound transducer, we measured speed-of-sound and corneal thickness (n=8) and stromal backscatter (n=6) after 45-minutes immersion in each medium. Corneal speed-of-sound was modeled as a function of corneal thickness. We found the mean speed-of-sound to be 1605.4±2.9 m/s in normotensive medium. The maximum observed speed-of-sound was 1616 m/s. As we decreased medium tonicity, the cornea swelled and the speed-of-sound decreased, reaching 1563.0±2.2 m/s in water. Average corneal thickness increased from 969±93 μm in 100% medium to 1579±104 μm in water. Going from 100% medium to water, stromal backscatter (midband-fit) increased from -60.0±0.8 dBr to -52.5±3.5 dBr, spectral slope increased from -0.119±0.021 to -0.005±0.030 dB/MHz and attenuation coefficient decreased from 0.927±0.434 to 0.010±0.581 dB/cm-MHz. The observed correlation between acoustic backscatter and attenuation with the speed-of-sound offers a potential means for more accurate determination of speed-of-sound, and hence thickness, in edematous corneas.
Keywords: cornea, edema, ultrasound, speed-of-sound, backscatter, spectrum-analysis
Introduction
Accurate determination of corneal thickness has an important role in planning refractive surgery, in intraoperative measurement of residual stromal thickness in laser in-situ keratomileusis (LASIK), and in detection and monitoring of pathologies such as keratoconus and Fuch's dystrophy. Corneal thickness also is a factor in measurement of intraocular pressure for evaluation of glaucoma by applanation (Doughty and Zaman 2000; Ehlers et al. 1975; Herndon 2006).
Ultrasound pachymetry has long been the method of choice for corneal thickness assessment. Modern instruments are portable units operating at a frequency of 20 to 50 MHz. After topical anesthesia, the tip of the hand-held probe is touched against the central cornea and hundreds of pulse/echo waveforms are acquired and processed in a fraction of a second. Corneal thickness is determined from vc(tp − ta)/2, where tp and ta represent the time-of-flight between pulse emission and echo detection from the posterior and anterior corneal surfaces respectively and vc represents the speed-of-sound across the cornea. Commercial ultrasound pachymeters use speed-of-sound constants between 1636 m/s and 1640 m/s. The accuracy of ultrasound pachymetry is predicated upon the accuracy and appropriateness of this constant.
Generally, speed-of-sound cannot be measured in vivo, because the true thickness of the tissue is unknown. Table 1 summarizes several ex vivo studies in which the speed-of-sound across the cornea was determined by time-of-flight methods (Chivers et al. 1984; De Korte et al. 1994; Oksala and Lehtinen 1958; Thijssen et al. 1983; Tschewnenko 1965; Ye et al. 1995). The results show considerable variation and, with the exception of an early study by Tschewenko (1965), are significantly lower than the accepted values. Determination of corneal speed-of-sound is problematic because the ex vivo cornea is subject to alteration from its normal state of hydration and biomechanical tension. Arguing that the uncertainty in the corneal speed-of-sound is greater than that of refractive index, Waring and his coworkers (1982) measured corneal thickness by specular microscopy and ultrasound pachymetry in 20 subjects in vivo. A speed-of-sound of 1630 m/s was found to produce the best correspondence between these methods.
Table 1.
Ex vivo corneal speed-of-sound determinations with measurement conditions.
| Velocity (m/s) | Species | Medium | Temperature (°C) | Frequency (MHz) | Year | Investigator |
|---|---|---|---|---|---|---|
| 1550 | Cow | Water | 22 | 4 | 1958 | Oksala4 |
| 1639 | Human | Water | 37 | 2.5 | 1965 | Tschewnenko5 |
| 1555 | Pig | Saline | 20 | 10 | 1983 | Thjissen6 |
| 1550 | Cow | Saline | 22 | 4 | 1984 | Chivers7 |
| 1588 | Pig | Saline | 20 | 20 | 1994 | De Korte8 |
| 1575 | Human | Saline | 37 | 60 | 1995 | Ye9 |
The corneal speed-of-sound ‘constant’ will be affected by the cornea's state of hydration. Maurice suggested that the loss of transparency associated with corneal edema results from entry of water into the corneal ground substance, with the collagen fibers themselves remaining relatively unchanged but their orderly spatial arrangement disturbed (Maurice, 1957). This concept was further developed by others (Doughty 2000; Farrell et al 1973; Hedbys and Mishima 1966; Meek et al. 1991, 2003). The reduction of the volume fraction of the solid components of the cornea by edema would be expected to reduce the refractive index, and similarly, the speed-of-sound. Several studies relating refractive index changes to hydration have appeared (Hedbys and Mishima 1962; Kim et al 2004; Meek et al. 2003). The corneal opacification that occurs in corneal edema results from increased optical backscatter due to disorganization of the spatial arrangement of collagen fibrils. This disorganization would similarly be expected to cause increased acoustic backscatter.
In this report, we describe hydration-dependent changes in the speed-of-sound and frequency-dependent stromal acoustic backscatter and attenuation in ex vivo cow corneas.
Materials and Methods
Tissue Preparation
Fresh cow eyes were obtained from a commercial abattoir specializing in supply of animal tissues for medical research. We excised the corneas along with a 3-mm wide ring of sclera and placed them in a Dexsol-equivalent medium at 33°C (the temperature of the cornea in vivo).
The medium was composed of MEM base medium (Mediatech, Inc., Herndon, VA) with 1.35% chondroitin sulfate (MP Biomedicals, Inc., Solon, OH), 1% T-500 dextran (Indofine Chemical Co., Inc., Hillsborough, NJ), 1 mM sodium pyruvate (VWR Scientific Products, West Chester, PA) and 0.1 mM nonessential amino acids (Sigma, St. Louis, MO). We also prepared media at 75%, 50% and 25% concentrations by dilution with distilled water.
Ultrasound Hardware
The ultrasound system consisted of a focused single-element transducer (6-mm aperture, 12-mm focal length) with 38 MHz center frequency and a 58% 6-dB bandwidth. The transducer was attached to a 3-axis computer-controlled linear positioning system (Newport Corporation, Irvine, CA) with a positional precision of 1-μm. During scanning, the transducer was excited by a broadband pulser/receiver (Model 5900, Panametrics, Waltham, MA) and radiofrequency (RF) echo-data were digitized (Acqiris DP310, Agilent Technologies, Monroe, NY) at a sample rate of 400 MHz, corresponding to a sample interval of approximately 1.9 μm, with 12-bit resolution. Scan motion and data acquisition were controlled by custom software developed under LabView (National Instruments, Austin, TX).
Ultrasound Signal Processing
Time of flight measurements were performed using a signal processing strategy designed to optimally localize each interface. The reflection of a glass plate aligned normal to the beam axis in the focal plane was recorded. Treating this as the system impulse response, we enhanced the resolution of tissue signals by deconvolving against this signal by complex division in the frequency domain (Reinstein et al. 1993). The signal envelope was then defined using the analytic signal magnitude (Gammell 1981) of the deconvolved signal. In this representation, peaks correspond to points of maximal acoustic impedance change, i.e., tissue interfaces. The combination of the inherently high resolution afforded by the high frequency of the emitted pulse, the enhancement in resolution provided by the deconvolution operation, and the optimal definition of the signal envelope by the use of the analytic signal provide a means for reproducibly measuring corneal thickness (Reinstein et al 1994).
Acoustic backscatter results from the presence of acoustic impedance (density × speed-of-sound) inhomogeneities in a tissue. Because all transducers emit acoustic energy over a usually Gaussian-shaped spectrum about a nominal center frequency, the frequency dependence of backscatter can be determined from echo data by comparing the received backscatter spectrum to that emitted by the transducer. Scattering theory shows that the size, concentration and relative impedance of impedance inhomogeneities affects the power spectrum of acoustic backscatter (Lizzi et al. 1983). We used a short-term spectrum analysis approach to generate spectral parameter images in which pixels represent a spectral parameter and analyzed these images to quantify frequency-dependent backscatter properties (Lizzi et al. 1997, 2006). A gated region 32 samples in depth by 3 vectors wide was moved one sample at a time over successive vectors within the demarcated tissue zone (the corneal stroma). At each position, the power spectrum of the echo data was determined and expressed on a decibel scale. The tissue power spectrum was then normalized by subtracting the glass plate power spectrum (representing a perfect reflector), compensating for transducer and other system factors. Because the normalized power spectrum is generally quasi-linear in form, it is characterized by the linear best fit equation over the useful (-15 dB) bandwidth of the transducer. Spectral parameter images depicting the slope of this equation (representing frequency dependence of backscatter) in dB/MHz and the amplitude at the center frequency (midband-fit) in dBr (decibels with respect to the glass-plate power spectrum) were generated by averaging groups of eight successive calibrated power spectra per pixel. The frequency-dependent attenuation coefficient in dB/cm-MHz was then determined from the change in spectral slope (dB/MHz) with depth (cm) by computing the linear best fit of slope versus depth along each vector (Funk et al. 1983). In the absence of attenuation, spectral slope is a function of scatterer diameter. Midband-fit is a sensitive measure to total backscatter, and is related to the size and concentration (number per unit volume) of scatterers. The attenuation coefficient is affected by acoustic absorption and scattering.
Speed-of-sound determination
We measured the speed-of-sound of the immersion media as follows: The time-of-flight to a flat glass reflector placed in the transducer focal plane was determined with 33°C distilled water as the coupling medium. From the observed time-of-flight, tw, and the known speed-of-sound in water at 33°C, vw = 1515.9 m/s, the true range to the reflector, d, was determined using d = 2vwtw. The water was then replaced with 33°C medium and time-of-flight, tm, again determined. The speed-of-sound in the medium, vm, could then be computed from vm = 0.5d/tm = vwtw/tm. This procedure was repeated five times for each medium concentration.
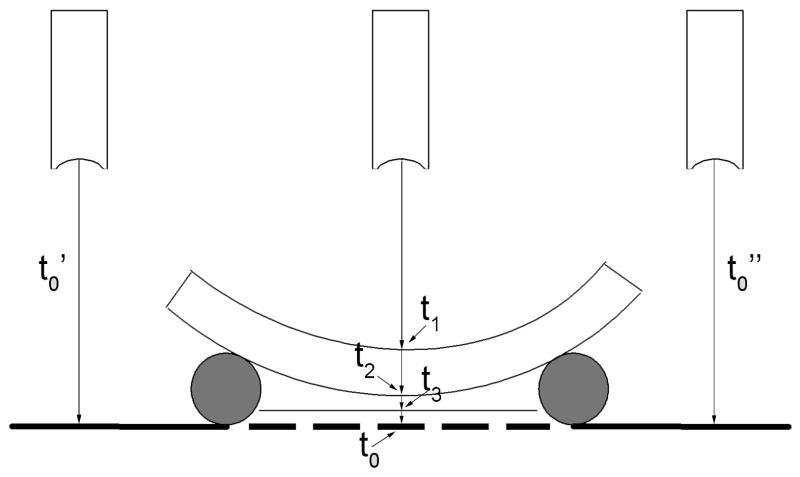
The setup for corneal speed-of-sound determination is illustrated schematically in Fig. 1. We attached 5/8″ diameter rubber rings to the center of glass microscopy slides with a cyanoacrylate adhesive. After cutting several gaps into the rings to allow medium circulation, we placed cyanoacrylate drops on two spots on the ring to which the cornea was attached, epithelium facing downwards. Eight corneas were prepared in this manner. We then submerged the corneas in 100% medium and adjusted the range so that the glass surface was in the focal plane. Each scan consisted of 512 vectors at 0.1-mm intervals, for a total scan width of 5.12-cm, with the cornea centered within the scan. Three scans in parallel planes of each cornea were acquired at 0.25-mm intervals.
Figure 1.
Schematic representing setup for corneal speed-of-sound determinations. The cornea rests face downwards on a rubber ring. The time of flight of the ultrasound pulse to the cornea, t1, across the cornea (t2 − t1) and to a flat glass surface underlying the cornea, t3, are determined. By measuring the time-of-flight to the glass surface on either side of the cornea (t0′ and t0″), we can interpolate the time-of-flight to the glass surface at any position beneath the cornea, had the cornea not been present. Corneal speed-of-sound can then be determined from the trans-corneal time-of-flight and the shift between the interpolated and observed positions of the underlying glass surface plus the known speed-of-sound of the immersion medium.
The area of the central cornea was manually demarcated on a computer display of the ultrasound image. The anterior and posterior corneal surfaces then were semi-automatically detected and time-of-flight computed using the methods described above. Next, the time-of-flight to the surface of the glass slide directly underneath the central cornea and on either side of the cornea (with no intervening tissue between the transducer and slide surface) were determined. Linear interpolation between the glass-plate surfaces to either side of the cornea was then used to determine what the range to the glass slide would have been along each vector had the intervening cornea not been present.
Mathematically, speed-of-sound value was determined as follows: Without intervening cornea, the distance from the transducer to the glass slide surface is 0.5vmt0, where vm represents the previously determined speed-of-sound in the medium, and t0 is the observed time-of-flight between pulse emission and echo return. With cornea present, three time-of-flight measurements are made: t1, to the upper surface (endothelium), t2 to the lower surface (epithelial surface), and t3 to the underlying glass slide surface. The distance from the transducer to the endothelium is 0.5vmt1, corneal thickness is 0.5vc(t2 − t1) and the distance from the epithelium to the glass surface is 0.5vm(t3 − t2). Thus, the distance from the transducer to the glass surface with cornea present will be 0.5(vmt1 + vc(t2 − t1) + vm(t3 − t2)). Because the distance from the transducer to the glass surface is the same with or without cornea present, then vmt0 = vmt1 + vc(t2 − t1) + vm(t3 − t2), with vc representing the only unknown. Thus, vc = vm(t0 − t1 − t3 + t2)/(t2 − t1).
We considered the effect of refraction on measurements. Assuming a 1-mm corneal thickness, a 10-mm radius of curvature and speeds-of-sound of 1520 and 1600 m/s in the medium and cornea respectively, we find that at the edge of the central cornea (±3.0-mm from the apex), the angle of entry of the ultrasound beam relative to the corneal surface deviates 17.5-degrees from normal. Given the above parameters, by Snell's law the ultrasound beam angle will increase to 18.5-degrees across this interface. This will result in an increase of a fraction of a micron in the apparent thickness of the (assumed 1000 micron thick) cornea, which will have a negligible effect on speed-of-sound determinations.
After scanning the cornea in 100% medium, the cornea was immersed in 75% medium for 45 minutes and the procedure was repeated. This was then repeated successively in 50% medium, 25% medium and distilled water.
Acoustic backscatter determination
Six corneas were prepared in a manner similar to that described above, but placed with the epithelium facing upwards. The central corneas were placed in the focal plane of the transducer and scan data acquired on 128 vectors spaced at 20-μm intervals. Five parallel scan planes at 50-μm intervals were acquired. After scanning the corneas in 100% medium, the procedure was repeated at successive dilutions as described above.
Calibrated spectrum analysis was performed by first demarcating the anterior corneal stroma just beneath Bowman's membrane and selecting the next 1-mm of tissue for analysis. We determined the mean slope, midband-fit and attenuation coefficient values for each scan and then averaged the five scans of each cornea obtained at each concentration of the medium.
Because frequency dependent attenuation affects spectral slope and midband-fit, we computed attenuation-corrected power spectra as well. This was accomplished by adjusting spectral slope as a function of tissue depth to compensate for the observed mean attenuation coefficient.
Speed-of-sound – corneal hydration model
As early as 1957, Maurice considered the effect of hydration on the cornea's refractive index (Maurice, 1957). This has more recently been modeled by Kim et al. (2004) and Meek et al. (2003). These models treat the cornea mathematically as consisting of dry (collagen and solid components of the ground substance) and fluid components and make use of the Gladstone-Dale law of mixtures, which states that the refractive index of a composite is equal to the sum of the refractive indices of the components weighted by their volume fractions. Since refractive index varies inversely with the phase velocity of light through a medium, this is equivalent to stating that the total transit time for light across a composite material is equal to the sum of the transit times across each serial volume fraction. In such a model, as the cornea is progressively hydrated, the solid component thickness remains constant while the fluid component thickness increases. From these, the cornea's overall theoretical refractive index can be calculated for any hydration state. Here, we apply this conceptual framework to propagation of ultrasound across the cornea as a function of hydration.
Hedbys (1962) determined the hydration to dry mass relationship for the bovine cornea to be H = 0.0053T − 0.67, where H represents hydration (water weight/solid weight) and T represents stromal thickness in microns. From this, the thickness of the completely dehydrated stroma is 0.67/0.0053 = 126-μm (assuming a 1-g/cm3 density). Given that our data refer to total corneal thickness (including epithelium), we assume an approximately 10% higher desiccated corneal thickness of 139-μm. Based on this value, we modeled the speed-of-sound as a function of corneal thickness as follows:
We assume that the time of flight across the cornea as a whole, tc, is the sum of the transit times across the water fraction, tw and the solid fraction, ts, which is a constant.
| (1) |
Since d = vt, where d = distance and v = speed-of-sound, then
| (2) |
Since dw = (dc − ds), then,
| (3) |
Substituting known values, ds = 139-μm and vw = 1515.9 m/s and rearranging gives,
| (4) |
allowing calculation of vs given measured values of corneal thickness and speed-of-sound. Using equation (4), we calculated values of vs for all corneas under all hydration conditions and then calculated the mean value of vs over all corneas, vŝ. We then defined the speed-of-sound as a function of corneal thickness by rearranging equation (4) to the form,
| (5) |
Relationship between speed-of-sound and acoustic backscatter
Having measured speed-of-sound and corneal thickness over a range of hydration conditions, we then examined the data to determine to what extent backscatter properties (which can be determined non-invasively) can be used to estimate sound velocity. Combining the mean spectral parameters with the mean corneal thickness and speed-of-sound values determined for each medium concentration, we performed stepwise multiple linear regression, with the spectral slope, midband-fit and attenuation coefficients as the independent variables and sound velocity as the dependent variable.
Results
The mean speed-of-sound at 33°C with 95% confidence bounds for each concentration of the medium was 1534.9±0.4 m/s for 100% medium, 1530.6±0.6 m/s for 75% medium, 1527.6±0.4 m/s for 50% medium and 1520.1±0.2 m/s for 25% medium.
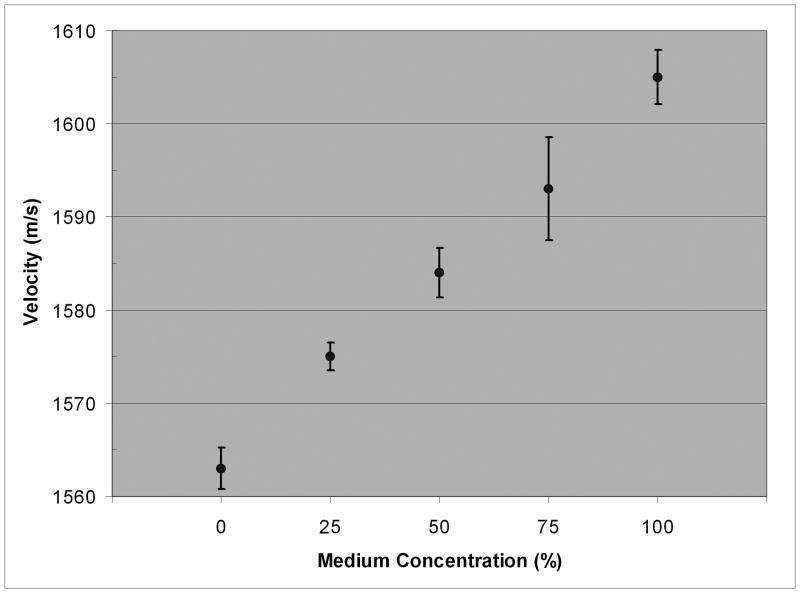
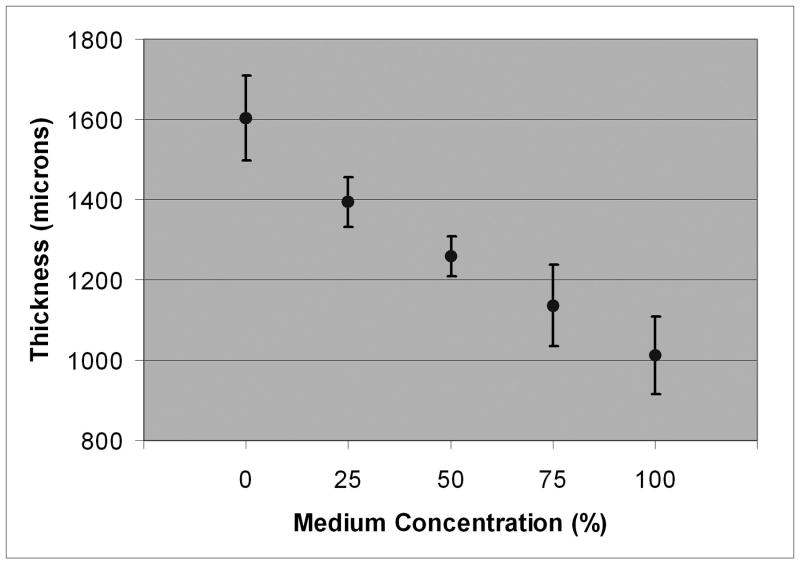
In 100% Dexsol-equivalent medium, the mean corneal sound velocity was 1605 m/s (range = 1600-1616 m/s). The sound velocity and mean thickness values for the central cornea at each medium concentration are summarized in Table 2 and plotted in Figs. 2 and 3.
Table 2.
Mean sound velocity and corneal thickness values with 95% confidence bounds at each medium concentration (n=8).
| Medium Concentration (%) | Velocity (m/s) | Thickness (μm) |
|---|---|---|
| 100 | 1605 ± 2.9 | 970 ± 93 |
| 75 | 1593 ± 5.5 | 1098 ± 99 |
| 50 | 1584 ± 2.7 | 1223 ± 49 |
| 25 | 1575 ± 1.5 | 1362 ± 61 |
| 0 | 1563 ± 2.2 | 1579 ± 104 |
Figure 2.
Mean corneal speed-of-sound with 95% confidence bounds for each medium concentration.
Figure 3.
Mean corneal thickness with 95% confidence bounds as function of medium concentration.
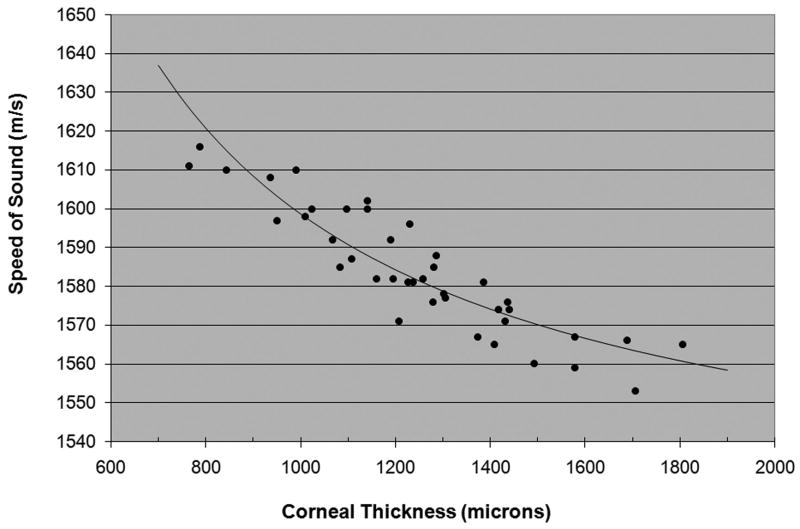
Fig. 4 plots the speed-of-sound of each cornea under any and all medium conditions as a function of thickness. Superimposed upon the plot is the model described by equation 7, in which vŝ, the speed-of-sound in the dehydrated cornea, was computed to be 2415-m/s based on the assumption of a 139-μm thick dehydrated cornea. Substituting this value in equation (5), the model is defined as vc = dc/[(dc − 139)/1515.9 + 139/2415], where dc is expressed in microns and vc is in units of m/s.
Figure 4.
Scatterplot of the speed-of-sound versus thickness for each cornea. Superimposed is the best-fit model equation.
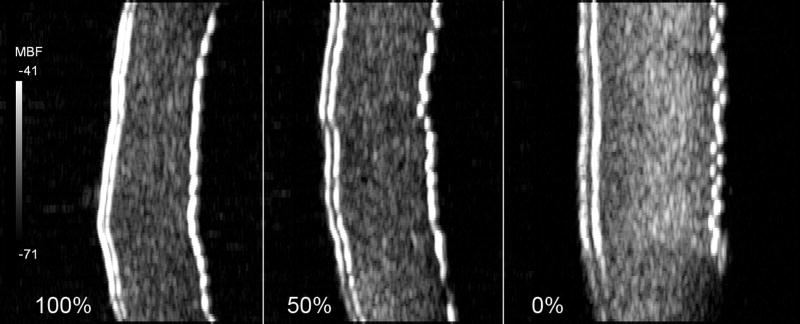
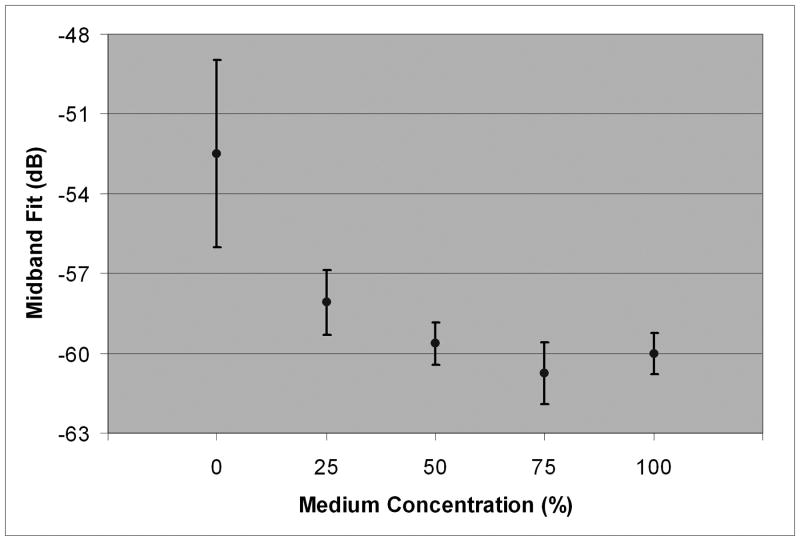
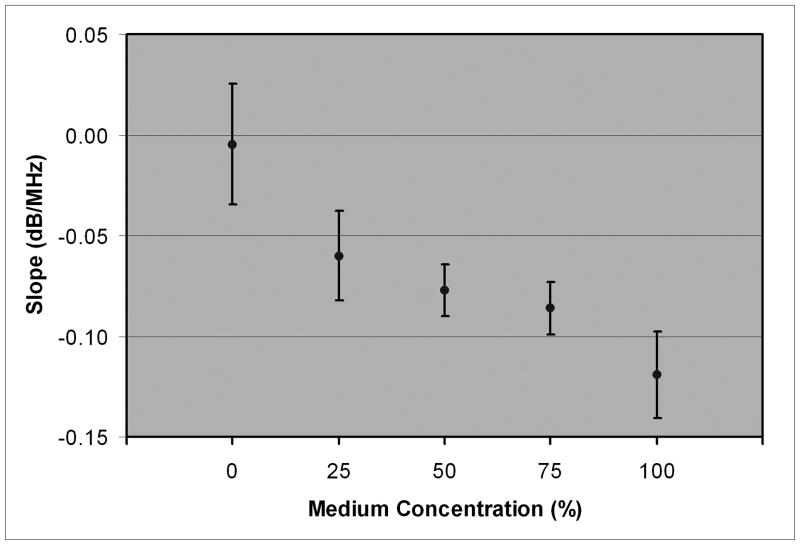
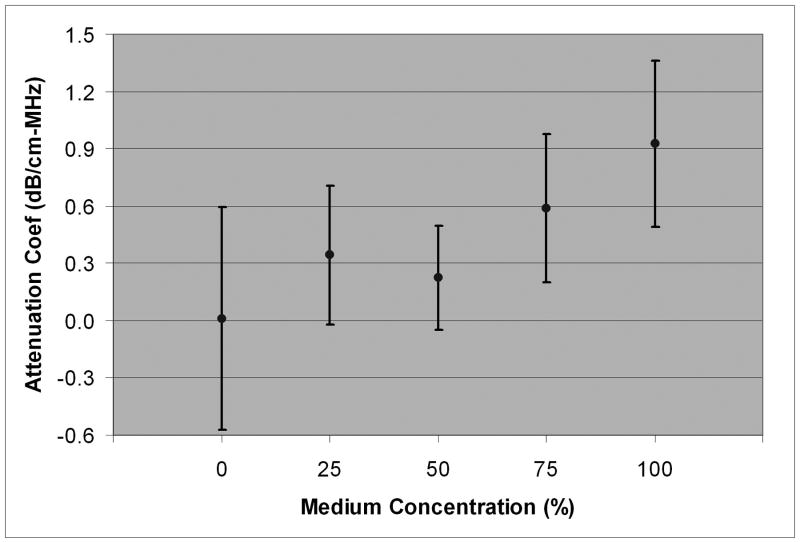
Fig. 5 shows an example of the appearance of one cornea in 100% medium, 50% medium and water. The increase in stromal and epithelial thickness with media dilution is apparent, as is a general increase in backscatter. Table 3 summarizes stromal backscatter parameter statistics for each medium concentration. Plots of slope, midband-fit and attenuation coefficient are provided in Figs. 6, 7 and 8.
Figure 5.
Midband fit backscatter images of one cornea in 100% medium, 50% medium and water. The epithelium and Bowman's membrane are on the left of each image. Both epithelial and stromal thickening are evident. Increased stromal backscatter is most evident with the cornea suspended in water.
Table 3.
Stromal backscatter parameters and 95% confidence bounds as a function of medium concentration.
| Slope (dB/MHz) | Midband Fit (dB) | Attenuation Coefficient (dB/cm-MHz) | |||
|---|---|---|---|---|---|
| Medium Concentration (%) | Unadjusted | Attenuation- Compensated | Unadjusted | Attenuation-Compensated | |
| 100 | -0.119 ± 0.021 | -0.033 ± 0.073 | -60.0 ± 0.8 | -57.0 ± 0.9 | 0.927 ± 0.434 |
| 75 | -0.086 ± 0.013 | -0.032 ± 0.027 | -60.7 ± 1.2 | -58.8 ± 0.9 | 0.585 ± 0.389 |
| 50 | -0.077 ± 0.013 | -0.059 ± 0.021 | -59.6 ± 0.8 | -59.0 ± 0.7 | 0.225 ± 0.273 |
| 25 | -0.060 ± 0.022 | -0.026 ± 0.024 | -58.1 ± 1.2 | -56.9 ± 1.2 | 0.342 ± 0.363 |
| 0 | -0.005 ± 0.030 | -0.011 ± 0.026 | -52.5 ± 3.5 | -52.6 ± 5.3 | 0.010 ± 0.581 |
Figure 6.
Mean midband fit with 95% confidence bounds as a function of medium concentration.
Figure 7.
Mean spectral slope with 95% confidence bounds as a function of medium concentration.
Figure 8.
Mean frequency-dependent attenuation coefficient as a function of medium concentration.
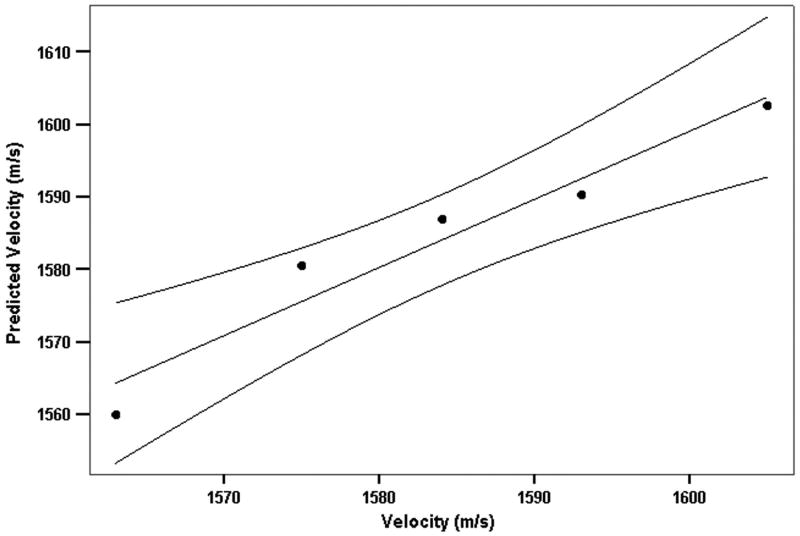
We examined the utility of backscatter parameters for prediction of sound velocity by stepwise multiple linear regression. At step 1, slope was entered and at step 2 midband-fit. The model had an R2 of 0.941 and root mean square residual of 4.1 m/s. A plot of measured velocity versus velocity predicted from spectral slope and midband-fit values is provided in Fig. 9.
Figure 9.
Regression model relating backscatter spectral properties (slope and midband fit) to speed-of-sound. Plot shows speed-of-sound predicted by the regression formula versus observed speed-of-sound for each medium concentration with 95% confidence bounds.
Discussion
We found a mean sound velocity of 1605-m/s for bovine corneas suspended in a Dexsol-equivalent preservation medium at 33°C. The thinnest cornea in the group had a speed-of-sound value of 1616-m/s. While substantially higher than the ex vivo speed-of-sound values of the cornea for various species under various conditions summarized in Table 1, these values remain 1.5 to 2% lower than the accepted value of 1636-1640 m/s for the human cornea in vivo. A number of possible interpretations can be offered for this result: 1) the accepted values are too high, 2) bovine corneas have lower intrinsic sound velocity than human corneas, or 3) some edema had occurred during shipment and/or preparation of the corneas. Whatever the cause, our findings may be interpreted as setting a lower bound on the true corneal speed-of-sound and setting the upper limit on the systematic error that would result from use of an incorrect speed-of-sound constant.
We found that sound velocity decreased with edema and observed a relationship between backscatter and edema. The attenuation coefficient was found to be highest and spectral slope to be lowest in corneas suspended in normotensive medium. In theory, in the absence of attenuation, spectral slope increases as scatterer diameter decreases, with Rayleigh (frequency to the 4th-power) scattering occurring for diameters much smaller than a wavelength (Lizzi et al. 1983). Frequency-dependent attenuation, however, would result in decreasing slope values with increasing tissue depth because of greater absorption of the higher frequency components of the emitted acoustic pulse. Our results showed that the increase in spectral slope with edema was largely a result of decreasing attenuation. However, the increase in backscatter with corneal edema as measured by midband-fit was greater than could be accounted for by decreased attenuation alone. This effect is likely a result of increasing disorganization of the collagen fibers, a process that also is responsible for increased optical scattering (and hence opacification) of the cornea with edema. We found a relationship between backscatter and speed-of-sound that might enable determination of a more appropriate speed-of-sound constant for edematous corneas.
The equation we derived to relate speed-of-sound to corneal thickness allows estimation of the error that would result from using the standard speed-of-sound constant in edematous corneas. If we assume a nominal normal bovine corneal thickness of 800-μm, then a 10% increase in corneal thickness caused by edema would result in a 0.6% decrease in the speed-of-sound. A 20% increase in corneal thickness would result in a 1.1% decrease in the speed-of-sound. If we apply these speed-of-sound error values to a normally 540-μm thick human cornea with 10% and 20% edematous swelling, then use of the standard speed-of-sound constant would result in 4-μm and 7-μm overestimates of true corneal thickness, respectively. However, because the speed-of-sound versus corneal thickness curve rises more steeply with dehydration, this relatively small effect would become more serious with abnormal dehydration, a situation not normally encountered clinically but which might occur for instance during LASIK surgery.
Acknowledgments
We would like to acknowledge the assistance of Karan Sarup and Palak Patel in this project.
Supported in part by: NIH grant EB000238, Research to Prevent Blindness and the Dyson Foundation.
Footnotes
Proprietary Interests: None
Publisher's Disclaimer: This is a PDF file of an unedited manuscript that has been accepted for publication. As a service to our customers we are providing this early version of the manuscript. The manuscript will undergo copyediting, typesetting, and review of the resulting proof before it is published in its final citable form. Please note that during the production process errors may be discovered which could affect the content, and all legal disclaimers that apply to the journal pertain.
References
- Chivers RC, Round WH, Zieniuk JK. Investigation of ultrasound axially traversing the human eye. Ultra Med Biol. 1984;10:173–188. doi: 10.1016/0301-5629(84)90216-3. [DOI] [PubMed] [Google Scholar]
- De Korte CL, van der Steen AFW, Thijssen JM. Acoustic velocity and attenuation of eye tissues at 20 MHz. Ultra Med Biol. 1994;20:471–480. doi: 10.1016/0301-5629(94)90102-3. [DOI] [PubMed] [Google Scholar]
- Doughty MJ, Zaman ML. Human corneal thickness and its impact on intraocular pressure measures: a review and meta-analysis approach. Surv Ophthalmol. 2000;44:367–408. doi: 10.1016/s0039-6257(00)00110-7. [DOI] [PubMed] [Google Scholar]
- Doughty MJ. Swelling of the collagen-keratocyte matrix of the bovine corneal stroma ex vivo in various solutions and its relationship to tissue thickness. Tissue Cell. 2000;32:478–493. doi: 10.1016/s0040-8166(00)80004-x. [DOI] [PubMed] [Google Scholar]
- Ehlers N, Bramsen T, Sperling S. Applanation tonometry and central corneal thickness. Acta Ophthalmol. 1975;53:34–43. doi: 10.1111/j.1755-3768.1975.tb01135.x. [DOI] [PubMed] [Google Scholar]
- Farrell RA, McCally RL, Tatham PER. Wavelength dependencies of light scattering in normal and cold swollen rabbit corneas and their structural implications. J Physiol. 1973;233:589–612. doi: 10.1113/jphysiol.1973.sp010325. [DOI] [PMC free article] [PubMed] [Google Scholar]
- Funk M, Hottier F, Cardoso JF. Ultrasonic signal processing for in vivo attenuation measurement: short time Fourier analysis. Ultrasonic Imaging. 1983;5:117–135. doi: 10.1177/016173468300500202. [DOI] [PubMed] [Google Scholar]
- Gammell PM. Improved ultrasonic detection using the analytic signal magnitude. Ultrasonics. 1981;19:73–76. [Google Scholar]
- Hedbys BO, Mishima S. Flow of water in the corneal stroma. Exp Eye Res. 1962;1:262–275. doi: 10.1016/s0014-4835(62)80010-4. [DOI] [PubMed] [Google Scholar]
- Hedbys BO, Mishima S. The thickness-hydration relationship of the cornea. Exp Eye Res. 1966;5:221–228. doi: 10.1016/s0014-4835(66)80010-6. [DOI] [PubMed] [Google Scholar]
- Herndon LW. Measuring intraocular pressure-adjustments for corneal thickness and new technologies. Current Opinion in Ophthalmology. 2006;17:115–119. doi: 10.1097/01.icu.0000193093.05927.a1. [DOI] [PubMed] [Google Scholar]
- Kim YL, Walsh JT, Goldstick TK, Glucksberg MR. Variation of corneal refractive index with hydration. Phys Med Biol. 2004;49:859–868. doi: 10.1088/0031-9155/49/5/015. [DOI] [PubMed] [Google Scholar]
- Lizzi FL, Alam SK, Mikaelian S, Lee P, Feleppa EJ. On the statistics of ultrasonic spectral parameters. Ultra Med Biol. 2006;32:1671–1685. doi: 10.1016/j.ultrasmedbio.2006.09.002. [DOI] [PubMed] [Google Scholar]
- Lizzi FL, Astor M, Feleppa EJ, Shao M, Kalisz A. Statistical framework for ultrasonic spectral parameter imaging. Ultra Med Biol. 1997;23:1371–1382. doi: 10.1016/s0301-5629(97)00200-7. [DOI] [PubMed] [Google Scholar]
- Lizzi FL, Greenebaum M, Feleppa EJ, Elbaum M, Coleman DJ. Theoretical framework for spectrum analysis in ultrasonic tissue characterization. J Acoust Soc Am. 1983;73:1366–1373. doi: 10.1121/1.389241. [DOI] [PubMed] [Google Scholar]
- Maurice DM. The structure and transparency of the cornea. J Physiol. 1957;136:263–286. doi: 10.1113/jphysiol.1957.sp005758. [DOI] [PMC free article] [PubMed] [Google Scholar]
- Meek KM, Dennis S, Khan S. Changes in the refractive index of the stroma and its extrafibrillar matrix when the cornea swells. Biophys J. 2003;85:2205–2212. doi: 10.1016/s0006-3495(03)74646-3. [DOI] [PMC free article] [PubMed] [Google Scholar]
- Meek KM, Fullwood NJ, Cooke PH, Elliott GF, Maurice DM, Quantock AJ, Wall RS, Worthington CR. Synchrotron x-ray diffraction studies of the cornea, with implications for corneal hydration. Biophys J. 1991;60:467–474. doi: 10.1016/S0006-3495(91)82073-2. [DOI] [PMC free article] [PubMed] [Google Scholar]
- Oksala A, Lehtinen A. Measurement of the velocity of sound in some parts of the eye. Acta Ophthalmol. 1958;36:633–639. doi: 10.1111/j.1755-3768.1958.tb02271.x. [DOI] [PubMed] [Google Scholar]
- Reinstein DZ, Silverman RH, Rondeau MJ, Coleman DJ. Epithelial and corneal thickness measurements by high-frequency ultrasound digital signal processing. Ophthalmology. 1994;101:140–146. doi: 10.1016/s0161-6420(94)31373-x. [DOI] [PubMed] [Google Scholar]
- Reinstein DZ, Silverman RH, Trokel SL, Allemann N, Coleman DJ. High-frequency ultrasound digital signal processing for biometry of the cornea in planning phototherapeutic keratectomy. Arch Ophthalmol. 1993;111:431–431. doi: 10.1001/archopht.1993.01090040020013. [DOI] [PubMed] [Google Scholar]
- Thijssen MJ, Mol MJ, Timer MR. Acoustic parameters of ocular tissues. Ultra Med Biol. 1983;11:157–161. doi: 10.1016/0301-5629(85)90018-3. [DOI] [PubMed] [Google Scholar]
- Tschewnenko VAA. Uber die ausbreitungsgeschwindigkeit des ultraschalls in den augengeweben. Vol. 14. Zeitschrift der Humbolt-Universitat zu Berlin, Mathematisch-Naturwissenschaftliche Reihe; 1965. pp. 67–69. [Google Scholar]
- Waring GO, Bourne WM, Edelhauer JF, Kenyon KR. The corneal endothelium. Normal and pathologic structure and function. Ophthalmology. 1982;89:531–590. [PubMed] [Google Scholar]
- Ye SG, Harasiewicz KA, Pavlin CJ, Foster FS. Ultrasound characterization of normal ocular tissue in the frequency range from 50 MHz to 100 MHz. IEEE Trans Ultrason Ferro Freq Contr. 1995;42:8–14. [Google Scholar]


