

Abstract
Mature representations of space and number are connected to one another in ways suggestive of a ‘mental number line’, but this mapping could either be a cultural construction or a reflection of a more fundamental link between the domains of number and geometry. Using a manual bisection paradigm, we tested for number line representations in adults, young school children, and preschool children. Non-symbolic numerical displays systematically distorted localization of the midpoint of a horizontal line at all three ages. Numerical and spatial representations therefore are linked prior to the onset of formal instruction, in a manner that suggests a privileged relation between spatial and numerical cognition.
Introduction
Some of the central achievements of formal mathematics depend on the mapping between number and space (e.g., Descartes, 1637/2001; Euclid (in Heath, 1956)). Fundamental to this mapping, and to measurement, is the arrangement of numbers on a line. Is the number line a product of human invention and cultural innovation, or does it spring from a basic propensity of the human mind to link representations of space and number? We explore this issue through studies of adults and children.
The best evidence for mental number lines comes from studies of the impact of spatial information on adults’ numerical processing. When adults identify or compare numbers, they automatically activate an internal representation of a directional spatial continuum (Dehaene, 1992). In most literate adults, this representation yields a temporal advantage in responding to smaller numbers on the left and to larger numbers on the right (the “SNARC effect”: Dehaene, Bossini, & Giraux, 1993; Fias, 2001; Fias, Brysbaert, Geypens, & d’Ydewalle, 1996). The implicit association of a number with a lateralized spatial code also modulates performance in visuo-spatial tasks: appropriately positioned numbers speed the detection of lateralized targets and the initiation of motor movements towards the left or right spatial hemifields (Fischer, 2003; Fischer, Castel, Dodd, & Pratt, 2003).
Finally, neurological patients with left hemifield neglect show a common signature bias both in bisecting a line and in bisecting a numerical interval, overestimating the midpoint number consistently with a rightward bias on a mental number line (Zorzi, Priftis, & Umiltà, 2002; see also Vuilleumier, Ortigue, & Brugger, 2004; Rossetti, Jacquin-Courtois, Rode, Ota, Michel, & Boisson, 2004). Nevertheless, it has been argued that the association between number and spatial laterality is related specifically to the ordinal meaning of numbers (Gevers, Reynvoet, & Fias, 2003; Gevers, Reynvoet, & Fias, 2004), and is modulated by visual scanning habits related to reading (Dehaene et al., 1993; Zebian, 2005, but c.f. Bächtold, Baumüller, & Brugger, 1998; Ito & Hatta, 2004).
Further evidence for a number-space interaction comes from experiments using a different type of line bisection task. In this task, subjects are presented with horizontal lines flanked by Arabic digits, and they indicate the subjective midpoint of each line. Although the flanking numbers are irrelevant to the task, adults show a spatial bias towards the larger number, irrespective of its lateral position (de Hevia, Girelli, & Vallar, 2006; Fischer, 2001). This phenomenon is thought to reflect a cognitive illusion of length brought about by numerical information: a relative expansion of the lateral extent ipsilateral to the larger number (de Hevia et al., 2006; de Hevia, Girelli, Bricolo, & Vallar, 2008). It suggests that representations of length and numerosity are mapped onto an integrated representation of magnitude (Moyer & Landauer, 1967).
What is the source of this mapping? Because all of the above findings were obtained with adults, they could come about in two different ways. First, space and number may be intrinsically related by a common mental metric (e.g., Dehaene, 1997; Gallistel & Gelman, 2000; Walsh, 2003). Alternatively, human adults may come to internalize a linear representation of number because of their extensive exposure to external spatial representations of number, over the course of mathematics instruction and everyday experience. Number lines are introduced to children at the start of school: they are instantiated on rulers, tape measures, thermometers, and other measuring devices. Children and adults, therefore, may learn the mapping of number to space.
Considerable research is consistent with the latter possibility. For example, the tendency to process large numbers more efficiently on the right and small numbers on the left, as indexed by the SNARC effect, emerges over the course of the elementary school years (Berch, Foley, Hill, & Ryan, 1999; van Galen & Reitsma, in press; see also Bachot, Gevers, Fias, & Roeyers, 2005), and is reversed in school children learning to read from right to left (Zebian, 2005). Recent research suggests that the directional mapping of numbers onto space is not entirely triggered by reading performance, since preliterate children display an intuition for the left-to-right organization of numerical magnitude, which the authors identify as deriving from experience in counting (Opfer & Thompson, 2006). Finally, the internal organization of numerical magnitude at different ages is explicitly represented through space in the ‘number line task’, where subjects are asked to place numerical values in a horizontal line (Siegler & Opfer, 2003). Through this task, it has been revealed that younger children and uneducated adults have logarithmic representations of magnitude, in contrast to a more mature, linear pattern of numerical representation, which is achieved across the school years through adulthood (Dehaene, Izard, Spelke & Pica, 2008; Siegler & Opfer, 2003).
These findings suggest that aspects of the spatial representation of number are influenced by experience, culture or instruction, but they do not reveal whether humans have an unlearned, automatic, and non-directional mapping of number to space. First, the numerical information in the above experiments was presented in the form of Arabic digits: a symbolic system that must be learned and that may not have been fully mastered by the youngest children. Second, the spatial/numerical mapping tested in the above experiments is directional: a mapping of larger numbers to the right or left side of space. A basic mapping of space to number may exist, but its direction may be fixed by experience. And third, the above experiments required an explicit processing of the numerical information, e.g., by asking children to place each number on a line (Siegler & Opfer, 2003), or using a parity judgment task (Berch et al., 1999). An automatic, spontaneous interaction between number and space is best probed in a task in which number is irrelevant.
The present experiments investigate these possibilities. We employed the non-directional line bisection task, in which participants indicate the midpoint of a line that is flanked by two numbers of unequal values. In the critical test conditions, we presented the flanking numbers not symbolically, as Arabic digits, but non-symbolically, as arrays of dots. Moreover, in the line bisection numbers are irrelevant to the task. On each trial, adults, school children, or preschool children were presented with a line flanked by two dot arrays differing in numerosity, and they were asked to indicate the midpoint of the line. If number and space are spontaneously related by an abstract and privileged mapping, then adults and children should show a similar bias in their line bisection, choosing as the midpoint a location that is closer to the larger numerosity.
Experiment 1
The first experiment investigated whether nonsymbolic numerical displays cause the same distortion of adults’ line bisection as symbolic numerical displays. On half the trials, adults indicated the midpoint of a line flanked by two Arabic digits, as in past research (de Hevia et al., 2006); on the remaining trials, adults indicated the midpoint of a line flanked by two arrays of dots, matched in numerosity to the digits. If the effects of number on performance in the line bisection task are related to an abstract representation of quantity, and not to a more specific familiarity with Arabic digits arranged in a line, then the same effects should be obtained with symbolic and non-symbolic quantities.
Method
Participants
The participants were 19 adult subjects (8 male; mean age: 25 years), drawn from lists of volunteers in the Psychology Department Study Pool. All participants were right-handed and had normal or corrected-to-normal vision. Informed consent was obtained from participants prior to the study, and the numerical bias was explained at the end of the experiment.
Materials
On each trial, a horizontal black line, 1 mm in width and either 60 or 80 mm in length, was presented in the centre of a horizontally oriented sheet (216 mm wide and 279 mm high). On symbolic number trials, the Arabic numerals ‘2’ and ‘9’, each 4 mm wide and 6 mm high, appeared 1 mm to the left and right of the line. On nonsymbolic trials, the total area occupied by the dots in each array was equal: each dot in the 2-dot array had a 10 mm diameter, occupying an area of 78.5 mm2 each; each dot in the 9-dot array had a 4.71 mm diameter, occupying an area of 17.45 mm2 each. Each array of dots occupied a virtual, not visible circle (30 mm diameter) placed 2 mm apart from the line. Six different arrays of dots were generated in an effort to control and test for configural effects on line bisection (Figure 1).
Figure 1.

Examples of experimental stimuli, in symbolic and in non-symbolic notations.
Design
The experiment consisted of four 16-trial blocks (2 Side of Larger number × 2 Line length × 4 repetitions). All the lines within each block were flanked by the same type of stimuli (digits or dot arrays). The order of trials within each block was random. Blocks of digits and dot arrays were presented in alternation, beginning with digits. Eight different lines flanked by dot arrays were used, resulting from the combination of two 2-dot arrays (one oriented leftwards, and one oriented rightwards) with four 9-dot arrays. These different configurations were randomly distributed across the two blocks.
Procedure
Stimuli were presented one at a time, aligned with reference to the mid-sagittal plane of the body. Subjects were required to mark with a pencil, rapidly and accurately with the right hand, the centre of each line. The flanking numbers were not mentioned.
Analyses
Bisection marks were measured to the nearest millimetre using a ruler where the bisection mark intersected the line. Deviations from the objective centre towards the left were scored as a negative value, deviations towards the right as a positive value. Two subjects were excluded from the analyses because their overall mean bias was more than 2 SD above the group mean (inclusion of these subjects does not change the results). The mean scores for each subject in each condition were calculated and submitted to a 2 by 2 by 2 repeated-measures analysis of variance with the factors Number display (Arabic digits vs. dots), Number direction (Larger quantity on left vs. right), and Line length (60 vs. 80 mm).
Results
Adult participants exhibited a significant directional bias towards the larger number, F(1,16)=81.87, p<.0001. This effect emerged both for Arabic digits (p< .0001, LSD post hoc comparisons; 15/17 subjects exhibited the effect, p<.001, binomial test) and for dot arrays (p< .0001, LSD post hoc comparisons; 16/17 subjects showed the effect, p<.0001, binomial test) (Figure 2). No other effects were significant. Further analyses of performance with the nonsymbolic arrays revealed no systematic effects of the configural relationships produced by variations in the orientation of the dot arrays on biases toward the larger number (all paired ts, n.s.).
Figure 2.

Mean values (±s.e.) of bisection performance (mm) for symbolic and non-symbolic displays in adults.
Finally, absolute deviations from the objective centre of the line did not significantly differ for displays 2–9 vs. 9–2, in either of the two numerical displays(both paired ts<1, n.s.), suggesting that the numerical effect on the bisection task did not depend on the spatial arrangement of the numbers, i.e., left-to-right vs. right-to-left.
Discussion
Experiment 1 replicates the finding that the presence of task-irrelevant Arabic numbers influences adults’ perception of the midpoint of a line, inducing a bias towards the larger number (de Hevia et al., 2006), and they reveal that this phenomenon extends to numbers presented non-symbolically, as arrays of dots. The close correspondence between the findings with symbolic and non-symbolic arrays suggests that the numerical bias on this spatial task reflects an abstract mapping between numerical magnitude, on one hand, and horizontal spatial extent, on the other. Finally, the symmetrical effect of numbers on performance, i.e., similar absolute biases for 2–9 vs. 9–2 displays, supports the existence of a non-directional mapping of numbers onto space.
There is, however, an alternative interpretation of these findings. It is possible that adults’ line bisection in both these conditions was biased not by a mapping of number to space but by an asymmetric distribution of spatial attention. Larger numbers may be more salient than smaller numbers, and thus they may draw subjects’ attention. Since attention has been shown to have an effect on line bisection (Jewell & McCourt, 2000), this effect could account for the findings of Experiment 1. Before turning to studies of children, therefore, the next experiment addressed this possibility.
Experiment 2
Experiment 2 tests the hypothesis that larger numbers are more salient than smaller numbers and draw attention to their location, explaining the observed spatial biases in line bisection with numerical flankers. To address this hypothesis, we have adopted the ‘dot probe task’ (Posner, Snyder, & Davidson, 1980), where participants are asked to identify a target (a black triangle) appearing equally often at the location of the larger number and at the location of the smaller number (both in Arabic and in non-symbolic notations). If larger numbers are more salient, then adults should detect the probe more rapidly when it appears at the location of the larger number.
Method
Participants
The participants were 34 volunteer adult subjects (9 male; mean age: 22 years). Six participants were left-handed and all participants had normal or corrected-to-normal vision. Informed consent was obtained from participants prior to the study, and the purpose of the study was explained at the end of the experiment.
Materials
Numerical stimuli consisted of pairs of numbers ‘2’ and ‘9’, presented either in Arabic notation or in non-symbolic notation. Non-symbolic trials were the same dots arrays used in Experiment 1, as well as the dot arrays used in Experiments 3–6 (described in more detail below). Stimuli were black and projected onto a white screen. At a viewing distance of 60 cm, Arabic numbers were 0.38° by 0.66°, and the virtual circle occupied by dot arrays was 2.19°. The distance between the two numbers was 9.5 cm for short and 13 cm for long length. The target, a black equilateral triangle, was 0.85°, and appeared at the exact same location as the numbers. Subjects seated approximately 60 cm from the screen, and used a USB response pad (Cedrus, RB-530) to provide responses. The presentation of stimuli and collection of responses were controlled by E-Prime software.
Design
The experiment consisted of 96 experimental trials, 48 in Arabic notation and 48 in non-symbolic notation (2 Numerical display × 2 Side of Larger number × 2 Line length × 2 Position of target × 6 repetitions), and 10 catch trials. Non-symbolic trials comprised equal numbers of displays which controlled for overall area, N=16, contour length, N=16, or envelope area, N=16. Catch trials were introduced to reduce anticipatory responses, and did not include the target. The order of trials was random and differed across participants.
Procedure
The experimental task consisted of a simple reaction time (RT) to the onset of a target (a black triangle). Each experimental trial consisted of a fixation cross centred on the screen (500 ms), followed by the pair of numbers centred horizontally on the screen around the fixation cross (500 ms); immediately thereafter, the black triangle (target) appeared either in the location of the smaller or the larger number, and remained present until the subject’s response or for a maximum of 1500 ms. The inter-trial interval lasted 1500 ms.
Subjects were asked to press the left-sided key when the target appeared on the left and the right-sided key when the target appeared on the right, and withhold response when no triangle appeared. They were asked to respond quickly, but not so quickly that they anticipated the target, and to not pay attention to the numbers since they did not predict the position of the black triangle. Reaction times were recorded by the response pad starting at the onset of the target until the subject’s response. At the beginning of the session, eight practice trials with pairs of letters were administered and were not included in the analyses.
Analyses
Data from five participants were excluded from the analyses because they did not withhold the response on all the catch trials (inclusion of these participants does not change the results). Incorrect responses were discarded (0.6% of data). Mean reaction times (RT) for correct answers were computed for every participant and submitted to a 2 by 2 by 2 repeated-measures analysis of variance with the factors Number display (Arabic digits vs. dots), Number direction (Larger quantity on left vs. right), and Position target (left vs. right).
Results and discussion
Participants were significantly faster at detecting the target behind Arabic numbers (336 ms, s.e., 6.6) vs. dot arrays (348 ms, s.e, 6.6), as shown by the reliable effect of number display, F(1,28)=42.8, p< .0001. However, the position of the larger number did not have a significant effect on target detection: when the target appeared on the left, subjects were equally fast to detect it when it appeared behind the larger number (344 ms, s.e., 6.6), or the smaller number (343 ms, s.e., 6.5); similarly, when the target appeared on the right side, participants exhibited similar RTs when it was preceded by the larger (339 ms, s.e., 6.6) or the smaller number (342 ms, s.e., 7.1). The ANOVA showed a null effect of the number direction × position target interaction, F(1,28)=1.27, p=.27. No other effects or interactions were significant.
In order to demonstrate that the experiment had sufficient power to detect an effect of the interaction Number direction × Position target, if it were present, the 95% within-subject confidence interval (CI) was calculated on the basis of the error term of the effect (Loftus & Masson, 1994). This CI was ± 3.1 ms; thus, the experiment had sufficient power to detect a difference between means of 4.4 ms or larger (CI*√2). If the detection of the target would have been significantly faster when preceded by the larger number vs. the smaller number, the present experiment had sufficient power to detect it, since the magnitude of the typical attention effect described in the literature is around 15–30 ms (e.g., Posner et al., 1980).
Finally, data were collapsed across trials where the target and the larger number appeared at the same location and trials where they did not. Mean RTs for detecting the target appearing at the location of the larger number (349 ms, s.e., 7.8) were virtually identical to the mean RTs observed when the target appeared at the location of the smaller number (350 ms, s.e., 8.1), paired t-test, t<1, n.s.
Experiment 2 shows that larger numbers do not preferentially draw attention, relative to smaller numbers. These results suggest that the spatial biases observed in Experiment 1 cannot be accounted for by a simple attentional bias. Instead Experiment 1 provides evidence that numerical information exerts an influence on the mental representation of spatial extent. In light of this finding, the remaining experiments test for this interaction of number and space in children.
Experiment 3
In this experiment, the task used in Experiment 1 was presented to 7-year-old children. Children of this age were investigated first, because they have experience with number lines and yet were found, in previous experiments, to show little interaction of numerical and spatial judgments, i.e., the SNARC effect, only when the task explicitly required access to number magnitude (van Galen & Reitsma, in press). As noted, however, past experiments have presented numbers only in symbolic, Arabic notation, and they have tested only for the culturally variable mapping of numerical magnitudes on to lateral directions. Accordingly, we investigated whether 7-year-old children spontaneously map both non-symbolic and symbolic numbers onto a non-directional representation of linear extent.
Method
The method was the same as in Experiment 1, except as follows.
Participants
The participants were 21 seven-year-old children (9 female; mean age, 7 years, 2 months; range 6 years, 6 months to 7 years, 8 months). Children were recruited from the area of Boston and were tested in the lab; additional children were recruited in the Science Museum of Boston and were tested there. Informed consent was obtained from parents before the experiment was run.
Design and procedure
Children received four blocks of 8 trials each (2 Side of Larger number × 2 Line length × 2 repetitions). Before the experimental trials were presented, the task was modelled by the experimenter, who said ‘Look, I am cutting these lines in the middle’, and then bisected four plain lines. Immediately after, the experimenter presented four plain lines and asked the child to bisect them. All participants showed understanding of the task. Thereafter, the task proceeded as for the adults. After each block of trials, the experimenter asked the child if he/she wanted to continue. All children completed the four blocks.
Analyses
One subject was excluded from the analyses because the overall mean bias was more than 2 SD above the group mean (inclusion of this participant does not change the results). Two trials were excluded from one child who measured the line with the hands prior to the bisection.
Results
Overall, 7-year-old children’s performance was significantly affected by the position of the larger number, F(1,19)=7.17, p=.01 (Figure 3). The effect of numerical display was significant, F(1,19)=5.84, p=.02, with a greater leftward bias with Arabic numbers than with arrays of dots. There was no effect of the position of the larger number in the trials with Arabic flankers (p=.40, LSD post hoc comparisons; only 12/20 subjects showed an effect, p=.5, binomial test), but a reliable effect in the trials with dot arrays (p=.006, LSD post hoc comparisons; 15/20 subjects showed a bias towards the larger nonsymbolic number, p=.04, binomial test). No other interaction was significant, and there were no effects of dot configuration on nonsymbolic performance, either in comparisons across the groups of children tested with different dot configurations (independent samples ts < 1) or in comparisons across variations of orientation of the dots arrays (paired ts, n.s.).
Figure 3.

Mean values (±s.e.) of bisection performance (mm) for symbolic and non-symbolic displays in 7-year-old children.
A final set of analyses compared the performance of 7-year-old children and adults. In order to equate the number of trials across the two groups of participants, we analyzed only the adults’ first two trial blocks. With Arabic digits, adults’ and children’s performance significantly differed both for lines with the larger number on the left, t(35)=2.49, p= .017, and for lines with the larger number on the right, t(35)=2.75, p= .01. In contrast, for arrays of dots their performance was similar in trials with the larger number on the left, t(35)=1.22, p= .23, as well as in trials with the larger number on the right, t<1, thus showing a similar signature bias towards the larger nonsymbolic numerosity.
Discussion
When 7-year-old children were presented with lines flanked by arrays of dots, they showed the same numerical bias on line bisection as was shown by adults. This finding provides evidence that a non-directional mapping between number and space already is established early in the school years, and that it exerts the same, signature bias on children’s line bisection as it does for adults. It is notable that children showed effects of number on the spatial task, even though number was never mentioned to them and was not relevant to the bisection task. Nonsymbolic number representations evidently are accessed automatically at this age.
In contrast, when children were presented with lines flanked by Arabic digits, they showed no comparable bias. These findings accord with the findings of past research, in which 7-year-old children have shown no consistent laterality biases in responding to Arabic numbers (Berch et al., 1999; van Galen & Reitsma, in press). Children’s contrasting performance with nonsymbolic and symbolic arrays suggests that their encoding of numerical information is less consistent or rapid when numbers are presented as Arabic symbols (see Girelli, Lucangeli, & Butterworth, 2000).
Why do seven-year-old children show the signature biasing effect of non-symbolic numbers on their spatial judgments? It is possible that this effect stems from a spontaneously developing linkage between space and number that is universal and unaffected by experience with the measurement devices and symbolic number lines that children encounter in school. Because the 7-year-old participants have had several years of schooling, however, it is possible that the biasing effect stems from a learned internalization of these symbolic devices. Accordingly, the next experiment tested for the mapping between space and number in preschool children.
Experiment 4
In Experiment 4, we presented the task of Experiment 3 to five-year-old children. Because the older children in Experiment 3 showed a systematic bias of number on line bisection only when the numbers were presented non-symbolically, as arrays of dots, Experiment 4 presented children only with the non-symbolic number trials. If the non-directional mapping between space and number emerges spontaneously and independently of instruction in mathematics and measurement, then preschool children also may show the signature bias of numerical displays on spatial judgments.
Method
The method was the same as in Experiment 3, except as follows.
Participants
The participants were 23 five-year-old children (7 male; mean age: 5 years, 1 month, range: 4 years, 5 months to 5 years, 10 months). All children were recruited from the Boston area and were tested in the lab. Informed consent was obtained from the parents before the experiment was run.
Design and Procedure
Children were tested only with the non-symbolic condition, on a total of 16 trials (2 Larger quantity left vs. right × 2 Line length × 4 repetitions). Instructions were the same as in Experiment 2. During the task, children received positive feedback from the experimenter after each trial, along with a reminder of the task (‘Great job, let’s try again to cut the line in the middle’).
Analyses
Performance from one subject was not included in the analyses because the overall mean bias was more than 2 SD above the group mean (inclusion of this participant does not change the results). Each bisection trial from each child was scored, except from one uncodable trial. The mean scores for each child in each condition were submitted to a 2 (side of larger number) by 2 (line length) repeated-measures analysis of variance.
Results
Like adults and older children, 5-year-old children bisected the lines towards the larger non-symbolic number, F(1,21)=13.09, p=.001 (Figure 4). A Wilcoxon signed-rank test confirmed this effect (Z=2.59, p<.01; 16/22 subjects showed the effect, p=.05, binomial test). No other effects were significant (Fs<1), and performance was unaffected by the configural variations in the dot arrays (paired ts, n.s.).
Figure 4.
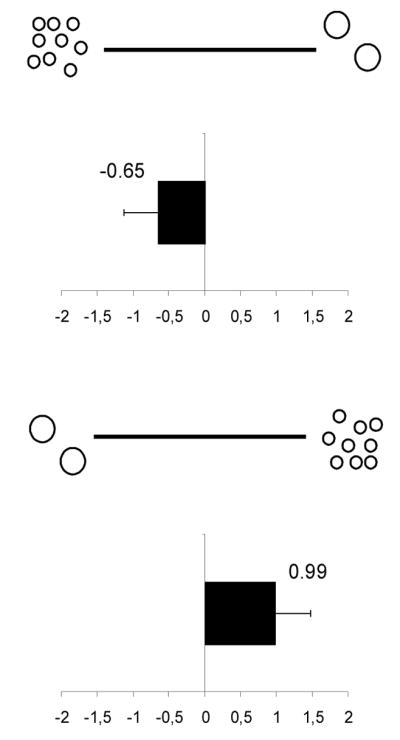
Mean values (±s.e.) of bisection performance (mm) for non-symbolic displays in 5-year-old children.
To explore differences across ages in the non-symbolic trials, we ran an ANOVA with position of the larger number (left, right) as a within-subjects factor, and age group (adults, 7-year-old, and 5-year-old children) as the between-subjects factor. The main effect of position of the larger number was significant F(1,56)=26.64, p<.0001. There was no effect of age group (F<1), nor interaction with the position of the larger number, F(2,56)=1.4, p=.25. Mean biases were similar across the three age groups, with no pairwise age differences on any type of trial (all ts, n.s.).
Discussion
The findings of Experiment 4 replicate and extend those of Experiments 1 and 3 to a younger and unschooled group of children. Five-year-old children showed the same bias of number on judgments of the midpoint of a line, when numbers were presented non-symbolically, as arrays of dots. Moreover, the size of this effect was comparable to that obtained with older children and adults. Because these children have not been to school, they likely have little or no experience with external number lines and measurement tasks. Their performance suggests that the non-directional mapping between space and number emerges spontaneously and independently of instruction.
Nevertheless, questions can be raised about these findings. Although adults performed very similarly with Arabic digits and arrays of dots, suggesting that spatial biases were driven by the abstract numerical information, and although children’s performance resembled that of adults, it is possible that young children’s spatial biases were influenced by non-numerical properties of the displays. Although our manipulation of the continuous variables was conservative, and differences in inter-object distance and size of the single elements were chosen so as to work against the effect of numerical magnitude, children’s line bisections might have been influenced by the total amount of contour length on each end of the line, leading a systematic error towards the array containing more perimeter area (see Clearfield & Mix, 1999, for discussion of this variable). As a second example, children’s line bisections might have been influenced by the perceived size of the gap between each dot array and the line, which may have appeared larger on the side with the smaller number (see Fischer, 1994, for evidence that closer flankers induce a bias towards their side). The remaining experiments were undertaken to replicate the effects of Experiment 4 with controls for these variables.
Experiment 5
Experiment 4 replicates Experiment 3 with displays that control for the amount of contour length in the two arrays of dots that flank the line.
Method
The method was the same as in Experiment 4, except as follows. The participants were 25 five-year-old children (12 male; mean age: 4 years, 11 months, range: 4 years to 5 years, 9 months). Each dot in the 2-dot array had a diameter of 9 mm (overall contour length of the array, 56.5 mm), and each dot in the 9-dot array had a diameter of 2 mm (overall contour length of the array, 56.5 mm). Thus, contour length was equated across these arrays (Figure 3). Two subjects were excluded from the analyses because the overall mean bias was more than 2 SD above the group mean (inclusion of these participants does not change the results). Each bisection trial from each child was scored, except from three uncodable trials.
Results and discussion
Five-year-old children bisected the lines towards the larger non-symbolic number, F(1,22)=9.54, p<.01 (Figure 5). A Wilcoxon signed-rank test confirmed the effect (Z(23)=2.83, p=.004; 19/23 subjects showed the effect, p=.003, binomial test). No other effects were significant, and performance was unaffected by the configural variations in the dot arrays (paired ts, n.s.). A repeated-measures ANOVA compared the performance of children in Experiments 3 and 4, with Position of the Larger number (left, right) as a within-subjects factor and Control variable (total area, total contour length) as a between-subjects variable. The main effect of position of the larger number was significant, F(1,43)=23.6, p<.0001, with no other significant effects (Fs<1).
Figure 5.

Mean values (±s.e.) of bisection performance (mm) for non-symbolic displays in 5-year-old children, with different numbers equated in total contour length (top), and distance between the flanker and the line’s endpoints (down).
The findings of Experiment 5 therefore replicate and extend those of Experiment 4, showing that five-year-old children’ bias towards the larger non-symbolic number is not caused by differences in the total contour length presented at the ends of the line, but to differences in number.
Experiment 6
Experiment 6 replicates Experiments 4 and 5 with displays that control for the size of the gap between the flanker and the line.
Method
The method was the same as in Experiment 4, except as follows. Participants were 25 five-year-old children (8 male; mean age: 4 years, 9 months, range: 4 years to 6 years, 3 months). A black circle (30 mm diameter) enclosed each array of dots, which were colored in white and presented 2 mm from the lines’ endpoints (Figure 5). Two children were excluded from the analyses because the overall mean bias was more than 2 SD above the group mean (inclusion of these participants does not change the results). There were four uncodable trials in the remaining data.
Results and discussion
Children bisected the lines towards the larger non-symbolic number, F(1,22)=14.69, p<.001 (Figure 5). No other effects were significant, and performance was unaffected by the configural variations in the dot arrays (paired ts, n.s.). A Wilcoxon signed-rank test confirmed this result (Z(23)=3.07, p<.01; 17/23 subjects showed a larger number effect, p=.03, binomial test). Finally, a repeated-measures ANOVA compared performance in Experiments 4, 5, and 6 with Position of the Larger number (left, right) as a within-subjects factor and Control variable (total area, total contour length, equal gap) as a between-subjects variable. Only the main effect of position of the larger number was significant, F(1,65)=38.22, p<.0001, (all other Fs<1).
Experiment 6 provides evidence that the systematic spatial biases found in five-year-old children with non-symbolic number cannot be accounted for by a perceptual effect derived by dissimilarities in gap length between the line and the flankers across different arrays.
General Discussion
The present experiments testify to the close relationship between spatial and numerical representations, not only for adults presented with symbolic numbers (de Hevia et al., 2006; Fischer, 2001), but also for children and adults presented with non-symbolic numerical information. Adults’ converging performance with symbolic and nonsymbolic numbers provides further evidence for an underlying representation of numerical quantity that is common to symbolic and non-symbolic number, in accord with a growing body of evidence from behavioral and brain imaging experiments (e.g., Libertus, Woldorff, & Brannon, 2007; Naccache & Dehaene, 2001; Piazza, Izard, Pinel, Le Bihan, & Dehaene, 2004; Piazza, Pinel, Le Bihan, & Dehaene, 2007). Moreover, adults’ performance provides evidence that numerical information is extracted automatically from visual arrays of dots, even in a task context in which number is irrelevant. This finding also accords with the findings of recent experiments using passive viewing, incidental tasks, or subliminal presentation of numbers (Cantlon, Brannon, Carter, & Pelphrey, 2006; Naccache & Dehaene, 2001; Piazza et al., 2004; Piazza et al., 2007).
More importantly, the present research reveals that nonsymbolic spatial and numerical information interact in children as well as adults, and show little change in the strength of the interaction after 5 years of age. This finding attests to a non-directional mapping of number and space that is independent of formal instruction in mathematics. Moreover, this mapping takes place spontaneously, with the simultaneous processing of spatial extent and numerical magnitude in a task for which number was irrelevant. By minimizing task demands with the bisection paradigm, and by presenting numbers non-symbolically and incidentally, this study provides evidence that the mental number line representation found in adults emerges early in development.
Although 7-year-old children can recognize single digit Arabic numbers, they showed the signature of a spatial-numerical interaction only when number was presented nonsymbolically. These findings suggest that such children do not access magnitude information from Arabic symbols rapidly or effectively enough to modulate their spatial processing (Girelli et al., 2000), in accord with previous findings (Berch et al., 1999; van Galen & Reitsma, in press). An additional finding, at age 7, was a general left-sided spatial bias, which was minimized when the larger nonsymbolic quantity was flanking the right side of the line. This general left-sided bias may reflect the onset of a preferred left-to-right scanning habit as children learn to read and write (Chokron & De Agostini, 1995; Fagard & Dahmen, 2003).
The most important findings come from the study of children who have not yet begun formal mathematics instruction. Presented with nonsymbolic representations, 5-year-old children showed the same pattern of spatial/numerical interaction as older children and adults. Moreover, different manipulations of the dot array configurations yielded the same signature bias, suggesting a spontaneous and automatic representation of number despite controls for the continuous variables with which number usually correlates. These findings suggest that young children have robust representations of number, consistent with findings from studies of infants (Brannon, Abbott, & Lutz, 2004) and non-human animals (Cantlon & Brannon, 2007). At this young age, children have been shown to have and make use of intuitions about the directional, left-to-right, mapping of number onto space (Opfer & Thompson, 2006). Critically, this is the first demonstration of a spontaneous, non-directional mapping between number and space, by which visuo-spatial representations are affected by numerical information, and it may testify to a common system of magnitude devoted to the computation of these dimensions (Walsh, 2003).
The evidence presented in this study nevertheless leaves open the question whether numerical and spatial magnitude computations share a unique, privileged link, or link more broadly to other magnitude representations. It is possible, for example, that line bisection will be influenced not only by variations in the number of elements flanking the line but also by variations in other properties of flankers such as their level of brightness. The present studies also fail to elucidate the initial source of the mapping between space and number. This mapping may result from early, preschool experiences in which larger quantities of discrete elements tend to occupy larger spaces (Cooper, 1984). Alternatively, the connection between space and number may be independent of experience. Studies of infants are needed to elucidate the origins of quantitative intuitions and their interactions.
Acknowledgments
We are grateful to Katherine Burmaster, Margaret Arnold, and Alexandra Epstein for their assistance with data collection. Supported by a grant from NSF to ESS and by a MEC-Fulbright Postdoctoral fellowship from the Spanish Ministry of Education to MDdH.
Footnotes
Publisher's Disclaimer: This is a PDF file of an unedited manuscript that has been accepted for publication. As a service to our customers we are providing this early version of the manuscript. The manuscript will undergo copyediting, typesetting, and review of the resulting proof before it is published in its final citable form. Please note that during the production process errors may be discovered which could affect the content, and all legal disclaimers that apply to the journal pertain.
References
- Bachot J, Gevers W, Fias W, Roeyers H. Number sense in children with visuospatial disabilities: Orientation of the mental number line. Psychology Science. 2005;47:172–183. [Google Scholar]
- Bächtold D, Baumüller M, Brugger P. Stimulus-response compatibility in representational space. Neuropsychologia. 1998;36:731–735. doi: 10.1016/s0028-3932(98)00002-5. [DOI] [PubMed] [Google Scholar]
- Berch DB, Foley EJ, Hill RJ, Ryan PM. Extracting parity and magnitude from arabic numerals: Developmental changes in number processing and mental representation. Journal of Experimental Child Psychology. 1999;74:286–308. doi: 10.1006/jecp.1999.2518. [DOI] [PubMed] [Google Scholar]
- Brannon EM, Abbott S, Lutz D. Number bias for the discrimination of large visual sets in infancy? Cognition. 2004;93:B59–B68. doi: 10.1016/j.cognition.2004.01.004. [DOI] [PubMed] [Google Scholar]
- Cantlon JF, Brannon EM. Basic math in monkeys and college students. PLoS Biology. 2007;5:e328. doi: 10.1371/journal.pbio.0050328. [DOI] [PMC free article] [PubMed] [Google Scholar]
- Cantlon J, Brannon EM, Carter EJ, Pelphrey K. Notation-independent number processing in the intraparietal sulcus in adults and young children. PLoS Biology. 2006;4:1–11. doi: 10.1371/journal.pbio.0040125. [DOI] [PMC free article] [PubMed] [Google Scholar]
- Chokron S, De Agostini M. Reading habits and line bisection: A developmental approach. Cognitive Brain Research. 1995;3:51–58. doi: 10.1016/0926-6410(95)00018-6. [DOI] [PubMed] [Google Scholar]
- Clearfield MW, Mix KS. Number vs. Contour length in infants’ discrimination of small visual sets. Psychological Science. 1999;10:408–411. [Google Scholar]
- Cooper RG. Early number development: Discovering number space with addition and subtraction. In: Sophian C, editor. Origins of cognitive skills. Hillsdale, NJ: Erlbaum; 1984. pp. 157–192. [Google Scholar]
- de Hevia MD, Girelli L, Vallar G. Numbers and space: A cognitive illusion? Experimental Brain Research. 2006;168:254–264. doi: 10.1007/s00221-005-0084-0. [DOI] [PubMed] [Google Scholar]
- de Hevia MD, Girelli L, Bricolo E, Vallar G. The representational space of numerical magnitude: Illusions of length. Quarterly Journal of Experimental Psychology. 2008;61:1496–1514. doi: 10.1080/17470210701560674. [DOI] [PubMed] [Google Scholar]
- Dehaene S. Varieties of numerical abilities. Cognition. 1992;44:1–42. doi: 10.1016/0010-0277(92)90049-n. [DOI] [PubMed] [Google Scholar]
- Dehaene S, editor. The number sense: how the mind creates mathematics. New York: Oxford University Press; 1997. [Google Scholar]
- Dehaene S, Bossini S, Giraux P. The mental representation of parity and number magnitude. Journal of Experimental Psychology: General. 1993;122:371–396. [Google Scholar]
- Dehaene S, Izard V, Spelke ES, Pica P. Log or linear? Distinct intuitions of the number scale in Western and Amazonian cultures. Science. 2008;320:1217–1220. doi: 10.1126/science.1156540. [DOI] [PMC free article] [PubMed] [Google Scholar]
- Descartes R. In: Discourse on the method, optics, geometry, and meteorology. Olscamp PJ, translator. Cambridge: Hacket Publishing Company; 16372001. [Google Scholar]
- Fagard J, Dahmen R. The effects of reading-writing direction on the asymmetry of space perception and directional tendencies: A comparison between French and Tunisian children. Laterality. 2003;8:39–52. doi: 10.1080/713754473. [DOI] [PubMed] [Google Scholar]
- Fias W. Two routes for the processing of verbal numbers: Evidence from the SNARC effect. Psychological Research. 2001;65:250–259. doi: 10.1007/s004260100065. [DOI] [PubMed] [Google Scholar]
- Fias W, Brysbaert M, Geypens F, d’Ydewalle G. The importance of magnitude information in numerical processing: Evidence from the SNARC effect. Mathematical Cognition. 1996;2:95–110. [Google Scholar]
- Fischer MH. Less attention and more perception. Brain and Cognition. 1994;25:24–33. doi: 10.1006/brcg.1994.1020. [DOI] [PubMed] [Google Scholar]
- Fischer MH. Number processing induces spatial performance biases. Neurology. 2001;57:822–826. doi: 10.1212/wnl.57.5.822. [DOI] [PubMed] [Google Scholar]
- Fischer MH. Spatial representations in number processing: Evidence from a pointing task. Visual cognition. 2003;10:493–508. [Google Scholar]
- Fischer MH, Castel AD, Dodd MD, Pratt J. Perceiving numbers causes spatial shifts of attention. Nature Neuroscience. 2003;6:555–556. doi: 10.1038/nn1066. [DOI] [PubMed] [Google Scholar]
- Gallistel CR, Gelman R. Non-verbal numerical cognition: From reals to integers. Trends in Cognitive Sciences. 2000;4:59–65. doi: 10.1016/s1364-6613(99)01424-2. [DOI] [PubMed] [Google Scholar]
- Gevers W, Reynvoet B, Fias W. The mental representation of ordinal sequences is spatially organized. Cognition. 2003;87:B87–B95. doi: 10.1016/s0010-0277(02)00234-2. [DOI] [PubMed] [Google Scholar]
- Gevers W, Reynvoet B, Fias W. The mental representation of ordinal sequences is spatially organized: Evidence from days of the week. Cortex. 2004;40:171–172. doi: 10.1016/s0010-9452(08)70938-9. [DOI] [PubMed] [Google Scholar]
- Girelli L, Lucangeli D, Butterworth B. The development of automaticity in accessing number magnitude. Journal of Experimental Child Psychology. 2000;76:104–122. doi: 10.1006/jecp.2000.2564. [DOI] [PubMed] [Google Scholar]
- Heath LT. The Thirteen Books of Euclid’s Elements. 2. New York: Dover Publications; 1956. [Google Scholar]
- Ito Y, Hatta T. Spatial structure of quantitative representation of numbers: Evidence from the SNARC effect. Memory and Cognition. 2004;32:662–673. doi: 10.3758/bf03195857. [DOI] [PubMed] [Google Scholar]
- Jewell G, McCourt ME. Pseudoneglect: A review and meta-analysis of performance factors in line bisection tasks. Neuropsychologia. 2000;38:93–110. doi: 10.1016/s0028-3932(99)00045-7. [DOI] [PubMed] [Google Scholar]
- Libertus ME, Woldorff MG, Brannon EM. Electrophysiological evidence for notation independence in numerical processing. Behavioral and Brain Functions. 2007;3:1. doi: 10.1186/1744-9081-3-1. [DOI] [PMC free article] [PubMed] [Google Scholar]
- Loftus GR, Masson MEJ. Using confidence intervals in within-subjects designs. Psychonomic Bulletin & Review. 1994;1:476–490. doi: 10.3758/BF03210951. [DOI] [PubMed] [Google Scholar]
- Moyer RS, Landauer TK. The time required for judgments of numerical inequality. Nature. 1967;215:1519–1520. doi: 10.1038/2151519a0. [DOI] [PubMed] [Google Scholar]
- Naccache L, Dehaene S. Unconscious semantic priming extends to novel unseen stimuli. Cognition. 2001;80:215–229. doi: 10.1016/s0010-0277(00)00139-6. [DOI] [PubMed] [Google Scholar]
- Opfer JE, Thompson CA, Sun R, Miyake N. Even early representations of numerical magnitude are spatially organized: Evidence for a directional mapping bias in pre-reading preschoolers. Proceedings of the 28th annual conference of the Cognitive Science Society; Vancouver, British Columbia: Cognitive Science Society; 2006. pp. 639–644. [Google Scholar]
- Piazza M, Izard V, Pinel P, Le Bihan D, Dehaene S. Tuning curves for approximate numerosity in the human intraparietal sulcus. Neuron. 2004;44:547–555. doi: 10.1016/j.neuron.2004.10.014. [DOI] [PubMed] [Google Scholar]
- Piazza M, Pinel P, Le Bihan D, Dehaene S. A magnitude code common to numerosities and number symbols in human intraparietal cortex. Neuron. 2007;53:293–305. doi: 10.1016/j.neuron.2006.11.022. [DOI] [PubMed] [Google Scholar]
- Posner MI, Snyder CRR, Davidson BJ. Attention and the detection of signals. Journal of Experimental Psychology: General. 1980;109:160–174. [PubMed] [Google Scholar]
- Rossetti Y, Jacquin-Courtois S, Rode G, Ota H, Michel C, Boisson D. Does action make the link between number and space representation? Psychological Science. 2004;15:426–430. doi: 10.1111/j.0956-7976.2004.00696.x. [DOI] [PubMed] [Google Scholar]
- Siegler RS, Opfer JE. The development of numerical estimation: Evidence for multiple representations of numerical quantity. Psychological Science. 2003;14:237–243. doi: 10.1111/1467-9280.02438. [DOI] [PubMed] [Google Scholar]
- van Galen MS, Reitsma P. Developing access to number magnitude: A study of the SNARC effect in 7- to 9-year-olds. Journal of Experimental Child Psychology. 2008 doi: 10.1016/j.jecp.2008.05.001. (in press) [DOI] [PubMed] [Google Scholar]
- Vuilleumier P, Ortigue S, Brugger P. The number space and neglect. Cortex. 2004;40:399–410. doi: 10.1016/s0010-9452(08)70134-5. [DOI] [PubMed] [Google Scholar]
- Walsh VA. A theory of magnitude: Common cortical metrics of time, space and quantity. Trends in Cognitive Sciences. 2003;7:483–488. doi: 10.1016/j.tics.2003.09.002. [DOI] [PubMed] [Google Scholar]
- Zebian S. Linkages between number concepts, spatial thinking, and directionality of writing: The SNARC effect and the reverse SNARC effect in English and Arabic monoliterates, biliterates, and illiterate Arabic speakers. Journal of Cognition and Culture. 2005;5:165–190. [Google Scholar]
- Zorzi M, Priftis K, Umiltà C. Brain damage: Neglect disrupts the mental number line. Nature. 2002;417:138–139. doi: 10.1038/417138a. [DOI] [PubMed] [Google Scholar]