Abstract
The development of a cellular isolation system (CIS) that enables the monitoring of single-cell oxygen consumption rates in real time is presented. The CIS was developed through a multidisciplinary effort within the Microscale Life Sciences Center (MLSC) at the University of Washington. The system comprises arrays of microwells containing Pt-porphyrin-embedded polystyrene microspheres as the reporter chemistry, a lid actuator system and a gated intensified imaging camera, all mounted on a temperature-stabilized confocal microscope platform. Oxygen consumption determination experiments were performed on RAW264.7 mouse macrophage cells as proof of principle. Repeatable and consistent measurements indicate that the oxygen measurements did not adversely affect the physiological state of the cells measured. The observation of physiological rates in real time allows studies of cell-to-cell heterogeneity in oxygen consumption rate to be performed. Such studies have implications in understanding the role of mitochondrial function in the progression of inflammatory-based diseases, and in diagnosing and treating such diseases.
Keywords: single-cell analysis, respiration rate, mouse macrophage
1. Introduction
Single-cell analysis has become an important tool in understanding fundamental cellular processes, due to the inherent heterogeneity of cellular populations (Kelly & Rahn 1932; Verstovsek et al. 1994; Kamme et al. 2003; Lidstrom & Meldrum 2003; Strovas et al. 2007). Averaged populations can obscure the existence of multiple physiological types that lead to variances in responses at the individual cell level (Balaban et al. 2004; Strovas et al. 2007). This in turn can result in incorrect data interpretation of major consequence, for instance involving the mechanism of action of a specific drug, the pathway whereby response occurs or the kinetics of response. The analysis of response at the single-cell level requires a system for making physiological measurements in living cells.
A parameter of significance for single-cell measurements is oxygen consumption rate. Oxygen consumption rate is a sensitive indicator of both steady-state physiological state and response to stimuli. In addition, changes in mitochondrial function are a hallmark of many inflammatory diseases such as cancer, stroke and heart disease (Fink & Cookson 2005). Therefore, the ability to measure oxygen consumption rate in single cells is an important technological step required for understanding the role of cellular heterogeneity in these diseases and in developing effective therapeutic interventions.
Multiple methods are known for monitoring oxygen concentrations in solution with the use of electrochemical methodologies being among the most common (Land et al. 1999; Lu & Gratzl 1999; Porterfield & Smith 2000; von Heimburg et al. 2005; Bugger et al. 2006; Gao et al. 2006). Clark oxygen electrodes are commonly used for cell culture monitoring (von Heimburg et al. 2005; Bugger et al. 2006) but are susceptible to drift due to fouling of the electrode and membrane interfaces, sensitivity to interfacial flow, consumption of oxygen during analysis and the difficulty in size reduction for single-cell measurements (Ramamoorthi & Lidstrom 1995; Reece et al. 2003; Strovas et al. 2006). Attempts to reduce the electrode size have met with some success (Lu & Gratzl 1999; Porterfield & Smith 2000; Yasukawa et al. 2000; Carano et al. 2003), but none have demonstrated a Clark-type electrode for diffusionally isolated single-cell analysis.
Recently, oxygen-sensitive porphyrin compounds have gained popularity as tools to monitor oxygen concentrations within fluids (Hartmann & Trettnak 1996; Lahdesmaki et al. 1999; Amao et al. 2000; Vinogradov et al. 2001; Armaroli 2003; Shonat & Kight 2003; Dy & Kasai 2005; Molter 2006; Molter et al. 2008). Pt-porphyrin-embedded polystyrene microspheres are commercially available and are attractive as oxygen sensors since they are biologically compatible (Strovas et al. 2006), have a good dynamic range and are easy to manipulate. As a proof of principle, a system was developed previously which demonstrated the feasibility of using these commercial microspheres as oxygen sensors for single-cell oxygen consumption rates (Molter et al. 2008).
In this study, we describe a robust cellular isolation system (CIS) that allows for the monitoring of oxygen consumption rates of many cells at once at the single-cell level. This system was demonstrated to allow reproducibility and repeatability in the measurement of single-cell oxygen consumption rates. These factors enable cell-to-cell heterogeneity to be directly addressed such that individual cells experience minimal perturbation during experimentation.
2. Material and methods
2.1 Microwell array
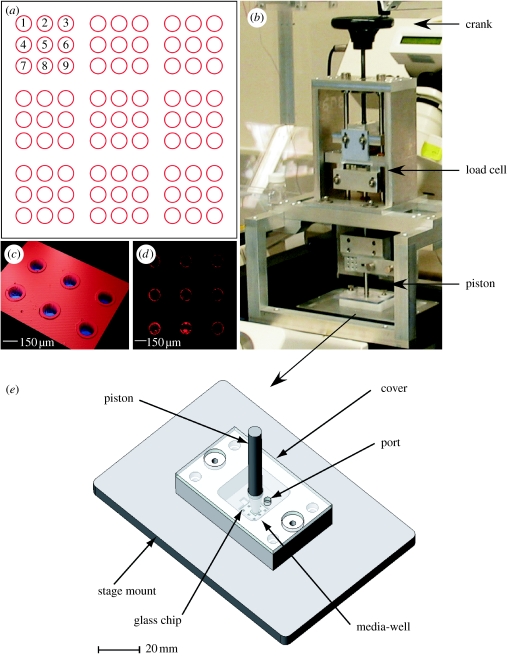
Standard photolithography techniques were used to etch 150 μm wide by 50 μm deep microwells into 1×1 cm borosilicate chips (figure 1). Steps were taken to produce microwells with a 30 μm wide by 3 μm high lip into a 3×3 array format (Molter et al. 2008). The lip surrounding each well provided a gasket-like ridge for optimal well sealing. Nine sets of 3×3 arrays were etched in 1×1 cm chips with the arrays spaced 2 mm apart from each other. Platinum luminescent fluorospheres (1 μm in diameter, λex=390 nm, λem=690 nm, F-20888, Invitrogen, Carlsbad, CA, USA) were deposited into the microwells and used to monitor the oxygen concentration within each microwell (Molter et al. 2008). As described previously, this approach resulted in a sensor ring forming at the bottom of each well (Molter et al. 2008).
Figure 1.
Images depicting (a) the layout of the microwell arrays etched into one borosilicate chip, (b) the actuator system, (c) an optical profilometer image showing the etched microwells with the lips clearly visible, (d) a laser scanning microscope (LSM) image of a microwell array showing the microsphere ring under excitation and (e) the living cell array (LCA). The LCA uses an aluminium plate to provide the support for a rigid quartz window. The quartz window was selected to provide adequate support to prevent the borosilicate chips from cracking under the load. (b) The actuator system acts as a manual linear actuator for the pistons. This system is advantageous since it removes instabilities and provides coaxial alignment of the piston to the borosilicate chip.
2.2 Living cell array
A large macrowell capable of holding approximately 8 ml of solution was made by combining a milled pocket in 1.25 cm thick polyacetal (Delrin, DuPont), which formed the side walls, and a 0.3 cm thick quartz window, which formed the base. The result is a 2.5×2.5×1.25 cm macrowell. A thin polydimethylsiloxane (PDMS) gasket was placed between the two components in order to form a leak-proof seal. The quartz window was supported by a 0.6 cm aluminium plate, with a central portion removed for optical access. Four screws were used to secure the macrowell to the aluminium plate. The aluminium plate had exterior dimensions that allow for easy mounting onto the microscope stage. A 0.3 cm piece of polycarbonate was used to cap the macrowell during experiments to reduce the evaporation of cell medium in the macrowell and retain a 20% O2/5% CO2/N2 humidified atmosphere. This can be removed to make additions or to wash the cells with fresh medium, either of which can be accomplished using a standard pipettor.
2.3 Actuator system
An actuator system (AS) was developed in order to diffusionally isolate the microwells within the LCA (figure 1). The AS consisted of a piston mounted to a manual actuator. For the piston, 0.6 cm stainless-steel rods were tapered to approximately 3 mm in diameter at one end. A thin piece of PDMS, also approximately 3 mm in diameter and 0.4 mm deep, was then attached to the piston using a cyanoacrylate adhesive. A 3 mm×3 mm×500 μm piece of borosilicate glass was then attached to the PDMS. The PDMS was used as a compliant layer to help ensure that the borosilicate glass and the microwell chip were coplanar during the sealing process. This system replaced the gold foil seal described previously (Molter et al. 2008). Before experimental use, the borosilicate glass lid of the piston assembly was rinsed with 70% EtOH in H2O and then with deionized water to remove any particulates or dust that may have settled onto the lid. Cleaning the lid helped to ensure an adequate seal and that no contamination of the cells occurred.
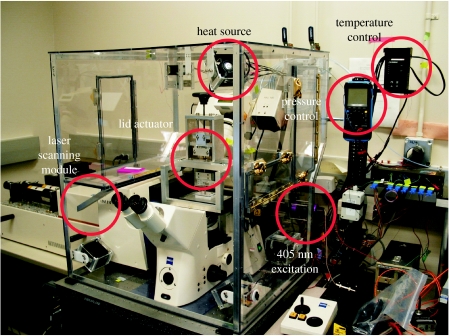
The AS was developed in such a way that the tapered end of the piston would constantly remain coaxial to the microscope objective, ensuring that the field of view for the user was also the same area to be sealed. The vertical movement of the piston was controlled using a precision linear stage, a lead screw and a hand crank, keeping the necessary components coaxial. A load cell (Cooper Instruments and Systems, Warrenton, VA, USA; LPM 510 25 lb and DCM 490) was placed within the AS to allow for real-time measurements of the force being applied. The load cell was connected to an input–output box (I/O Tech, Cleveland, OH, USA; DaqTemp 14A), which was interfaced through a computer via I/O Tech DaqView software. The force that was applied was also recorded. As can be seen in figure 2, the AS was secured to the microscope platform, which allowed for up to 6.8 kg of force with this system to be used when diffusionally isolating the microwells.
Figure 2.
The current oxygen consumption monitoring system includes the LSM system, the actuator system (AS), the LCA and an environmental control system. The environmental control system includes three heater–fan modules to heat and circulate the air around the LCA through proportional–integral–derivative (PID) control and up to 12 thermocouples for temperature monitoring. The enclosure was designed to allow for easy access to all areas and provides shelf space for storing large media and reagent bottles. The red circles identify the item noted in the corresponding label.
2.4 Temperature control
All oxygen consumption experiments were performed at 37°C on a Zeiss 510 META Laser Scanning Microscope (LSM; Zeiss, Thornwood, NY, USA). The temperature was maintained by using an in-house developed heating unit. A polycarbonate box was made to surround the microscope on all sides, with carefully located access ports that could be opened and closed to allow full access to the microscope and all other components located within the enclosed system (figure 2). The heat was provided by three heater elements (Omega Engineering, Stamford, CT, USA; Omegalux CIR-1040/120V), with each individual element coupled to a standard computer fan. The fan–heater modules were strategically placed inside the enclosure to allow for optimal heating and heat distribution. The modules were attached to the enclosure by a PDMS union, which greatly reduced the vibrations from the fans and increased the clarity of the images acquired by the LSM.
The heaters were controlled by an Omega temperature controller (Omega Engineering; CN8241-DC1). The temperature controller is set to a target temperature of 37°C. A thermocouple connected to the controller closes a feedback loop using a standard proportional–integral–derivative (PID) controller (figure 2). The temperature stability of the environmental chamber was monitored using up to 12 thermocouples. After temperature equilibration was reached (approx. 30 min), the monitored temperature had a standard deviation of 0.11°C over a period of 12 hours.
2.5 Cell line and growth conditions
The macrophage-like cell line RAW 267.4 was acquired from the American Type Culture Collection. Cells were cultured at 37°C under 5% CO2 in Dulbecco's minimal essential medium (DMEM: Gibco BRL, Carlsbad, CA, USA) supplemented with 10% FBS, 5 mM HEPES, 0.2 mg ml−1 l-glutamine, 0.05 mM β-mercaptoethanol, 50 mg ml−1 gentamicin sulphate and 10 000 U ml−1 penicillin and streptomycin (Fink & Cookson 2006).
2.6 Dyes and cell seeding
Cell deposition by random seeding was used to deposit approximately one cell per microwell. Borosilicate chips were placed into 24-well tissue culture grade polystyrene plates (353047, BD Biosciences, San Jose, CA, USA). Approximately 1×10⁴ cells in a 1 ml aliquot of culture medium were seeded into the wells, and the plates were incubated overnight at 37°C. Calcein AM (λex=494 nm, λem=517 nm, C1430, Invitrogen) and SYTOX orange (λex=547 nm, λem=570 nm, S11368, Invitrogen) were selected as the live and dead cell stains, respectively. Calcein AM was excited with a 488 nm argon laser and detected in channel 2 of the LSM. SYTOX orange was excited via a 543 nm helium–neon laser and detected in channel 3 of the LSM.
2.7 Data acquisition
Detailed descriptions of the data acquisition and sensor calibration have been previously reported (Molter et al. 2008). The excitation and emission maxima for the Pt-porphyrin are approximately 390 and 650 nm, respectively. In order to determine the oxygen concentration within a microwell, a phase modulation technique was established (Molter et al. 2008). A gated 405 nm diode laser (PPMT LD1539, Power Technology, Inc., Alexander, AR, USA) coupled to the rear port of the microscope was used to excite the oxygen sensor. An ICCD camera (Andor iStar DH734-18F, Andor Technology, South Windsor, CT, USA) connected to the base port of the microscope was used to collect the emission signal. A 585 nm long-pass filter was used to remove any reflected excitation signal from the data collection. The appropriate timing for both the laser and camera was achieved by connecting each element by a coaxial connector to a pulse–delay generator (BNC 555, Berkeley Nucleonics Corporation, San Rafael, CA, USA). An arbitrary function generator (AFG310, Tektronix, Inc., Irvine, CA, USA) was used to trigger the delay generator, ensuring the correct timing for signal generation and data collection. Standard blood gas calibration cylinders of 0, 10 and 20% O2, with 5% CO2 and N2 balance, were used to calibrate the oxygen sensor.
2.8 Oxygen consumption experiments
The heating unit, laser, LSM and ICCD camera were initiated and the desired piston was secured into the AS and allowed to equilibrate to 37°C. During the system equilibration, 4 ml of cell culture medium was injected into the macrowell chamber and was placed within the microscope enclosure. After equilibration was achieved, a previously seeded chip was placed into the LCA and Calcein AM and SYTOX orange were added. The LCA was covered and a humidified 20% O2/5% CO2/N2-balance gas line was inserted into the LCA, gently bathing the media. The entire system was allowed to equilibrate for at least 30 min before any measurements were taken. The ICCD camera was set to a 10×10 pixel bin size for all oxygen consumption experiments.
After the equilibration, a 3×3 section of microwells was chosen for observation by manually centring the array within the field of view of a 10× objective using a mechanical x–y stage. The piston lid was lowered until a steady 6.8 kg force was reported by the load cell. The seal was optically verified (see below), the microwell array of interest was imaged with the LSM, the previously developed Andor basic software (Molter et al. 2008) was then initiated and the oxygen concentration monitoring began. After the oxygen consumption experiment was completed, a final LSM image was acquired to verify the location of cells within the microwells as well as to quantify the number of live cells that contributed to the oxygen consumption. After the LSM image was acquired, the piston assembly was raised until the microwells were completely unsealed yet with the borosilicate seal kept in solution to avoid drying and subsequent crystallization of medium on the sealing surface. Once the piston was raised, the next region of interest was selected and the oxygen consumption measurement process was repeated. The oxygen consumption measurements on both 3×3 microwell arrays were repeated four times.
2.9 Seal confirmation
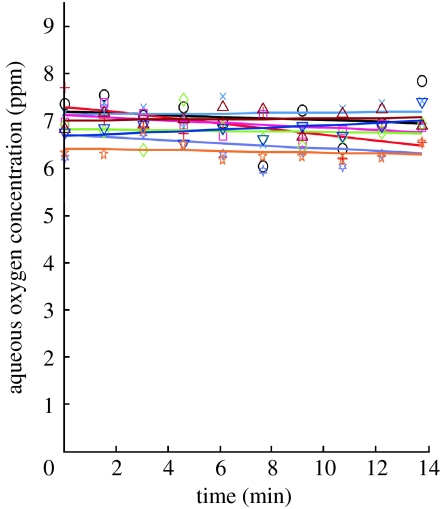
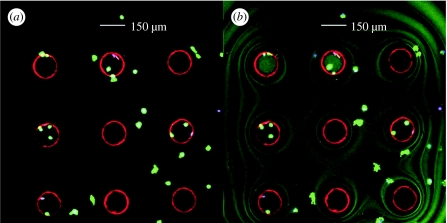
In order for the oxygen consumption data to be verified, it was imperative to prove that the AS does indeed diffusionally isolate each microwell within the LCA. Microwell leak tests were carried out both visually and experimentally. During experimental seal verification, microwells submerged in water containing 20% ambient oxygen were sealed with the AS (figure 3). The water outside of the sealed wells was then equilibrated to 0% oxygen and the oxygen concentration inside the sealed wells was monitored over time to observe any change in the sealed microwells from the original 20% oxygen level. The oxygen concentration was monitored for the same duration as a full oxygen consumption experiment, approximately 15 min. During visual seal verification, the glass–glass interface between the microwell lips and the AS lid was imaged using an argon laser (488 nm) on the LSM (figure 4). Concentric line patterns were observed around the microwells when the system was sealed. The lines are created by constructive and destructive interference of laser light reflecting off the chip and lid surface boundaries, similar to what is observed for Newton's rings (Cloud 2003). A highly symmetrical pattern was observed when uniform sealing of the microwells was achieved, with poor sealing indicated by an asymmetrical pattern.
Figure 3.
Measurement of oxygen concentration in wells that were first sealed under ambient oxygen conditions and then subjected to a low (0%)-oxygen environment, demonstrating sealing. Circle, well 1; plus, well 2; six-tailed star, well 3; cross, well 4; square, well 5; diamond, well 6; up triangle, well 7; down triangle, well 8; five-tailed star, well 9.
Figure 4.
(a) An LSM image of unsealed microwells showing the presence of the deposited Pt-porphyrin microspheres and healthy mouse macrophage stained with Calcein AM live stain in green. (b) An LSM image of sealed microwells showing the deposited sensors and the seeded macrophages. The symmetric wavy lines are indicative of an adequately sealed system.
3. Results and discussion
3.1 System characterization
In order to improve system performance and validate the system and the oxygen sensor, a systematic analysis of several variables was performed on the Andor iStar ICCD, the excitation source and the microscope. The parameters analysed for the ICCD include the effects of the thermoelectric cooler, the pixel bin size, the system gain, inherent delays within the Andor system, the number of accumulations at each step within a kinetic series and the operating frequency of the system. The location of the microwells within the field of excitation and the focus plane of the microscope were also examined. The stability of the 405 nm diode laser used as the excitation source was also investigated. Finally, the long-term stability of the oxygen concentration determination was studied. Sixty successive measurements of the same sensors had an average coefficient of variance of 3.2%, and for similar measurements carried out on different days it was 3.3%. The results of all of these analyses allowed for dramatic improvement of the experimental parameters required for phosphorescence monitoring and led to the development of the final method, which is detailed in §2.
3.2 System calibration
As described in §2.7, standard blood gas calibration cylinders of 0, 10 and 20% O2, with 5% CO2 and N2 balance, were used to calibrate the system. As reported previously, an excellent correlation was observed using a modified Stern–Volmer equation that accounts for multiple fluorescing regions within the oxygen-sensitive microspheres (Molter et al. 2008).
3.3 Seal confirmation
As described previously, microwells were visually confirmed to be sealed by observing whether concentric line patterns were created when the glass–glass interface between the microwell lips and the AS lid was imaged using an argon laser (488 nm) on the LSM (figure 4).
A dirty glass lid, uneven positioning of the PDMS conformal layer, residual gold from the photolithographic process on the well lips and excess cellular debris were observed to be the most common causes for inadequate sealing.
In addition to visual seal test confirmation, experimental seal testing was conducted by sealing water at 20% oxygen inside the microwells, equilibrating the surrounding water to 0% oxygen and observing any change in the oxygen inside the sealed microwells. As shown in figure 3, the oxygen concentration during these seal tests remained virtually constant over the 14 min duration of this experiment, with an average standard deviation of 0.40 ppm for each well measured. In cases in which the microwells were not sealed, the reported oxygen concentration quickly approached 0 ppm (data not shown).
3.4 Repeatability of oxygen consumption results
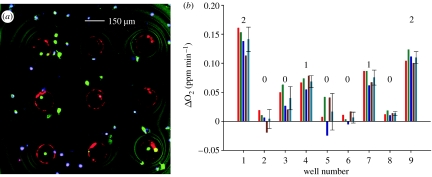
The system as described above was used to measure oxygen consumption of cells in the microwell arrays. Two array locations on one chip were measured, for a total of 18 wells, 9 with no cells, 6 with one cell and 3 with two cells. Repeatability was tested by carrying out oxygen consumption experiments with four sequential measurements of each cell. As shown in figure 5 and table 1, it was possible to measure oxygen consumption on wells with single cells. The replicate measurements showed good reproducibility, with standard deviations in most cases being within 30% of the average (table 1). In addition, no trends were consistently observed in the rates measured in the subsequent oxygen consumption measurements of the same cells, suggesting that the measurement itself does not significantly affect the oxygen consumption rate, either positively (stimulatory) or negatively (inhibitory).
Figure 5.
(a) An LSM image identifying the number of live cells present per microwell for an oxygen consumption experiment. Live cells are reported to be green, dead cells appear to be purple colour and the Pt-porphyrin rings are present in red. (b) The corresponding repetitive oxygen consumption slopes found from the isolated system are shown on the left.
Table 1.
Repetitive oxygen consumption experiments for arrays 1 and 2.
| array | microwell | no. of cells | rate 1a | rate 2a | rate 3a | rate 4a | averagea | s.d. |
|---|---|---|---|---|---|---|---|---|
| 1 | 1 | 2 | 0.161 | 0.153 | 0.138 | 0.113 | 0.141 | 0.021 |
| 2 | 0 | 0.019 | 0.010 | 0.006 | −0.019 | 0.004 | 0.016 | |
| 3 | 0 | 0.050 | 0.063 | 0.026 | 0.020 | 0.040 | 0.020 | |
| 4 | 1 | 0.067 | 0.074 | 0.055 | 0.078 | 0.068 | 0.010 | |
| 5 | 0 | 0.007 | 0.042 | −0.024 | 0.041 | 0.016 | 0.031 | |
| 6 | 0 | 0.011 | 0.003 | −0.005 | 0.017 | 0.006 | 0.009 | |
| 7 | 1 | 0.086 | 0.086 | 0.062 | 0.067 | 0.075 | 0.013 | |
| 8 | 0 | 0.012 | 0.018 | 0.010 | 0.014 | 0.014 | 0.003 | |
| 9 | 2 | 0.104 | 0.123 | 0.111 | 0.100 | 0.110 | 0.010 | |
| 2 | 1 | 1 | 0.071 | 0.070 | 0.057 | 0.059 | 0.064 | 0.007 |
| 2 | 0 | −0.003 | 0.019 | 0.055 | 0.002 | 0.018 | 0.026 | |
| 3 | 2 | 0.212 | 0.177 | 0.129 | 0.150 | 0.167 | 0.036 | |
| 4 | 1 | 0.090 | 0.072 | 0.094 | 0.046 | 0.075 | 0.022 | |
| 5 | 0 | 0.018 | 0.014 | 0.024 | 0.014 | 0.018 | 0.005 | |
| 6 | 0 | 0.003 | 0.006 | −0.017 | 0.049 | 0.010 | 0.028 | |
| 7 | 1 | 0.052 | 0.018 | 0.055 | 0.082 | 0.052 | 0.026 | |
| 8 | 0 | 0.030 | 0.025 | 0.031 | −0.017 | 0.017 | 0.023 | |
| 9 | 1 | 0.125 | 0.063 | 0.058 | 0.065 | 0.078 | 0.031 |
ppm min−1.
3.5 Oxygen consumption rate measurement correlations with cell number
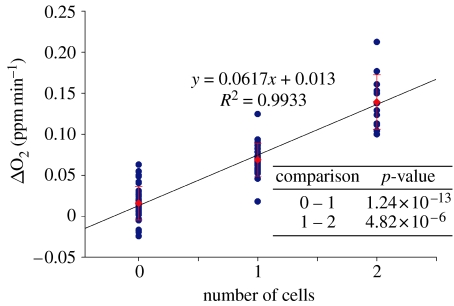
The 72 measurements shown in table 1 were plotted against the number of cells. An excellent correlation between the determined slope and the corresponding number of cells within the respective microwell (0, 1 or 2) was observed (figure 6). These results further validate the system for single-cell oxygen consumption measurements. A comparison of the results from the two array locations shows that they were similar to each other, within the standard deviation of the measurements (tables 1 and 2). This result is significant and suggests that this system can be used to compare single-cell respiration rates of a large number of single cells in multiple arrays. Although other methods are not available to test these results at the single-cell level, bulk oxygen consumption rate measurements have been previously validated with a Clark electrode (Strovas et al. 2006).
Figure 6.
The reported oxygen consumption rates plotted against the number of cells present. Circle, consumption rate; diamond, average.
Table 2.
Oxygen consumption rate comparison.
Divided by 2 to normalize to one cell.
ppm min−1.
As can be seen from figure 6, a small rate of oxygen consumption is observed in the absence of cells. This is not due to leaks, but is an inherent property of the sensor beads and has been referred to as the induction effect (Hicks et al. 1988; Sinaasappel & Ince 1996; Liu & Sullivan 2004). This induction effect can limit the usefulness of the approach, if high light intensities are used (Mitra & Foster 2000). In this test light intensities were kept to a minimum. Although the average induction rate is lower than the average of single cells, significant overlap occurs with about half of the measurements. Therefore, comparing rates of individual cells with each other requires high numbers of measurements. Further modifications, such as decreasing the volume of the well or using different formulations of the porphyrin sensor, to increase the difference between the zero-cell and single-cell measurements will increase the applicability and usability of this system for heterogeneity assessments of single-cell and bulk-cell populations.
4. Conclusions
The development and application of a system capable of monitoring the respiration rates from multiple diffusionally isolated single cells were shown. Sealing of the microwells can be quickly determined, thus little experimental time is lost due to improper seals. Using the automation of the LSM, multiple arrays of cells could be investigated in a short period of time, increasing the overall throughput of the system. The system was made even more robust by the in-house development of the LCA and AS, both of which easily allow for the insertion of new seals and new sets of seeded microwell arrays. The oxygen-sensitive characteristics of Pt-porphyrin-embedded 1 μm polystyrene microspheres were used to monitor the local oxygen concentration over time using a previously developed phase modulation technique (Molter et al. 2008). Using this technique and the CIS, multiple oxygen consumption experiments were carried out on the same set of cells with a high level of reproducibility.
The development of this single-cell observation system has allowed for non-invasive reproducible measurements of oxygen consumption rates in individual cells in real time. The ability to reproducibly measure physiological parameters such as oxygen consumption rates in single cells opens up a new line of enquiry into the relationship of pre-existing physiological state with cellular response. At the Microscale Life Sciences Center (MLSC), we are currently studying heterogeneity in inflammatory cell death pathways (Fink & Cookson 2005) and in cancer progression, in Barrett's oesophagus (Maley et al. 2006). By assessing physiological state and correlating that with the type of response obtained to a stimulus, either a death stimulus or a known risk factor, it may be possible to identify new targets for diagnostics and therapeutic agents, as well as new insights into disease pathways that are currently obscured by data obtained with bulk cultures.
Acknowledgments
The authors would like to thank Dr Shih-hui Chao for his helpful discussions. This work was supported by a grant from the Centers of Excellence in Genomic Science (CEGS), the MLSC, NIH National Human Genome Research Institute (NHGRI; P50 HG 002360).
Footnotes
One contribution of 7 to a Theme Supplement ‘Single-cell analysis’.
References
- Amao Y., Asai K., Okura I. Oxygen sensing based on lifetime of photoexcited triplet state of platinum porphyrin–polystyrene film using time-resolved spectroscopy. J. Porphyr. Phthalocya. 2000;4:292–299. doi: 10.1002/(SICI)1099-1409(200004/05)4:3%3C292::AID-JPP216%3E3.0.CO;2-W. [DOI] [Google Scholar]
- Armaroli N. From metal complexes to fullerene arrays: exploring the exciting world of supramolecular photochemistry fifteen years after its birth. Photochem. Photobiol. Sci. 2003;2:3–87. doi: 10.1039/b210569a. [DOI] [PubMed] [Google Scholar]
- Balaban N.Q., Merrin J., Chait R., Kowalik L., Leibler S. Bacterial persistence as a phenotypic switch. Science. 2004;305:1622–1625. doi: 10.1126/science.1099390. [DOI] [PubMed] [Google Scholar]
- Bugger H., Chemnitius J.-M., Doenst T. Differential changes in respiratory capacity and ischemia tolerance of isolated mitochondria from atrophied and hypertrophied hearts. Metabolism. 2006;55:1097–1106. doi: 10.1016/j.metabol.2006.04.005. [DOI] [PubMed] [Google Scholar]
- Carano M., Holt K.B., Bard A.J. Scanning electrochemical microscopy. 49. Gas-phase scanning electrochemical microscopy measurements with a Clark oxygen ultramicroelectrode. Anal. Chem. 2003;75:5071–5079. doi: 10.1021/ac034546q. [DOI] [Google Scholar]
- Cloud G. Optical methods in experimental mechanics—part 5—a classic interferometry: Newton's rings. Exp. Tech. 2003;27:17–19. doi: 10.1111/j.1747-1567.2003.tb00094.x. [DOI] [Google Scholar]
- Dy E.S., Kasai H. Characterization of platinum porphyrins and its interaction with oxygen by density functional theory. e-J. Surf. Sci. Nanotechnol. 2005;3:473–475. doi: 10.1380/ejssnt.2005.473. [DOI] [Google Scholar]
- Fink S.L., Cookson B.T. Apoptosis, pyroptosis, and necrosis: mechanistic description of dead and dying eukaryotic cells. Infect. Immun. 2005;73:1907–1916. doi: 10.1128/IAI.73.4.1907-1916.2005. [DOI] [PMC free article] [PubMed] [Google Scholar]
- Fink S.L., Cookson B.T. Caspase-1-dependent pore formation during pyroptosis leads to osmotic lysis of infected host macrophages. Cell. Microbiol. 2006;8:1812–1825. doi: 10.1111/j.1462-5822.2006.00751.x. [DOI] [PubMed] [Google Scholar]
- Gao N., Zhao M., Zhang X., Jin W. Measurement of enzyme activity in single cells by voltammetry using a microcell with a positionable dual electrode. Anal. Chem. 2006;78:231–238. doi: 10.1021/ac051178c. [DOI] [PubMed] [Google Scholar]
- Hartmann P., Trettnak W. Effects of polymer matrixes on calibration functions of luminescent oxygen sensors based on porphyrin ketone complexes. Anal. Chem. 1996;68:2615–2620. doi: 10.1021/ac960008k. [DOI] [PubMed] [Google Scholar]
- Hicks J.M., Urbach L.E., Plummer E.W., Dai H.L. Can pulsed laser excitation of surfaces be described by a thermal-model. Phys. Rev. Lett. 1988;61:2588–2591. doi: 10.1103/PhysRevLett.61.2588. [DOI] [PubMed] [Google Scholar]
- Kelly C.D., Rahn O. The growth rate of individual bacterial cells. J. Bacteriol. 1932;23:147–153. doi: 10.1128/jb.23.2.147-153.1932. [DOI] [PMC free article] [PubMed] [Google Scholar]
- Kamme F., et al. Single-cell microarray analysis in hippocampus CA1: demonstration and validation of cellular heterogeneity. J. Neurosci. 2003;23:3607–3615. doi: 10.1523/JNEUROSCI.23-09-03607.2003. [DOI] [PMC free article] [PubMed] [Google Scholar]
- Lahdesmaki I., Scampavia L.D., Beeson C., Ruzicka J. Detection of oxygen consumption of cultured adherent cells by bead injection spectroscopy. Anal. Chem. 1999;71:5248–5252. doi: 10.1021/ac990712b. [DOI] [PubMed] [Google Scholar]
- Land S.C., Porterfield D.M., Sanger R.H., Smith P.J. The self-referencing oxygen-selective microelectrode: detection of transmembrane oxygen flux from single cells. J. Exp. Biol. 1999;202(Pt 2):211–218. doi: 10.1242/jeb.202.2.211. [DOI] [PubMed] [Google Scholar]
- Lidstrom M.E., Meldrum D.R. Life-on-a-chip. Nat. Rev. Microbiol. 2003;1:158–164. doi: 10.1038/nrmicro755. [DOI] [PubMed] [Google Scholar]
- Liu T., Sullivan J.P. Springer; Berlin, Germany: 2004. Pressure and temperature sensitive paints. [Google Scholar]
- Lu H., Gratzl M. Monitoring drug efflux from sensitive and multidrug-resistant single cancer cells with microvoltammetry. Anal. Chem. 1999;71:2821–2830. doi: 10.1021/ac9811773. [DOI] [PubMed] [Google Scholar]
- Maley C.C., et al. Genetic clonal diversity predicts progression to esophageal adenocarcinoma. Nat. Genet. 2006;38:468–473. doi: 10.1038/ng1768. [DOI] [PubMed] [Google Scholar]
- Mitra S., Foster T.H. Photochemical oxygen consumption by a porphyrin phosphorescent probe in two model systems. Biophys. J. 2000;78:2597–2605. doi: 10.1016/S0006-3495(00)76804-4. [DOI] [PMC free article] [PubMed] [Google Scholar]
- Molter T.W. Automation of single cell oxygen consumption experiments. University of Washington; Seattle, WA: 2006. p. 114. [Google Scholar]
- Molter T.W., Holl M.R., Dragavon J.M., McQuaide S.C., Anderson J.B., Young A.C., Burgess L.W., Lidstrom M.E., Meldrum D.R. A new approach for measuring single cell oxygen consumption rates. IEEE Trans. Autom. Sci. Eng. 2008;5:32–42. doi: 10.1109/TASE.2007.909441. [DOI] [PMC free article] [PubMed] [Google Scholar]
- Porterfield D.M., Smith P.J.S. Single-cell, real-time measurements of extracellular oxygen and proton fluxes from Spirogyra grevilleana. Protoplasma. 2000;212:80–88. doi: 10.1007/BF01279349. [DOI] [Google Scholar]
- Ramamoorthi R., Lidstrom M.E. Transcriptional analysis of pqqD and study of the regulation of pyrroloquinoline quinone biosynthesis in Methylobacterium extorquens AM1. J. Bacteriol. 1995;177:206–211. doi: 10.1128/jb.177.1.206-211.1995. [DOI] [PMC free article] [PubMed] [Google Scholar]
- Reece J.S., Miller M.J., Arnold M.A., Waterhouse C., Delaplaine T., Cohn L., Cannon T. Continuous oxygen monitoring of mammalian cell growth on space shuttle mission STS-93 with a novel radioluminescent oxygen sensor. Appl. Biochem. Biotechnol. 2003;104:1–11. doi: 10.1385/ABAB:104:1:1. [DOI] [PubMed] [Google Scholar]
- Shonat R.D., Kight A.C. Oxygen tension imaging in the mouse retina. Ann. Biomed. Eng. 2003;31:1084–1096. doi: 10.1114/1.1603256. [DOI] [PubMed] [Google Scholar]
- Sinaasappel M., Ince C. Calibration of Pd-porphyrin phosphorescence for oxygen concentration measurements in vivo. J. Appl. Physiol. 1996;81:2297–2303. doi: 10.1152/jappl.1996.81.5.2297. [DOI] [PubMed] [Google Scholar]
- Strovas T.J., Dragavon J.M., Hankins T.J., Callis J.B., Burgess L.W., Lidstrom M.E. Measurement of respiration rates of Methylobacterium extorquens AM1 cultures by use of a phosphorescence-based sensor. Appl. Environ. Microbiol. 2006;72:1692–1695. doi: 10.1128/AEM.72.2.1692-1695.2006. [DOI] [PMC free article] [PubMed] [Google Scholar]
- Strovas T.J., Sauter L.M., Guo X.F., Lidstrom M.E. Cell-to-cell heterogeneity in growth rate and gene expression in Methylobacterium extorquens AM1. J. Bacteriol. 2007;189:7127–7133. doi: 10.1128/JB.00746-07. [DOI] [PMC free article] [PubMed] [Google Scholar]
- Verstovsek S., Zaleskis G., Maccubbin D.L., Mihich E., Ehrke M.J. Lipopolysaccharide and splenic tumoricidal macrophage activation. J. Leukoc. Biol. 1994;56:714–722. doi: 10.1002/jlb.56.6.714. [DOI] [PubMed] [Google Scholar]
- Vinogradov S.A., Fernandez-Searra M.A., Dugan B.W., Wilson D.F. Frequency domain instrument for measuring phosphorescence lifetime distributions in heterogeneous samples. Rev. Sci. Instrum. 2001;72:3396–3406. doi: 10.1063/1.1386634. [DOI] [Google Scholar]
- von Heimburg D., Hemmrich K., Zachariah S., Staiger H., Pallua N. Oxygen consumption in undifferentiated versus differentiated adipogenic mesenchymal precursor cells. Respir. Physiol. Neurobiol. 2005;146:107–116. doi: 10.1016/j.resp.2004.12.013. [DOI] [PubMed] [Google Scholar]
- Yasukawa T., Kaya T., Matsue T. Characterization and imaging of single cells with scanning electrochemical microscopy. Electroanalysis. 2000;12:653–659. doi: 10.1002/1521-4109(200005)12:9%3C653::AID-ELAN653%3E3.0.CO;2-S. [DOI] [Google Scholar]


