

Abstract
Na+/K+-ATPase contributes to the asymmetrical distribution of sodium and potassium ions across the plasma membrane and to maintenance of the membrane potential in many types of cells. Alterations in this protein may play a significant role in many human neurological disorders, including epilepsy. We studied expression of the α3 isoform of Na+/K+-ATPase in the freeze lesion (FL) microgyrus model of developmental epileptogenesis to test the hypothesis that it is down-regulated following neonatal cortical injury. FL and sham-operated rat brains were examined at P7, P10, P14, P21–28 and P50–60 after placement of a transcranial freeze lesion at P0 or P1. Immunohistochemistry and in situ hybridization were used to assess the expression of the α3 isoform of Na+/K+-ATPase (termed α3, or α3 subunit below) in neuropil and the perisomatic areas of pyramidal and parvalbumin-containing interneurons. There was a significant decrease (p<0.05) in α3 subunit immunoreactivity (IR) in the neuropil of FL cortical layer V of the P14 and P21–28 groups that extended up to 360 μm from the border of the microgyrus, an area that typically exhibits evoked epileptiform activity. Alpha-3 was decreased in the perisomatic area of pyramidal but not parvalbumin-containing cells in P21–28 FL animals. A reduction in α3 mRNA was observed in the neuropil of FL cortical layer V up to 1610 μm from the microgyral edge. The developmental time course for expression of the α3 subunit between P7-P60 was examined in naïve rat cortices and results showed that there was a significant increase in α3 IR between P7 and P10. The significant decreases in Na+/K+-ATPase in the paramicrogyral cortex may contribute to epileptogenesis.
Keywords: sodium pump, cortical malformation, pyramidal cell, parvalbumin-containing interneuron, epilepsy, injury
INTRODUCTION
Epilepsy is characterized by recurrent behavioral seizures, associated with sudden changes in electrical signaling in large groups of neurons, and cortical hyperexcitability. Developmental cortical malformations are frequently associated with epileptogenesis, and studies have shown that 70–80% of patients with polymicrogyria, the malformation modeled in the experiments reported here, have seizures (Barkovich and Kjos, 1992). Other disorders associated with polymicrogyria include dyslexia (Livingstone et al., 1991; Oliveira et al., 2008), mental retardation (Brodtkorb, 1994), cerebral palsy (Truwit et al., 1992) and schizophrenia (Beckmann, 1999). Focal hypoxia during a critical period of cortical maturation (Villani et al., 2003) and genetic abnormalities (Guerrini, 2005) may contribute to the development of this cortical malformation.
Microgyria can be produced in rodents by applying a freeze probe to the rat skull at P0 or P1 (Dvorak and Feit, 1977; Dvorak et al., 1978; Fig. 1A). The freeze lesion (FL) kills most of the neurons in place at the time of surgery (cortical layers IV, V and VIa), while neurons in layers I-III subsequently migrate into the area of necrosis. By P12, classical microgyral anatomy is seen at the site of the freeze including a microsulcus in the normally lissencephalic neocortex and a surrounding microgyrus containing infolded layers I-III of the adjacent normal cortex. The histopathology varies with the severity of the freeze lesion; an absence of cortical layers IV-VIa, and a remnant of layer VIb are seen in some cases (Fig. 1B). Epileptiform activity can be evoked in brain slices maintained in vitro from FL rats ages P12 to P118 (Jacobs et al., 1999a). However, the abnormal activity is observed in the area adjacent to the microgyrus, termed the paramicrogyral zone, and not within the microgyrus itself or in more remote cortex (Jacobs et al, 1996, 1999a, b). Evoked epileptiform activity can first be recorded at P12 up to 2.5 mm from the edge of the microgyrus, but not beyond, and the incidence of abnormal responses significantly decreases after P40 (Jacobs et al., 1999a). The FL model mimics the histological characteristics of a human four-layered microgyrus, and is appropriate for investigating mechanisms contributing to epileptiform activity in this developmental malformation.
Figure 1.
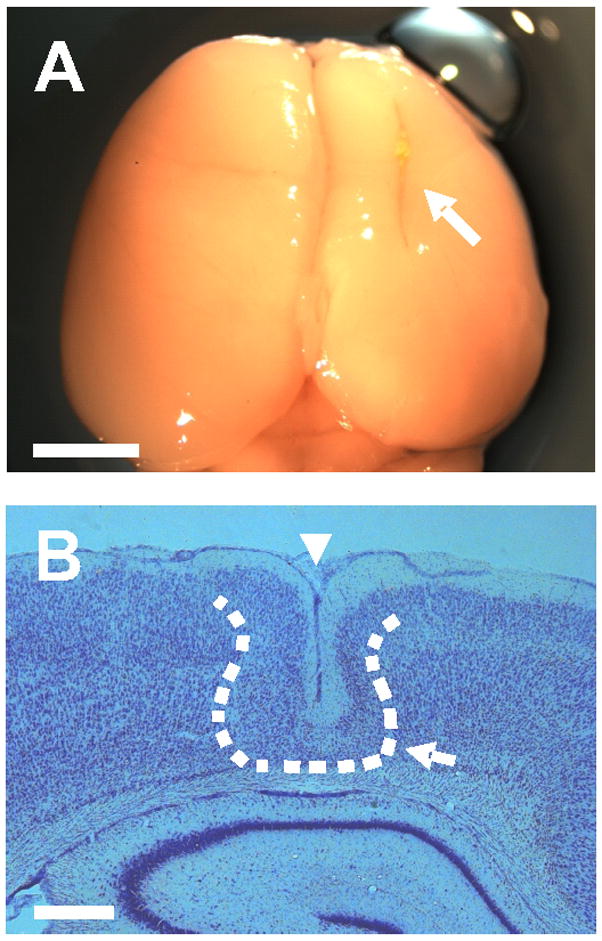
Freeze lesion microgyrus model. A: location of the lesion (white arrow) in the right cortical hemisphere of a P23 FL rat. B: Nissl stain of a coronal section through the microgyrus from the same brain (4X magnification); midline to the right. Dashed line shows the approximate edge of the microgyrus. Note the infolded cortical layers I–III comprising the microgyrus (white arrow) and the microsulcus (white arrowhead). Both images are representative of the P21–28 FL rat age group (n = 4). Scale bars are 5 mm for (A) and 500 μm for (B).
Several hypotheses have been developed to explain epileptiform activity in other models, including alterations in molecular signaling mechanisms modulated by ionotropic (Sutor and Hablitz, 1989; Rakhade et al., 2008) and metabotropic glutamate receptors (Burke and Hablitz, 1995; Bertaso et al., 2008), abnormalities in ion channels (Bernard et al., 2004; Avanzini et al., 2007), sprouting of new excitatory connections (Tauck and Nadler, 1985; Salin et al., 1995), synaptic rewiring (Esclapez et al, 1999; Avramescu and Timofeev, 2008) and decreases in GABAergic inhibition (Ribak et al, 1979; Yang and Benardo, 1997; Cossart et al., 2001). Spatial and temporal changes in protein expression may also be associated with cortical hyperexcitability. One such protein is sodium-potassium ATPase (Na+/K+-ATPase), referred to below as the “sodium pump.” This protein is a heterodimer made of α-and β-subunits that is present in all tissues including neurons and glia in the mammalian brain (Shyjan and Levenson, 1989). The sodium pump plays a crucial role in maintaining the normal resting potential of cells by actively transporting three Na+ out of, and two K+ ions into the cell per ATP molecule split. Currently, four α and three β subunits are known, but the structure and function of Na+/K+-ATPase isozymes differ among various types of CNS neurons (McGrail et al., 1991). The α3 isozyme of Na+/K+-ATPase (termed α3 subunit or α3 below) is primarily expressed in neurons, and is the focus of this paper. This subunit is the catalytic component of the pump, with binding sites for cations (Na+ and K+), ATP, and cardiac glycosides (pump inhibitors). The β-subunit does not possess catalytic activity, but is required for enzyme function. The α3/β1 combination is found in neurons; the α1/β2 combination is most common in glia (Dobretsov and Stimers, 2005).
Altered α3 subunit expression may play a vital role in the pathogenesis of seizure activity by contributing to hyperexcitability. The protein is responsible for maintaining a portion of the resting membrane potential and clearing excess intracellular sodium ([Na+]i) that follows repetitive action potentials or excitatory synaptic activity. A decrease in α3 subunit expression may cause neurons to be less effective in restoring their normal electrochemical gradient and membrane potential after repeated membrane depolarizations, resulting in hyperexcitability. Decreases in α3 in presynaptic terminals could also affect neurotransmitter release. Thus, a reduction in the α3 subunit in excitatory neurons may result in depolarization, enhanced action potential firing, and lead to increased release of glutamate (Li and Stys, 2001; Vaillend et al., 2002;).
We investigated changes in the topographic and laminar distribution of α3 Na+/K+-ATPase protein and mRNA expression in cortical layers I-V in the paramicrogyral zone of freeze lesioned rats. Previous studies demonstrated that epileptiform activity in FL rats at ages ≤P25 could be evoked in all laminae by stimuli in layer VI, in a region within 0.5 mm from the microsulcus. Laminar profiles of epileptiform activity revealed that fast (< 2 ms) sharp waves occurred in layer V, followed by slower epileptiform activity in other layers, however the laminar origin and amplitude of the abnormal activity varied in different slices. (Jacobs 1999a). Alpha-3 subunit expression was further examined at varying latencies (P7, P10, P14, P21–28 and P50–60) after the FL was placed to determine the time course of alterations in the protein in relation to the onset of epileptiform activity, known to occur at P12 in this model (Jacobs et al., 1999a). We also assessed the normal development of α3 protein expression by studying naïve animals at ages comparable to those of FL animals. Experiments focused on temporal and spatial variables reported here are attempts to demonstrate a correlation between alterations in sodium pump expression and the previously reported incidence and distribution of epileptiform activity in the FL rat model. Results show that α3 IR is significantly down-regulated in cortical layer V in an area extending up to 360 μm from the microgyral edge 14–28 days after the freeze lesion, and that there is a significant up-regulation of α3 IR between P7 and P10 in naïve neocortex.
EXPERIMENTAL PROCEDURES
All experiments were carried out using procedures in compliance with National Institute of Health Guide for the Care and Use of Laboratory Animals and protocols approved by the Stanford Animal Care and Use Committee.
Lesion placement
Freeze lesions were made in 16 albino Sprague Dawley rat pups on P0 or P1 as previously described (Dvorak and Feit, 1978; Jacobs et al., 1996). Data obtained from P0 and P1 lesioned animals were combined as there were no significant differences between groups. Rats were anesthetized via hypothermia by immersing them in a slurry of water and ice until they no longer responded to stimuli such as tail or paw pinch. They were then placed on a cooled platform in a head holder, the scalp incised, the skull exposed and a freeze probe (tip = 2 × 5 mm; cooled to −50° C with dry ice and 100% ethanol) was placed on the skull over the right hemisphere for 5 s. The probe was oriented with its long axis parallel to the sagittal suture 1 mm from the midline straddling the coronal suture (see Figs. 1A–B for images of resulting microgyral lesion). The scalp was then sutured, the pup warmed, and returned to the dam. Twelve naive rats were operated on in the same way, with application of the same “freeze” probe that was not cooled as above (sham-operated or SO controls). As there were no differences in the parameters measured in naïve and sham operated controls, data from these groups were combined as “control” or “naïve” in the data analysis and figures.
FL and SO control rats were deeply anesthetized with sodium pentobarbital (50 mg/kg, ip.) at P7 (n = 3 per group), P10 (n = 3 per group), P14 (n = 3 per group), P21–28 (n = 4 for FL; n = 3 for naive), and P50–60 (n = 3 per group), the thorax opened to expose the heart and 0.5 mL of heparin injected into the left ventricle. Animals were perfused transcardially by gravity feed with saline followed by 4% paraformaldehyde (Sigma, St. Louis, MO) in 0.1 M phosphate buffer (Sigma, St. Louis, MO), pH 7.4. Brains were removed and post-fixed in 4% phosphate buffered paraformaldehyde at 4° C overnight.
Immunohistochemistry
Rat brains were cryoprotected with 30% sucrose buffer and frozen on dry ice. Coronal sections (35 μm) were cut with a sliding microtome (Microm, HM 400; Heidelberg). Matching sections (n = 3 per group) from FL and SO brains were selected from the relevant area for study (sensorimotor cortex) and double-immunolabeled with antibodies against α3 Na+/K+-ATPase plus parvalbumin or glutamic acid decarboxylase (GAD65). Free-floating sections were rinsed twice in PBS buffer followed by 50% alcohol. Non-specific binding was blocked by incubating the sections in 10% normal goat serum. Sections were then exposed to primary antibody at 4 °C overnight, and treated with secondary antibody conjugated to Fluorescein (Alexa-Fluor 488, 1:1000 for α3; Alexa-Fluor 568, 1:1500 for parvalbumin (PV) or 1:1000 for GAD for one hour at 25° C. Sections were then rinsed, air dried, and mounted with Vectashield mounting media (Vector Laboratories, Inc., Burlingame, CA). Parvalbumin and GAD65 antibodies were obtained from Sigma and Chemicon, respectively.
In-situ Hybridization
Perfused rat brains were removed, fixed in paraformaldehyde overnight, sliced coronally, and mounted on Superfrost-plus slides (Fisher Scientific). In-situ hybridization was performed as follows: Sections were (a) dried on a slide warmer for 30 min at 37°C, (b) fixed in 4% paraformaldehyde in diethyl pyrocarbonate (DEPC) H2O for 20 min, (c) rinsed with DEPC PBS (2 × 5 min), (d) deproteinated with proteinase K treatment (50 μg/ml; 1M Tris HCl at pH 7.5, and 0.1M EDTA) for 30 min at 25 °C. After deproteination, sections were: (a) rinsed in DEPC PBS (2 × 5 min), (b) fixed in 4% paraformaldehyde in DEPC H2O for 20 min, (c) briefly rinsed in DEPC H2O, (d) hybridized in hybridization buffer containing α3 Na+/K+-ATPase oligonucleotides (Antisense: CGG GAA GAG CGG CGG ACA GGC TGG TGA GCG GTG GCC GCA GGA; sense control: GCC CTT CTC GCC GCC TGT CCG ACC ACT CGC CAC CGG CGT CCT) for 24 h at 37 °C in a humid chamber.
Following hybridizations, sections were washed four times in 0.2X SSC for 20 min each at 47 °C, then subjected to amplification of the labeled probes: (a) sections were blocked in blocking protein in Tris buffered saline (TBS) for 30 min (Perkin Elmer Amplification Kit), (b) incubated in digitoxigenin-horseradish peroxidase in Tris buffered saline containing Tween 20 (TBST; 8 μl/ml) for 30 min at 25 °C, (c) rinsed in TBST (3 × 5 min), (d) incubated in tyramide solution (1:50 in kit diluent) for 10 min at 25 °C, (e) rinsed in TBST (3 × 5 min), (f) incubated in streptevidin-F (1:50) in TNB buffer (0.05 g/ml block protein in Tris-saline) for 30 min. Finally, sections were rinsed in TBST (2 × 5 min), air dried and mounted using Vectashield Mounting Media.
Data acquisition and analysis
Immunofluorescence-labeled sections were examined under a laser-scanning confocal fluorescence microscope (Carl Zeiss MicroImaging, Inc., Thornwood, NY). High magnification images (63X) of the neuropil were captured every 240 μm adjacent to the microsulcus up to 840 μm away in the paramicrogyral zone in cortical layer I. This process was repeated to record the immunointensity of the α3 subunit in cortical layers II/III and V. Images (40X) of α3 mRNA labeling were also taken every 230 μm from the microgyral edge up to 1.40 mm from the lesion. SigmaScan Pro image analysis software and Adobe Photoshop 7.0 were used to quantify the fluorescence intensity of labeled α3 subunits and GAD65-IR in the neuropil of each image on a relative scale of 0 to 255 intensity units. Data from FL and control animals were then compared using a two-tailed student T-test assuming equal variance. The immunointensity and staining patterns of neuropil in FL rats were compared to those of neuropil in the contralateral homotopic cortex of the same brain and neuropil from naive animals. The somatic areas of pyramidal cells and parvalbumin-containing interneurons in P21–28 FL and control rats were measured with SigmaScan software, using the inner boundaries of perisomatic halos of α3 IR as guidelines (Fig. 5B1). SigmaScan was also used to calculate α3 IR per unit length of the perisomatic membrane as well as α3 mRNA, which was measured as the average IR per cell somatic area. The differences between α3 subunit intensities and somatic areas in FL vs. control rats were analyzed for statistical significance using student t-tests in Microcal Origin 6.0. We also used Image J software to assess the intensity of IR of individual pixels in the perisomatic halos. Images were scaled to 8 bits and analyzed. The inner and outer boundaries of perisomatic halos were traced for cells in the two groups (Fig. 5B1), background subtracted measurements made and a histogram of the intensity of staining of pixels obtained.
Figure 5.
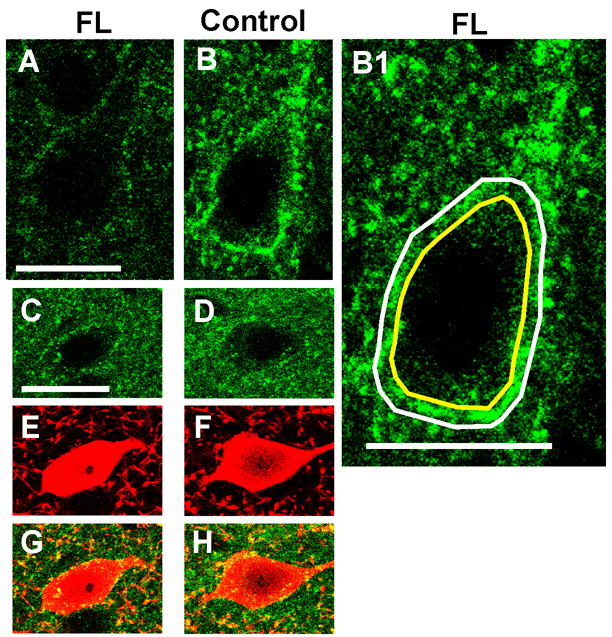
Comparison of cell somatic areas and perisomatic α3 subunit IR between FL and contralateral layer V cortices. A–B: α3 IR around representative P23 FL pyramidal neuron (A) vs. contralateral control (B). B1: Image of B, scaled ~2x showing approximate inner (yellow line) and outer boundaries (white line) of the perisomatic α3 Na+/K+-ATPase halo used to estimate somatic area and intensity of immunoreactivity per perimeter or unit length of somatic membrane (see Methods). C–D: α3 IR around parvalbumin-containing interneurons (E–F) from the same FL section as A and the same contralateral control section as B. G–H: merged images of C,E and D,F. Scale bar in A: 20 μm for A–B, B1; in C: 20 μm for C–H. Parvalbumin IR: red; α3 subunit IR: green. Quantitative data summarized in Fig. 6.
RESULTS
Age-related alterations in α3subunit in naïve and FL cortex
To test the hypothesis that changes in Na+/K+-ATPase α3 subunit IR in naive and FL cortex are age-related, α3 protein expression was examined using immunohistochemistry and confocal microscopy. Alpha-3 subunit labeling was present in neuropil of all processed tissue sections from naïve and FL cortex within all cortical layers analyzed (I–V), however, staining in naïve and contralateral cortex varied with age. The intensity of α3 Na+/K+-ATPase IR in sections from naïve and FL P7, P10, P14, P21–28, and P50–60 rats was compared (Methods) to gain a better understanding of the normal development of sodium pump expression and alterations in the microgyral cortex. As shown in Fig. 2 (compare B,C to E,F) and Fig. 3, α3 levels were low at P7 in control cortex (IR: 18.59 ± 4.00) and significantly increased by P10 (IR: 46.90 ± 3.62, p<0.05). Alpha-3 IR in P10 control cortical layer V was similar to that found in P14 (IR: 44.03 ±1.68), P21–28 (IR: 50.08 ± 7.17) and P50–60 rats (IR: 49.04 ± 8.22). The developmental timeline of the α3 subunit suggests that naive cortical neurons possess low Na+/K+-ATPase levels in immature brain (within the first postnatal week), but attain adult functional levels by the second postnatal week.
Figure 2.
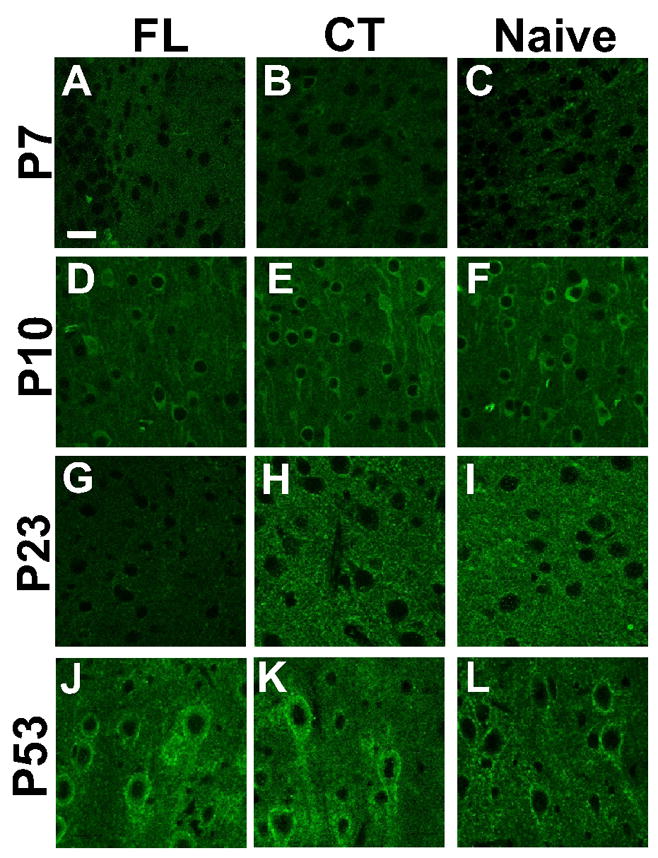
Representative confocal images of Na+/K+-ATPase α3 immunoreactivity (IR) in P7-P60 cortical layer V neuropil. A–C: Images (63×) of sections adjacent to the microgyral edge from P7 FL (n = 3), contralateral (CT) cortex (n = 3) and naive rats (n = 3). D–F: α3 IR in P10 FL (n = 3), CT cortex (n = 3) and naive animals (n = 3). G: Very weak α3 IR is detected in the neuronal processes of a P23 FL rat (n = 4). H–I: In the P21–28 CT (n = 4) and naive groups (n = 3), α3 IR is significantly more intense in neuronal processes compared to that in FL sections. J–L: In P53 sections, no detectable differences are present in α3 protein expression between FL (n = 3), CT (n = 3) and naive cortices (n = 3). Scale bar in A: 20 μm for all images.
Figure 3.
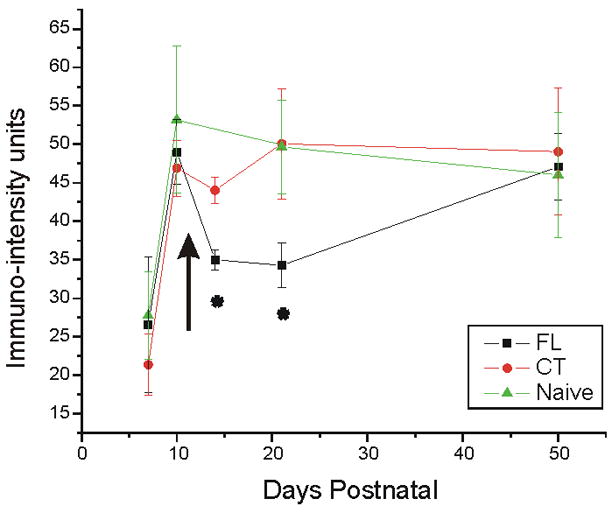
Developmental time line (P7-P50) of α3 subunit IR in FL, CT and naive cortical layer V neuropil. Alpha3 IR is low at P7 in FL and control rats, but increases significantly to adult levels by P10. In both CT and naive groups, no significant changes in α3 IR are found between P10 and P50, but FL α3 levels significantly decrease between P10 and P14–28, and increase to control levels by P50. Arrow corresponds to P12, the time of reported onset of epileptiform activity. Error bars: SEM in this and subsequent Figs. *: p<0.05. FL: freeze lesioned (n = 3 for P7, P10, P14, P50–60; n = 4 for P21–28); CT: contralateral control (n = 3 for P7, P10, P14, P50–60; n = 4 for P21–28); naive (n = 3 for all age groups).
The intensity of α3 Na+/K+-ATPase IR in the neuropil of cortical layer V in P21–28 FL rats was significantly decreased compared to both contralateral homotopic areas (p<0.05; Fig. 2, compare G and H) and corresponding areas from naïve cortex (p<0.05; Fig. 2, compare G and I). Immumoreactivity was faint in cell processes and apical dendrites of the FL sections and often indistinguishable from that in surrounding tissue. This decrease in α3 Na+/K+-ATPase-IR occurred only in P14 (IR: 35.00 ± 1.34) and P21–28 animals (IR: 34.38 ± 2.92), but not in the P7 (IR: 26.57 ± 8.81; Fig. 2A–C), P10 (IR: 49.00 ± 4.20; Fig. 2D–F), or P50–60 age groups (IR: 47.09 ± 4.29; Fig. 2J–L). Quantitative analysis of α3 immunointensity in the neuropil of layer V in all FL and control age groups is shown in Fig. 3. No differences in α3 IR were observed between contralateral control and naïve cortices at any age. The reduction in α3 Na+/K+-ATPase-IR in the paramicrogyral cortex occurred sometime between P10 and P14, with recovery by P50–60.
Topographic distribution of α3 Na+/K+-ATPase IR in the paramicrogyral zone
We next examined α3 Na+/K+-ATPase-IR in P7–P60 FL rats in the neuropil at varying distances from the edge of the microgyrus. A significant decrease (p<0.05) in α3 subunit IR in layer V neuropil of P14 (data not shown) and P21–28 rats was seen up to 360 μm from the microgyral edge (compare Fig. 4A–B to 4E–F; Fig. 4I). At greater distances from the microgyral edge, the α3 Na+/K+-ATPase-IR was not significantly decreased (compare Fig. 4C,D to 4G,H) although there was a trend toward decreased α3 IR (Fig. 4I). There was no significant reduction in α3 Na+/K+-ATPase-IR in cortical layers II/III of the paramicrogyral zone in the P14 and P21–28 age groups (p≫0.05), data not shown). There were also no significant alterations in sodium pump α3 IR in cortical layers I–V in P7, P10, and P50–60 age groups at distances of up to 840 μm from the microgyral edge, nor were there significant differences in α3 IR between contralateral control and naïve slices (Fig. 4I).
Figure 4.

Alpha-3 subunit IR in P21–28 cortical layer V neuropil at various distances from the microgyral edge and in control cortices. A–D: Confocal images show a significant downregulation in α3 protein in P23 FL (63X) within the paramicrogyral zone 120 and 360 μm from the microgyral edge (A,B compared to contralateral control E,F). Normal expression levels are present at 600–840 μm (C,D compared to G,H). E–H: Topographic distribution of α3 subunit is uniform across homotopic cortical areas in contralateral hemisphere. I: Quantitative analysis of α3 IR topographic distribution in P21–28 FL, contralateral and naive cortical layer V neuropil. Graph shows significant decreases in α3 IR up to 360 μm from the microgyral edge in FL rats, in contrast to uniform levels from 120–840 μm in contralateral control and naive cortices. *: p<0.05. FL: freeze lesioned (n = 3 for P7, P10, P50–60; n = 4 for P21–28); CT: contralateral control (n = 3 for P7, P10, P50–60; n = 4 for P21–28); naive (n = 3 for all groups). Scale bar in A: 20 μm for all sections.
Because α3 subunit IR was significantly down-regulated in layer V neuropil, we also examined IR in the perisomatic areas of layer V pyramidal and parvalbumin-containing cells, to more specifically determine pump expression in areas containing axon terminals and cell membranes. A significant decrease in α3 expression was observed in the perisomatic area of pyramidal cells (FL IR: 50.55 ± 4.67; CT IR: 87.81 ± 6.51; (p<0.05); compare Fig. 5A to 5B; Fig. 6A2) but not in parvalbumin-labeled interneurons (FL IR: 59.4 ± 9.30; CT IR: 63.97 ± 5.29; p>0.05; compare Fig. 5C,G to 5D,H; Fig. 6B2). Average α3 IR in the perisomatic area of P21–28 pyramidal and parvalbumin-labeled neurons was also measured using SigmaScan Pro software (see Methods). Double-labeling with antibodies against α3 and GAD65 revealed that α3 Na+/K+-ATPase-IR and GAD65-IR were co-localized in perisomatic puncta, presumably within inhibitory terminals that form the vast majority of axosomatic synapses onto pyramidal cells (Fig. 7C,F,I). However, both α3-IR and GAD65-IR were significantly reduced in P21–28 FL cortices (Fig. 7J) compared to their expression in contralateral cortex. Analysis of perisomatic IR with Image J software (Methods) showed that neurons on the contralateral side had greater numbers of pixels with more intense staining compared to the freeze lesion cells. These results, together with those of Figs. 5A,B and 6A2, indicate that α3 IR is down-regulated in inhibitory terminals on pyramidal cell somata. Additional decreases in somatic membranes might have gone undetected with the techniques employed..
Figure 6.
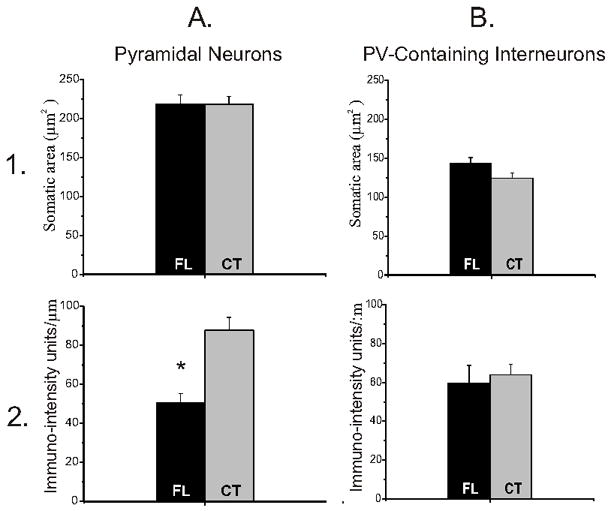
Quantitative analysis of perisomatic α3 IR and somatic areas between P21–28 FL and contralateral control pyramidal and parvalbumin-containing neurons. A1, B1: There were no significant differences in somatic areas of either pyramidal neurons or parvalbumin-containing interneurons between FL and control sections (A1) and (B1). A2,B2: Graphs show a significant decrease in pyramidal perisomatic α3 expression, measured per unit length of somatic membrane, in FL (A2), but not in parvalbumin-containing cells (B2). FL: freeze lesioned (n = 4); CT: contralateral control (n = 4). *: p<0.05.
Figure 7.

Double immunostaining for glutamic acid decarboxylase (GAD65; A,D,G, green) and α3 Na+/K+ ATPase (B,E,H, red) in layer V of naïve cortex (A–C), paramicrogyral cortex 360 μm from microgyral edge (G–I) and cortex contralateral to microgyrus (D–F). C,F and I: Merged images of A–B, D–E and G–H, respectively. * and O mark two neurons in images A–C, D–F and G–I. J: Graph of perisomatic α3- and GAD65-IR in paramicrogyral (n = 3) and contralateral (n = 3) cortex (see Methods). *: p<0.05. Scale bars in C and I: 10 μm for A–C and D–I, respectively.
Because significant decreases in a3 IR were observed in P21–28 paramicrogyral cortical layer V among the areas studied, the levels of α3 mRNA were assessed in this region in three P21–28 rats to determine whether there was a decrease in message associated with the decreased protein found in immunohistochemical experiments. Reductions in α3 mRNA-IR were observed in FL cortical layer V in the paramicrogyral zone up to 1610μm from the microgyral edge (Fig. 8A–D) compared to control sections (Fig. 8E–H; Fig. 8I). Collectively, these results suggest that both α3 protein and mRNA-IR are reduced in areas closest to the freeze lesion, although the reduction in mRNA appears to have a wider distribution.
Figure 8.
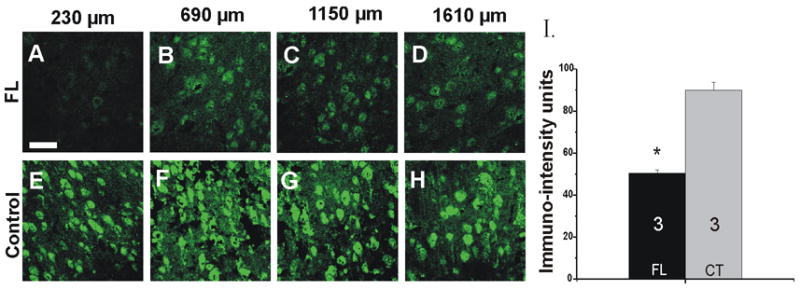
In-situ hybridization analysis of Na+/K+-ATPase α3 mRNA in P21–28 rat cortical layer V at various distances from the microgyral edge. A–D: α3 mRNA levels are down-regulated in FL cortex in the paramicrogyral zone compared to those in contralateral control sections. E–H: Contralateral control cortices show intense staining of α3 mRNA within the same topographic areas. The fluorescent intensity at 230 μm from the microgyral edge is much larger in control than in FL sections. I: Quantitation of α3 mRNA IR at 230 μm from the microgyral edge. Scale bar in A: 50 μm for all images. FL: freeze lesion (n = 3); CT: contralateral (n = 3); *: p<0.05.
Somatic areas of pyramidal cells and interneurons
The apparent decreases in perisomatic α3 protein in FL animals were not due to changes in somatic size, as there were no differences in pyramidal cell somatic area between FL and control cortices (Fig. 6A1), and because α3 IR was measured per unit length of somatic membrane (Methods; Fig. 6A2). Pyramidal cells in P21–28 FL cortical layer V had somatic areas that were similar to those of comparable neurons in the contralateral hemisphere (218.6±11.5 μm2 and 218.2±10.1 μm2, respectively; p>0.05; Fig. 6A1). Likewise, somatic areas of parvalbumin-containing interneurons in the paramicrogyral zone of FL cortex were not significantly different from those in control cortices (142.0±7.60 μm2 and 124.4±6.38 μm2, respectively; p≫0.05; Fig. 6B1). No statistical differences in the somatic areas for either of these cell types were found between FL and control cortices in layer V of the P7, P10, and P50–60 age groups (data not shown).
DISCUSSION
The principal results of these experiments include a decreased expression of α3 Na+/K+-ATPase in immature (≤P10) naïve neocortex, topographic and temporal alterations in the normal pattern of α3 protein expression in the epileptogenic zone adjacent to cortical microgyri, and perisomatic decreases in α3 Na+/K+-ATPase IR around layer V pyramidal cells, without similar alterations around GABAergic interneurons. Results suggest that alterations in sodium pump activity may contribute to epileptogenesis in this developmental model.
Developmental expression of α3 Na+/K+-ATPase in control neocortex
Alpha-3 IR is low at P7 in naïve rat neocortex and increases to adult levels between P7 and P10 (Fig. 3). Such changes in expression may begin earlier, however time points before P7 were not examined. Increases in this enzyme have also been reported in the hippocampal CA1 region between P7 and P35 (Fukuda and Prince, 1992) and in Purkinje cell membranes of rat cerebellum between P13 and P19 (Biser et al., 2000). Alpha-3 up-regulation may thus be a feature of early development in widespread regions of the rat brain. Although the functional implications of decreased α3 Na+/K+-ATPase during development have not been studied in the neocortex, in immature hippocampal CA1 pyramidal cells decreased postnatal Na+/K+-ATPase IR is associated with decreased functional pump activity (Fukuda and Prince, 1992).
Age-dependent characteristics of α3 expression and epileptogenesis in FL cortex
The histopathological similarity between human microgyria and microgyri induced by focal neocortical freeze lesions suggests that the latter may be a good model in which to investigate specific processes, such as changes in protein expression, which may correlate with the occurrence of cortical hyperexcitability. Results show that the developmental increase in α3 protein expression in FL rats follows a time course similar to that in naïve cortex in the first 10 postnatal days (Fig. 3). A significant decrease in α3 IR occurs in FL cortices between P10 and P14–28 with a return towards control levels by P50–60. This decrease in α3 expression occurs in an age range during which epileptiform activity can be evoked in microgyral slices (Jacobs et al., 1999a). Histologically, the microgyrus is fully developed by P10 (Dvorak and Feit, 1977), however epileptiform activity in vitro was only observed in slices at P12 or thereafter. A high incidence of abnormal evoked discharges is present in the paramicrogyral zone in slices up to P40, after which the percentage of slices with evoked epileptiform activity decreases sharply in P0>P1 lesioned rats (Jacobs et al., 1999a). There is thus an approximate correspondence between the onset of the decrease in α3 IR in the paramicrogyral zone in the present experiments (Fig. 3) and the onset of evoked epileptiform activity in vitro. However, the decreased α3 IR recovers to control levels sometime between P21 and P50, whereas the hyperexcitability can persist for longer periods, particularly in the P1 lesioned group.
Interpretation of these data is limited by the small number of time points. A reduction in α3 expression is not detectable prior to P10, however it is not clear whether the decrease thereafter temporally precedes or follows the onset of epileptogenesis as detected in vitro (arrow in Fig. 3). The time of onset of epileptogenesis in vivo in this model is unknown, so it is not possible to determine whether the decreased α3 Na+/K+-ATPase IR is a result of abnormal activity, contributes to its onset, or is unrelated. Activity-related protein decreases occur following acute seizure activity in other models of epileptogenesis (e.g. Rivera et al, 2004). Results of recent experiments show that acute epileptiform activity in naïve cortex in vivo may result in a decrease in α-3 Na+/K+-ATPase IR (Lee et al, 2006; I. Parada, W. McDonald and DA Prince, unpublished observations), and high frequency stimulation of afferents can inhibit the pump in hippocampal interneurons for long periods of time (Ross and Soltesz, 2001). Thus, spontaneous epileptiform activity in the paramicrogyral cortex could account for the decreases in α3 Na+/K+-ATPase protein and mRNA reported here. A number of other abnormalities are present in the paramicrogyral zone, including alterations in structural and functional connectivity (Prince and Jacobs, 1998; Jacobs et al., 1999a,b), receptor changes (Hablitz and DeFazio, 2000; Redecker et al, 2000), changes in GABAergic neurons (Rosen et al., 1998) and gliosis (Bordey et al., 2001), all of which may contribute to the onset or maintenance of epileptogenesis.
Alpha-3 distribution in the epileptogenic zone
Previous results show that epileptiform activity can be evoked at P12–21 in a high percentage of slices containing the microgyrus when stimuli are delivered within 1.4 mm of the microsulcus, whereas stimulation at sites >2.5 mm from the microsulcus fails to elicit epileptiform responses (Jacobs et al., 1999a). Spread of the stimulating current or excitation of axons in passage may have influenced this estimate of the extent of epileptogenic cortex. Alpha-3 IR was significantly decreased in P21–28 FL layer V in a more restricted distribution, up to 360 μm from the microgyral edge, or ~700–800 μm from the microsulcus, in an area that overlaps in part with the epileptogenic zone, while non-significant reductions were present up to 840 μm from the microgyral edge (Fig. 4I). The decrease in α3 mRNA in the paramicrogyral zone is more extensive than decreases in α3 protein IR (compare Figs. 4I and 8). Declines in mRNA abundance indicate pre-translational regulatory events, such as reductions in mRNA synthesis and/or stability. The mechanisms leading to decreases in α3 mRNA in FL cortices were not addressed in the present experiments. Alpha-3 subunit down-regulation may not be the result of decreased protein production but rather changes in factors controlling protein turnover, such as an up-regulation in the amount of protease activities.
Down-regulation of α3 protein may be due to either injury in the absence of epileptiform activity, or abnormal cortical activity, or both. Formation of the microgyrus itself is obviously a result of early neocortical injury evidenced by the characteristic absence of layers IV-VI beneath the malformation and the presence of cortical pathology including gliosis (Rosen et al, 1992). Also, the density of parvalbumin-containing interneurons is significantly decreased in layer V of the paramicrogyral zone (Rosen at al, 1998), raising the possibility that some of the reduction in neuropil and pyramidal perisomatic α3-IR might be due to cell loss. Comparable data for pyramidal cell counts are not available. However, the absence of decreases in α3-IR at P7 and P10 following the P0 or P1 freeze lesion and subsequent recovery at 50 days (Fig 3) suggest that cell death did not make a major contribution to our findings. Axotomy and other types of neuronal damage can result in alterations in mRNAs and proteins in CNS neurons (e.g. Bisby and Tetzleff, 1992; Mason et al, 2003) and decreases in the pump can follow direct injury to cortical neurons in vitro (Tavalin et al, 1997) and traumatic brain injury in vivo (Ross and Soltesz, 2000).
Potential functional consequences of reductions in Na+/K+-ATPase
Disorders of pump function can influence the capacity of cortex to generate epileptiform activity (Donaldson et al., 1971; Haglund and Schwartzkroin, 1990; Vaillend et al., 2002). Both decreases and increases in pump activity have been found in animal models of epilepsy (Cowan and Cavalheiro, 1980; Anderson et al., 1994; Kang et al., 2004) and in human epileptic brain (Brines et al., 1995), suggesting that both epileptogenic lesions and abnormal activity itself can influence expression of the pump.
Down-regulation of the sodium pump in microgyral epileptogenic cortex could alter cortical excitability through multiple effects. The pump contributes between 9–45% of resting membrane potential in different neurons (Dobretsov and Stimers, 2005) and ~2–10 mV to the resting potential of layer V pyramidal cells in naïve neocortex (Anderson et al, 2007), so that a decrease in pump function could result in depolarization and increased spiking under resting conditions. The rate of pumping is proportional to the [Na+]i (Thomas, 1972) and Na+ loading, due to the increased glutamatergic excitation and action potential firing in epileptogenic cortex would require increases in pump activity. Reduced pump function could thus result in larger and more prolonged depolarizations during intense activity (Fukuda and Prince, 1992). Increases in [Ca++]i due to both activation of voltage-dependent conductances and to effects of Na+ loading on the Na+/Ca++ exchanger (Blaustein, 1988), could further reduce pump activity during epileptogenesis (Fukuda and Prince, 1992), resulting in a vicious cycle that might produce neuronal injury. Pump activity may also be reduced by decreases in ATP substrate as might occur during intense activity (Ross and Soltesz, 2001) and following neuronal injury (Tavalin et al., 1997; Ross and Soltesz, 2000).
Alterations in pump activity would also have important effects on synaptic transmission. Portions of the neuron with a high surface to volume ratio (e.g. axons and axonal terminals) would require a higher density of pump molecules and might be differentially affected by reduced pump function. Axons and dendrites of pyramidal neurons do contain the pump, and there is also a prominent expression of α3 Na+-K+ ATPase in interneurons and their axons (Richards et al., 2007). Na+-K+ ATPase in GABAergic interneurons and their processes in the dentate gyrus, hippocampal CA1 region and entorhinal cortex, is increased significantly following seizures in gerbils, (Kang et al., 2004), however the electrophysiological impact of these changes has not been directly assessed. In hippocampal slices, pump blockade by dihydroouabain leads to interictal epileptiform activity associated with a large decrease in action potential-related GABA release (Vaillend et al., 2002), an effect attributed to depolarization of presynaptic terminals due to Na+ entry.
There is a significant reduction in the intensity of the halos of α3 Na+/K+-ATPase-IR around pyramidal cells in the paramicrogyral region (Figs. 5A–B, 6A2). The thickness of the perisomatic signal (e.g. Fig. 5B) suggests that α3 protein is localized in axonal terminals contacting the somata, with a possible additional contribution from pyramidal cell somatic membranes. These terminals also contain GAD65, indicating that they represent the predominant inhibitory input from fast-spiking, parvalbumin-containing GABAergic interneurons that target pyramidal somata (Fig. 7; Lee et al, 2006). Contributions to the Na+/K+-ATPase halos from excitatory terminals axons would be much smaller (Thomson et al, 1996). About 25–30% of all PV-containing boutons terminate in the perisomatic region of pyramidal neurons in the neocortex (Freund and Katona, 2007). Therefore, a down-regulation of α3 subunit in inhibitory terminals projecting onto pyramidal cell somata would be the major contributing factor to decreases in perisomatic α3 IR. Considering the large surface to volume ratio in axons, the increase in [Na+]i during high frequency FS cell spike discharge would be enhanced in terminals with decreased sodium pump, perhaps resulting in depolarization and reduced evoked GABA release such as is seen when pump activity is acutely blocked by dihydroouabain (Vaillend et al, 2002). Interestingly, although α3–IR was reduced in the perisomatic areas of FL P21–28 layer V pyramidal neurons, there was no comparable significant alteration around parvalbumin-containing interneurons (Figs. 5C-D, 6B2). We speculate that this may be due to a relatively greater injury induced in pyramidal vs. local circuit neurons by the freeze lesion procedure, resulting in decreased trophic actions of pyramidal cells onto their presynaptic GABAergic terminals (e.g. Kohara et al 2007).
Without more details regarding the functional state of the sodium pump in pyramidal cells and interneurons and their axonal terminals, it is difficult to predict the net effect of the abnormalities in Na+-K+ ATPase expression described above and potential contributions to development of hyperexcitability in the paramicrogyral zone. The complexity of potential effects of decreases in Na+/K+-ATPase activity has recently been emphasized by the suggestion of a significant link with inward Cl− transport and NKCC1 activity that would affect GABAergic inhibition (Brumback and Staley, 2008). Other pathophysiological abnormalities are present and likely contribute to epileptogenesis in the microgyral model (Hablitz and DeFazio, 2000; Redecker et al., 2000; Patrick et al., 2006).
We conclude that altered Na+/K+-ATPase α3 subunit expression may be a contributing factor to the cortical hyperexcitability in the freeze lesion model of microgyria.
Acknowledgments
We thank Fran Shen for help with immunohistochemistry and Whitney MacDonald for assistance with freeze-lesion surgeries. This work was supported by NIH grants NS39579 and NS12151 from the NINDS (DAP) and undergraduate research grants from Stanford University (YC).
Abbreviations
- FL
freeze lesion
- CT
contralateral
- PMG
paramicrogyral zone
- GABA
gamma-aminobutyric acid
- IR
immunoreactivity
- SO
sham operated
- GAD
glutamic acid decarboxylase
- PV
parvalbumin
- FS
fast-spiking
Footnotes
Publisher's Disclaimer: This is a PDF file of an unedited manuscript that has been accepted for publication. As a service to our customers we are providing this early version of the manuscript. The manuscript will undergo copyediting, typesetting, and review of the resulting proof before it is published in its final citable form. Please note that during the production process errors may be discovered which could affect the content, and all legal disclaimers that apply to the journal pertain.
References
- 1.Anderson WR, Franck JE, Stahl WL, Maki AA. Na,K-ATPase is decreased in hippocampus of kainite-lesioned rats. Epilepsy Res. 1994;17:221–231. doi: 10.1016/0920-1211(94)90052-3. [DOI] [PubMed] [Google Scholar]
- 2.Anderson TR, Huguenard JR, Prince DA. Differential effects of Na+/K+ ATPase blockade and activation in layer V neocortical neurons. Soc Neurosci Abst Program #364.15 2007 [Google Scholar]
- 3.Avanzini G, Franceschetti S, Mantegazza M. Epileptogenic channelopathies: experimental models of human pathologies. Epilepsia. 2007;S2:51–64. doi: 10.1111/j.1528-1167.2007.01067.x. [DOI] [PubMed] [Google Scholar]
- 4.Avramescu S, Timofeev I. Synaptic strength modulation after cortical trauma: a role in epileptogenesis. J Neurosci. 2008;28:6760–6772. doi: 10.1523/JNEUROSCI.0643-08.2008. [DOI] [PMC free article] [PubMed] [Google Scholar]
- 5.Barkovich AJ, Kjos BO. Nonlissencephalic cortical dysplasias: correlation of imaging findings with clinical deficits. AJNR Am J Neuroradiol. 1992;13:95–103. [PMC free article] [PubMed] [Google Scholar]
- 6.Beckmann H. Developmental malformations in cerebral structures of schizophrenic patients. Eur Arch Psychiatry Clin Neurosci. 1999;S4:44–47. doi: 10.1007/pl00014184. [DOI] [PubMed] [Google Scholar]
- 7.Bernard C, Anderson A, Becker A, Poolos NP, Beck H, Johnston D. Acquired dendritic channelopathy in temporal lobe epilepsy. Science. 2004;305:532–535. doi: 10.1126/science.1097065. [DOI] [PubMed] [Google Scholar]
- 8.Bertaso F, Zhang C, Scheschonka A, de Bock F, Fontanaud P, Marin P, Huganir RL, Betz H, Bockaert J, Fagni L, Lerner-Natoli M. PICK1 uncoupling from mGluR7a causes absence-like seizures. Nat Neurosci. 2008;11:940–948. doi: 10.1038/nn.2142. [DOI] [PMC free article] [PubMed] [Google Scholar]
- 9.Bisby MA, Tetzlaff W. Changes in cytoskeletal protein synthesis following axon injury and during axon regeneration. Mol Neurobiol. 1992;6:107–123. doi: 10.1007/BF02780547. [DOI] [PubMed] [Google Scholar]
- 10.Biser PS, Thayne KA, Kong JQ, Fleming WW, Taylor DA. Quantification of the α-3 subunit of the Na+/K+-ATPase in developing rat cerebellum. Brain Res Dev Brain Res. 2000;123:165–172. doi: 10.1016/s0165-3806(00)00084-5. [DOI] [PubMed] [Google Scholar]
- 11.Blaustein MP. Calcium transport and buffering in neurons. Trends Neurosci. 1988;11:38–443. doi: 10.1016/0166-2236(88)90195-6. [DOI] [PubMed] [Google Scholar]
- 12.Bordey A, Lyons SA, Hablitz JJ, Sontheimer H. Electrophysiological characteristics of reactive astrocytes in experimental cortical dysplasia. J Neurophysiol. 2001;85:1719–1731. doi: 10.1152/jn.2001.85.4.1719. [DOI] [PubMed] [Google Scholar]
- 13.Brines ML, Tabuteau H, Sundaresan S, Kim J, Spencer DD, de Lanerolle N. Regional distributions of hippocampal Na+, K(+)-ATPase, cytochrome oxidase, and total protein in temporal lobe epilepsy. Epilepsia. 1995;36:371–383. doi: 10.1111/j.1528-1157.1995.tb01012.x. [DOI] [PubMed] [Google Scholar]
- 14.Brodtkorb E. The diversity of epilepsy in adults with severe developmental disabilities: age at seizure onset and other prognostic factors. Seizure. 1994;3:277–285. doi: 10.1016/s1059-1311(05)80175-x. [DOI] [PubMed] [Google Scholar]
- 15.Brumback AC, Staley KJ. Thermodynamic regulation of NKCC1-mediated Cl-cotransport underlies plasticity of GABA(A) signaling in neonatal neurons. J Neurosci. 2008;28:1301–131. doi: 10.1523/JNEUROSCI.3378-07.2008. [DOI] [PMC free article] [PubMed] [Google Scholar]
- 16.Burke JP, Hablitz JJ. Modulation of epileptiform activity by metabotropic glutamate receptors in immature rat neocortex. J Neurophysiol. 1995;73:205–217. doi: 10.1152/jn.1995.73.1.205. [DOI] [PubMed] [Google Scholar]
- 17.Cobb SR, Buhl EH, Halasy K, Paulsen O, Somogyi P. Synchronization of neuronal activity in hippocampus by individual GABAergic interneurons. Nature. 1995;378:75–78. doi: 10.1038/378075a0. [DOI] [PubMed] [Google Scholar]
- 18.Cossart R, Dinocourt C, Hirsch JC, Merchan-Perez A, De Felipe J, Ben-Ari Y, Esclapez M, Bernard C. Dendritic but not somatic GABAergic inhibition is decreased in experimental epilepsy. Nat Neurosci. 2001;4:52–62. doi: 10.1038/82900. [DOI] [PubMed] [Google Scholar]
- 19.Cowan CM, Cavalheiro EA. Epilepsy and membrane Na+K+ATPase: changes in activity using an experimental model of epilepsy. Acta Physiol Lat Am. 1980;30:253–258. [PubMed] [Google Scholar]
- 20.Dobretsov M, Stimers JR. Neuronal function and alpha3 isoform of the Na/K-ATPase. Front Biosci. 2005;10:2373–2396. doi: 10.2741/1704. [DOI] [PubMed] [Google Scholar]
- 21.Donaldson J, St Pierre T, Minnich J, Barbeau A. Seizures in rats associated with divalent cation inhibition of Na+-K+-ATPase. Can J Biochem. 1971;49:1217–1224. doi: 10.1139/o71-175. [DOI] [PubMed] [Google Scholar]
- 22.Dvorak K, Feit J. Migration of neuroblasts through partial necrosis of the cerebral cortex in newborn rats. Contribution to the problems of morphological development and developmental period of cerebral microgyria. Acta Neuropathol. 1977;38:203–212. doi: 10.1007/BF00688066. [DOI] [PubMed] [Google Scholar]
- 23.Dvorak K, Feit J. Testing of the course of neurogenesis and gliogenesis in the germinative zones of the CNS of embryonal and early postnatal rats by means of that gel reaction for the histochemical demonstration of the thiamine-pyrophosphatase. Histochemical and autoradiographical study. Acta Histochem. 1978;63:89–104. doi: 10.1016/S0065-1281(78)80011-7. [DOI] [PubMed] [Google Scholar]
- 24.Dvorak K, Feit J, Jurankova Z. Experimentally induced focal microgyria and status verrucosus deformis in rats. Pathogenesis and inter-relation histological and autoradiographical study. Acta Neuropathol. 1978;44:121–129. doi: 10.1007/BF00691477. [DOI] [PubMed] [Google Scholar]
- 25.Esclapez M, Hirsch JC, Ben-Ari Y, Bernard C. Newly formed excitatory pathways provide a substrate for hyperexcitability in experimental temporal lobe epilepsy. J Comp Neurol. 1999;408:449–460. doi: 10.1002/(sici)1096-9861(19990614)408:4<449::aid-cne1>3.0.co;2-r. [DOI] [PubMed] [Google Scholar]
- 26.Freund TF, Katona I. Perisomatic inhibition. Neuron. 2007;56:33–42. doi: 10.1016/j.neuron.2007.09.012. [DOI] [PubMed] [Google Scholar]
- 27.Fukuda A, Prince DA. Postnatal development of electrogenic sodium pump activity in rat hippocampal pyramidal neurons. Brain Res Dev Brain Res. 1992;65:101–114. doi: 10.1016/0165-3806(92)90013-m. [DOI] [PubMed] [Google Scholar]
- 28.Guerrini R. Genetic malformations of the cerebral cortex and epilepsy. Epilepsia. 2005;S1:32–37. doi: 10.1111/j.0013-9580.2005.461010.x. [DOI] [PubMed] [Google Scholar]
- 29.Hablitz JJ, DeFazio RA. Altered receptor subunit expression in rat neocortical malformations. Epilepsia. 2000;41:S82–S85. doi: 10.1111/j.1528-1157.2000.tb01562.x. [DOI] [PubMed] [Google Scholar]
- 30.Haglund MM, Schwartzkroin PA. Role of Na-K pump potassium regulation and IPSPs in seizures and spreading depression in immature rabbit hippocampal slices. J Neurophysiol. 1990;63:225–239. doi: 10.1152/jn.1990.63.2.225. [DOI] [PubMed] [Google Scholar]
- 31.Jacobs KM, Gutnick MJ, Prince DA. Hyperexcitability in a model of cortical maldevelopment. Cereb Cortex. 1996;6:514–523. doi: 10.1093/cercor/6.3.514. [DOI] [PubMed] [Google Scholar]
- 32.Jacobs KM, Hwang BJ, Prince DA. Focal epileptogenesis in a rat model of polymicrogyria. J Neurophysiol. 1999a;81:159–173. doi: 10.1152/jn.1999.81.1.159. [DOI] [PubMed] [Google Scholar]
- 33.Jacobs KM, Kharazia VN, Prince DA. Mechanisms underlying epileptogenesis in cortical malformations. Epilepsy Res. 1999b;36:165–188. doi: 10.1016/s0920-1211(99)00050-9. [DOI] [PubMed] [Google Scholar]
- 34.Jacobs KM, Graber KD, Kharazia VN, Parada I, Prince DA. Postlesional epilepsy: the ultimate brain plasticity. Epilepsia. 2000;41:S153–S161. doi: 10.1111/j.1528-1157.2000.tb01574.x. [DOI] [PubMed] [Google Scholar]
- 35.Kang TC, Park SK, Hwang IK, An SJ, Won MH. Altered Na+-K+ ATPase immunoreactivity within GABAergic neurons in the gerbil hippocampal complex induced by spontaneous seizure and vigabatrin treatment. Neurochem Int. 2004;45:179–187. doi: 10.1016/j.neuint.2003.10.008. [DOI] [PubMed] [Google Scholar]
- 36.Kohara K, Yasuda H, Huang Y, Adachi N, Sohya K, Tsumoto T. A local reduction in cortical GABAergic synapses after a loss of endogenous brain-derived neurotrophic factor, as revealed by single-cell gene knock-out method. J Neurosci. 2007;27:7234–7244. doi: 10.1523/JNEUROSCI.1943-07.2007. [DOI] [PMC free article] [PubMed] [Google Scholar]
- 37.Lee L, Parada I, Prince DA. Downregulation of the α3 subunit of Na+K+ ATPase in a model of post-traumatic epileptogenesis. Epilepsia 3.058. 2006 [Google Scholar]
- 38.Li S, Stys PK. Na+/K+-ATPase inhibition and depolarization induce glutamate release via reverse Na+-dependent transport in spinal cord white matter. Neuroscience. 2001;107:675–83. doi: 10.1016/s0306-4522(01)00385-2. [DOI] [PubMed] [Google Scholar]
- 39.Livingstone MS, Rosen GD, Drislane FW, Galaburda AM. Physiological and anatomical evidence for a magnocellular defect in developmental dyslexia. Proc Natl Acad Sci U S A. 1991;88:7943–7947. doi: 10.1073/pnas.88.18.7943. [DOI] [PMC free article] [PubMed] [Google Scholar]
- 40.Mason MR, Lieberman AR, Anderson PN. Corticospinal neurons up-regulate a range of growth-associated genes following intracortical, but not spinal, axotomy. Eur J Neurosci. 2003;18:789–802. doi: 10.1046/j.1460-9568.2003.02809.x. [DOI] [PubMed] [Google Scholar]
- 41.McGrail KM, Phillips JM, Sweadner KJ. Immunofluorescent localization of three Na/K-ATPase isozymes in the rat central nervous system: both neurons and glia can express more than one Na/K-ATPase. J Neurosci. 1991;11:381–391. doi: 10.1523/JNEUROSCI.11-02-00381.1991. [DOI] [PMC free article] [PubMed] [Google Scholar]
- 42.Oliveira EP, Hage SR, Guimaraes CA, Brandao-Almeida I, Lopes-Cendes I, Guerreiro CA, Teixeira KC, Montenegro MA, Cendes F, Guerreiro MM. Characterization of language and reading skills in familial polymicrogyria. Brain Dev. 2008;30:254–260. doi: 10.1016/j.braindev.2007.08.010. [DOI] [PubMed] [Google Scholar]
- 43.Patrick SL, Connors BW, Landisman CE. Developmental changes in somatostatin-positive interneurons in a freeze-lesion model of epilepsy. Epilepsy Res. 2006;70:161–171. doi: 10.1016/j.eplepsyres.2006.04.001. [DOI] [PubMed] [Google Scholar]
- 44.Prince DA, Tseng GF. Epileptogenesis in chronically injured cortex: in vitro studies. J Neurophysiol. 1993;69:1276–1291. doi: 10.1152/jn.1993.69.4.1276. [DOI] [PubMed] [Google Scholar]
- 45.Prince DA, Jacobs K. Inhibitory function in two models of chronic epileptogenesis. Epilepsy Res. 1998;32:83–92. doi: 10.1016/s0920-1211(98)00042-4. [DOI] [PubMed] [Google Scholar]
- 46.Rakhade SN, Zhou C, Aujla PK, Fishman R, Sucher NJ, Jensen FE. Early alterations of AMPA receptors mediate synaptic potentiation induced by neonatal seizures. J Neurosci. 2008;28:7979–7990. doi: 10.1523/JNEUROSCI.1734-08.2008. [DOI] [PMC free article] [PubMed] [Google Scholar]
- 47.Redecker C, Luhmann HJ, Hagemann G, Fritschy JM, Witte OW. Differential downregulation of GABAA receptor subunits in widespread brain regions in the freeze-lesion model of focal cortical malformations. J Neurosci. 2000;20:5045–5053. doi: 10.1523/JNEUROSCI.20-13-05045.2000. [DOI] [PMC free article] [PubMed] [Google Scholar]
- 48.Ribak CE, Harris AB, Vaughn JE, Roberts E. Inhibitory, GABAergic nerve terminals decrease at sites of focal epilepsy. Science. 1979;205:211–214. doi: 10.1126/science.109922. [DOI] [PubMed] [Google Scholar]
- 49.Richards KS, Bommert K, Szabo G, Miles R. Differential expression of Na+/K+-ATPase alpha-subunits in mouse hippocampal interneurons and pyramidal cells. J Physiol. 2007;585:491–505. doi: 10.1113/jphysiol.2007.144733. [DOI] [PMC free article] [PubMed] [Google Scholar]
- 50.Rivera C, Voipio J, Thomas-Crusells J, Li H, Emri Z, Sipila S, Payne JA, Minichiello L, Saarma M, Kaila K. Mechanism of activity-dependent downregulation of the neuron-specific K-Cl cotransporter KCC2. J Neurosci. 2004;24:4683–4691. doi: 10.1523/JNEUROSCI.5265-03.2004. [DOI] [PMC free article] [PubMed] [Google Scholar]
- 51.Rosen GD, Press DM, Sherman GF, Galaburda AM. The development of induced cerebrocortical microgyria in the rat. J Neuropathol Exp Neurol. 1992;51:601–611. doi: 10.1097/00005072-199211000-00005. [DOI] [PubMed] [Google Scholar]
- 52.Rosen GD, Jacobs KM, Prince DA. Effects of neonatal freeze lesions on expression of parvalbumin in rat neocortex. Cereb Cortex. 1998;8:753–761. doi: 10.1093/cercor/8.8.753. [DOI] [PubMed] [Google Scholar]
- 53.Ross ST, Soltesz I. Selective depolarization of interneurons in the early posttraumatic dentate gyrus: involvement of the Na+/K+-ATPase. J Neurophysiol. 2000;83:2916–2930. doi: 10.1152/jn.2000.83.5.2916. [DOI] [PubMed] [Google Scholar]
- 54.Ross ST, Soltesz I. Long-term plasticity in interneurons of the dentate gyrus. Proc Natl Acad Sci U S A. 2001;98:8874–8879. doi: 10.1073/pnas.141042398. [DOI] [PMC free article] [PubMed] [Google Scholar]
- 55.Salin PA, Tseng GF, Hoffman SN, Parada I, Prince DA. Axonal sprouting in layer V pyramidal neurons of chronically injured cerebral cortex. J Neurosci. 1995;15:8234–8245. doi: 10.1523/JNEUROSCI.15-12-08234.1995. [DOI] [PMC free article] [PubMed] [Google Scholar]
- 56.Shyjan AW, Leveson R. Antisera specific for the a1, a2, a3, and b subunits of the Na/K-ATPase: differential expression of a and b subunits in rat tissue membranes. Biochemistry. 1989;28:4531–4535. doi: 10.1021/bi00437a002. [DOI] [PubMed] [Google Scholar]
- 57.Sutor B, Hablitz JJ. EPSPs in rat neocortical neurons in vitro. II. Involvement of N-methyl-D-aspartate receptors in the generation of EPSPs. J Neurophysiol. 1989;61:621–634. doi: 10.1152/jn.1989.61.3.621. [DOI] [PubMed] [Google Scholar]
- 58.Tauck DL, Nadler JV. Evidence of functional mossy fiber sprouting in hippocampal formation of kainic acid treated rats. J Neurosci. 1985;5:1016–1022. doi: 10.1523/JNEUROSCI.05-04-01016.1985. [DOI] [PMC free article] [PubMed] [Google Scholar]
- 59.Tavalin SJ, Ellis EF, Satin LS. Inhibition of the electrogenic Na pump underlies delayed depolarization of cortical neurons after mechanical injury or glutamate. J Neurophysiol. 1997;77:632–638. doi: 10.1152/jn.1997.77.2.632. [DOI] [PubMed] [Google Scholar]
- 60.Thomas R. Electrogenic sodium pump in nerve and muscle cells. Physiol Rev. 1972;52:563–594. doi: 10.1152/physrev.1972.52.3.563. [DOI] [PubMed] [Google Scholar]
- 61.Thomson AM, West DC, Hahn J, Deuchars J. Single axon IPSPs elicited in pyramidal cells by three classes of interneurons in slices of rat neocortex. J Physiol. 1996;496:81–102. doi: 10.1113/jphysiol.1996.sp021667. [DOI] [PMC free article] [PubMed] [Google Scholar]
- 62.Truwit CL, Barkovich AJ, Koch TK, Ferriero DM. Cerebral palsy: MRI findings in 40 patients. AJNR Am J Neuroradiol. 1992;13:67–78. [PMC free article] [PubMed] [Google Scholar]
- 63.Vaillend C, Mason SE, Cuttle MF, Alger BE. Mechanisms of neuronal hyperexcitability caused by partial inhibition of Na+/K+-ATPase in the rat CA1 hippocampal region. J Neurophysiol. 2002;88:2963–2978. doi: 10.1152/jn.00244.2002. [DOI] [PubMed] [Google Scholar]
- 64.Villani F, D’Incerti L, Granata T, Battaglia G, Vitali P, Chiapparini L, Avanzini G. Epileptic and imaging findings in perinatal hypoxic-ischemic encephalopathy with ulegyria. Epilepsy Res. 2003;55:235–243. doi: 10.1016/s0920-1211(03)00121-9. [DOI] [PubMed] [Google Scholar]
- 65.Yang L, Benardo LS. Epileptogenesis following neocortical trauma from two sources of disinhibition. J Neurophysiol. 1997;78:2804–2810. doi: 10.1152/jn.1997.78.5.2804. [DOI] [PubMed] [Google Scholar]