Abstract
This paper presents a new approach to rotation invariant texture classification. The proposed approach benefits from the fact that most of the texture patterns either have directionality (anisotropic textures) or are not with a specific direction (isotropic textures). The wavelet energy features of the directional textures change significantly when the image is rotated. However, for the isotropic images, the wavelet features are not sensitive to rotation. Therefore, for the directional textures it is essential to calculate the wavelet features along a specific direction. In the proposed approach, the Radon transform is first employed to detect the principal direction of the texture. Then, the texture is rotated to place its principal direction at 0°. A wavelet transform is applied to the rotated image to extract texture features. This approach provides a features space with small intra-class variability and therefore good separation between different classes. The performance of the method is evaluated using three texture sets. Experimental results show the superiority of the proposed approach compared with some existing methods.
Index Terms: Texture classification, Radon transform, wavelet transform, rotation invariance
I. INTRODUCTION
Texture analysis plays an important role in computer vision and image processing. The applications include medical imaging, remote sensing, content-based image retrieval, and document segmentation. Translation, rotation, and scale invariant texture analysis methods have been of particular interest. In this paper, we are concerned with the rotation invariant texture classification problem. Wavelet transform has been widely used for texture classification in the literature. Wavelet provides spatial/frequency information of texture, which is useful for classification and segmentation. However, it is not rotation invariant. The reason being is that textures have different frequency components along different orientations. Ordinary wavelet transform captures the variations along specific directions (namely horizontal, vertical, and diagonal), due to the separability of the wavelet basis functions. So far, some attempts have been directed towards rotation invariant texture analysis using wavelet transform [1]–[8]. Some of the proposed methods use a preprocessing step to make the analysis invariant to rotation [2],[6],[8]. Some use rotated wavelets and exploit the steerability to calculate the wavelet transform for different orientations to achieve invariant features [4],[7]. There are also some approaches that do not use wavelet transform, e.g., [9],[10].
This paper presents a new approach to rotation invariant texture classification using Radon and wavelet transforms. The proposed approach benefits from the fact that most of the texture patterns either have directionality (anisotropic textures) or are not with a specific direction (isotropic textures). For directional textures, the frequency components and consequently the wavelet features change significantly as the image rotates. However, for isotropic textures the frequency components do not change significantly at different orientations. Therefore, the wavelet features are approximately invariant to rotation [11]. This motivates us to find a principal direction for each texture and calculate the wavelet features along this direction to achieve rotation invariance. This is similar to manual texture analysis when we rotate the unknown texture to match one of the known textures. There are techniques in the literature to estimate the orientation of the image, including methods based on image gradients [12], angular distribution of signal power in the Fourier domain [13],[14] and signal autocorrelation structure [12]. Here, we propose Radon transform to estimate the texture orientation.
II. Proposed Method for Texture Orientation Estimation
Due to the inherent properties of the Radon transform, it is a useful tool to capture the directional information of the images. The Radon transform of a 2-D function f (x, y) is defined as:
| (1) |
where r is the perpendicular distance of a line from the origin and θ is the angle between the line and the y-axis [15]. The Radon transform can be used to detect linear trends in images. Texture principal direction can be roughly defined as the direction along which there are more straight lines. The Radon transform along this direction usually has larger variations. Therefore, the variance of the projection at this direction is locally maximum.
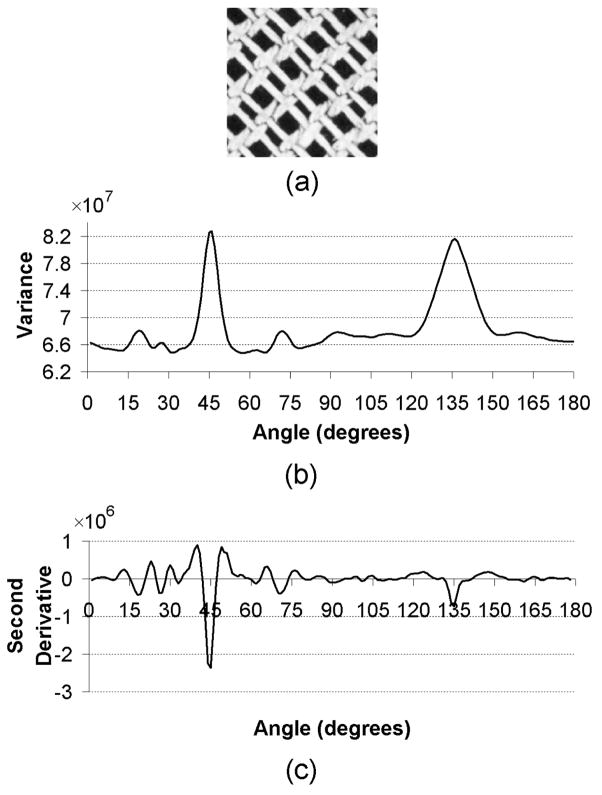
Fig. 1 (a) and (b) show an anisotropic (directional) texture and the variance of the projections along different orientations. A disk shape area from the middle of the image has been selected before calculating the Radon transform to make the method isotropic. As shown, the variance of the projections has two local maxima at 45° and 135° (with vertical direction at 0°). The local maximum at 45° is narrower compared with the local maximum at 135°, because there are more straight lines along 45°. To distinguish between these two local maxima, we may calculate the second derivative1 of the variance, which has its minimum at 45°. This is depicted in Fig. 1(c). This technique may accurately find the texture direction for structural textures like the one shown in Fig. 1. Furthermore, since taking the derivative removes the low frequency components of the variance, this method is robust to illumination changes across the image. This method has an advantage over techniques that use the contributions of all frequencies in the Fourier domain [13],[14]. In practice, the angular energy distribution may change significantly in a texture. Therefore, it is not always reliable to find the dominant orientation using the contributions of all frequencies [11].
Fig. 1.
(a) A directional texture rotated at 45°, (b) variance of projections at different angles, (c) second derivative of (b). Note that the variance of the projections has two local maxima at 45° and 135° (with vertical direction at 0°). The local maximum at 45° is narrower compared with the local maximum at 135°, because there are more straight lines along 45°.
Having the texture direction, we adjust the orientation of the texture for feature extraction. Analyzing textures along their principal directions allows creation of features with smaller intra-class variability, thus allowing higher separability. The rest of the paper is organized as follows: In Section III, we present our rotation invariant texture classification approach. Experimental results are presented in Section IV and conclusions are given in Section V.
III. Proposed Method for rotation invariant texture classification
Fig. 2 shows a block diagram of the proposed method. As shown, the principal direction of the image is first estimated from the Radon transform of a disk shape area of the image. The image is then rotated to move the principal direction to 0°. A wavelet transform is employed to extract texture features. The image is finally classified using a k-NN classifier. In the following, these steps are explained.
Fig. 2.
Block diagram of the proposed rotation invariant texture classification technique.
A. Orientation Adjustment
To estimate the orientation of the texture, a disk shape area is selected in the center of the image. The Radon transform is calculated for angles between 0° and 180°. Based on the theory presented in Section II, the orientation of the texture is estimated as follows.
| (2) |
where is the variance of the projection at θ. Then we rotate the image by −α to adjust the orientation of the texture.
B. Wavelet Feature Extraction and Classification
By applying the wavelet transform to the rotated image, a number of subbands are produced. For each subband I(l,s), we calculate the following features:
| (3) |
| (4) |
where , M and N are the dimensions of each subband, l is the decomposition level, and s represents the subband number within the decomposition level l. Feature shows the amount of signal energy in a specific resolution, while shows the non-uniformity of the subband values. Note that the wavelet transform is calculated for a disk shape area of the image. The sharp edges of its circular boundary affect the wavelet features. But since this is the case for all the images, it has equal effect for all the texture features in each class. Therefore, it does not have significant impact on the classification.
We use the k-nearest neighbors (k-NN) classifier for classification as explained in [8]. The features are normalized before classification using f̂i, j =(fi, j−μj)/σj where fi, j is the jth feature of the ith image, and μj and σj are the mean and variance of the feature j in the training set. To select the best features and improve the classification, we apply weights to the normalized features as proposed in [8]. The weight for each feature is calculated as the correct classification rate in the training set (a number between 0 and 1) using only that feature and leaving-one-out technique. This is because features with higher discrimination power deserve higher weights.
The proposed method to estimate the principal direction is robust to additive noise as described in [11]. There is also a fast technique for orientation estimation using the polar Fourier transform which is equivalent to the proposed method using the Radon transform which is presented in [11].
IV. Experimental Results
We demonstrate the efficiency of the proposed approach using three data sets. Data set 1 consists of 25 texture images of size 512×512 from Brodatz album [16] used in [2]. We divided each texture image into four 256×256 nonoverlapping regions. Then, we extracted one 128×128 subimage from the middle of each region to create a training set of 100 (25×4) images. To create the test set, each 256×256 region was rotated at angles 10° to 160° with 10° increments and from each rotated image one 128×128 subimage was selected (the subimages were selected off center to make minimum overlap for different angles). With this approach, we created a total number of 1600 (25×4×16) for the testing set (approximately 6% for training and 94% for testing).
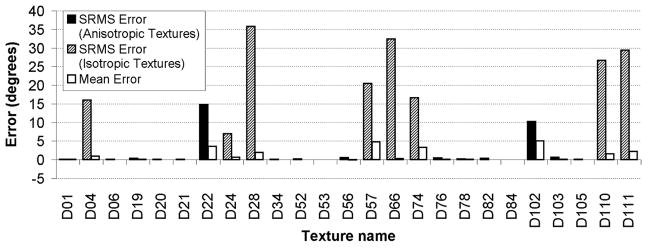
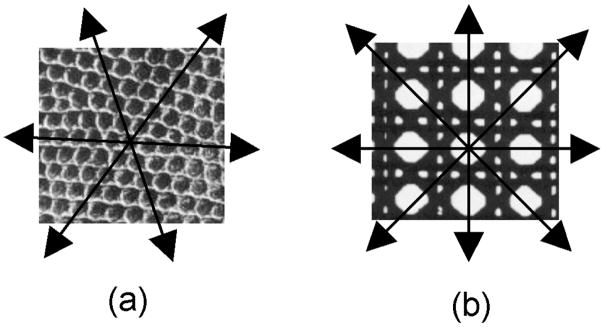
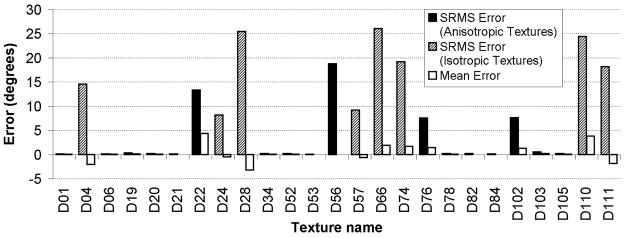
In the experiments, to estimate the principal direction we calculate the Radon transform for angles 0° to 180° with 0.5° increments. Fig. 3 shows the error mean and square root of mean square (SRMS) error of the direction estimation for each texture in the testing set. The error is defined as the difference between the estimated orientations of each two successive rotated textures (which is supposed to be 10°) minus 10. The estimated errors are corrected based on the fact that few textures like D21 have two symmetric principal directions with 90° difference (either of them is correct). The SRMS of error for directional and isotropic textures are displayed as solid and dashed bars, respectively. The mean values of the errors are shown by white bars. As shown, the error power is large for the isotropic textures. However, this error does not affect the classification rate, since as mentioned earlier, the extracted wavelet features do not change significantly when an isotropic texture is rotated. On the other hand, the errors for the directional textures are significantly smaller than those for the isotropic textures. Moreover, note that the estimated error is higher than the real error because sometimes the texture direction changes within the texture pattern (e.g. D22, D103, and D105). Except for D22 and D102, the error is very low (less than 1°) for directional textures. The reason D22 has high error is that it has three symmetric principal directions (see Fig. 4 (a)). Similarly, D102 has two non-symmetric principal directions (see Fig. 4 (b)). We can also observe that the error mean is small for most of the textures, which means the estimation method is unbiased for most of the textures.
Fig. 3.
The SRMS and means of estimation errors. Note that except for D22 and D102, the errors are very small (less than 1°) for the directional textures.
Fig. 4.
The textures (a) D22 and (b) D102 which have multiple principal directions.
Using the proposed method, we calculated the wavelet features for the training and testing images. For data set 1, we used four levels of ordinary wavelet decomposition with Daubechies wavelet bases of lengths 4 and 6 (db4 and db6). The three most high-resolution subbands were ignored as they were dominated by noise (since most of the signal power is located in the lower resolutions). Thus, the features were calculated from 10 subbands. A k-NN classifier was employed to classify each texture based on the extracted features. The classification results are presented in Table 1. The results are reported for different k values in the k-NN classifier before and after applying the weights to the features. As shown, applying the weights has generated higher improvement on e2 compared with e1. The best classification rate is 98.8% using 20 features after applying the weights, compared with the maximum of 93.8% in [2] using 64 features. Nevertheless, a direct comparison between the results of our proposed method and the method presented in [2] is not possible due to the difference between the classifiers. A Mahalanobis classifier is used in [2], with all the images at different orientations for both training and testing, while we used the images at 0° for training (6%) and all the other orientations for testing (94%). Using db6 wavelet, we even get 98.6% using only 10 features. Table 2 shows the confusion map when we have the maximum of 98.8% classification rate in Table 1. In this table, only the textures with non-zero error are shown.
Table 1.
The correct classification percentages for data set 1 using the proposed method with two wavelet bases, different feature sets, and different k values for k-NN classifier.
| Wavelet Bases |
k |
||||||
|---|---|---|---|---|---|---|---|
| Features | 1 | 3 | 5 | 1 | 3 | 5 | |
| Before Weight | After Weight | ||||||
| db4 | e1 | 96.4 | 96.8 | 90.8 | 96.1 | 97.1 | 88.6 |
| e2 | 76.3 | 69.3 | 68.0 | 79.7 | 75.1 | 70.3 | |
| e1 & e2 | 97.5 | 97.3 | 92.9 | 97.8 | 98.2 | 92.4 | |
|
| |||||||
| db6 | e1 | 98.2 | 95.8 | 89.1 | 98.6 | 97.5 | 88.8 |
| e2 | 66.2 | 57.1 | 57.4 | 69.9 | 64.6 | 62.5 | |
| e1 & e2 | 96.7 | 94.3 | 89.3 | 98.8 | 98.1 | 92.1 | |
Table 2.
The confusion map for the maximum classification rate of 98.8% in Table 1. To minimize the table size, textures classified 100% correctly are not listed.
| D04 | D20 | D24 | D52 | D76 | D111 | |
|---|---|---|---|---|---|---|
| D04 | 63 | 1 | ||||
| D20 | 63 | 1 | ||||
| D24 | 14 | 50 | ||||
| D52 | 61 | 3 |
In Table 3, we have also presented the classification rates using two alternative methods: (1) local binary patterns ( features) [9] and k-NN classifier, and (2) the proposed method in [8] using db2 wavelet. As shown, the maximum classification rates for these methods are 88.9% and 92.1% compared with the maximum of 98.8% with the proposed method.
Table 3.
The correct classification percentages for data set 1 using local binary patterns and the method proposed in [8] with different k values in the k-NN classifier.
|
k |
||||||||
|---|---|---|---|---|---|---|---|---|
| Feature | P,R | 1 | 3 | 5 | 1 | 3 | 5 | |
| Before Weight | After Weight | |||||||
|
|
8,1 | 40.8 | 38.9 | 36.0 | 44.9 | 43.7 | 41.8 | |
| 16,2 | 81.6 | 80.3 | 72.6 | 83.0 | 82.4 | 75.9 | ||
| 24,3 | 88.6 | 86.9 | 83.1 | 88.9 | 87.9 | 83.9 | ||
|
| ||||||||
| 8,1+16,2 | 76.4 | 72.8 | 65.3 | 82.4 | 77.9 | 71.2 | ||
| 8,1+24,3 | 87.3 | 86.7 | 82.1 | 88.1 | 88.3 | 83.6 | ||
| 16,2+24,3 | 87.3 | 87.3 | 81.8 | 87.8 | 87.9 | 83.1 | ||
|
| ||||||||
| 8,1 + 16,2+24,3 | 86.5 | 85.8 | 81.2 | 88.0 | 88.6 | 82.6 | ||
|
| ||||||||
| Proposed method in [8] with db2 wavelet | e1 | 90.4 | 86.3 | 81.6 | 90.1 | 86.3 | 79.0 | |
| e2 | 56.9 | 55.7 | 56.5 | 68.2 | 68.1 | 68.0 | ||
| e1 & e2 | 81.6 | 79.6 | 77.1 | 92.1 | 88.1 | 84.3 | ||
To evaluate the robustness of the direction estimation method to additive white noise, we compared the estimated directions before and after adding white Gaussian noise with SNR=0db. Defining the error as the difference between these two estimations, the means and SRMS of errors are displayed in Fig. 5. As shown, noise does not have significant effect on the orientation estimation of directional textures. The textures either multiple principal directions or weak staight lines that are significantly affected by the additive noise.
Fig. 5.
The SRMS and means of differences between the estimated orientations before and after adding white Gaussian noise with SNR=0db. The textures D19, D22, D56, D76 and D102 have higher errors compared with other directional textures due to either multiple principal directions or weak staight lines that are significantly affected by the additive noise.
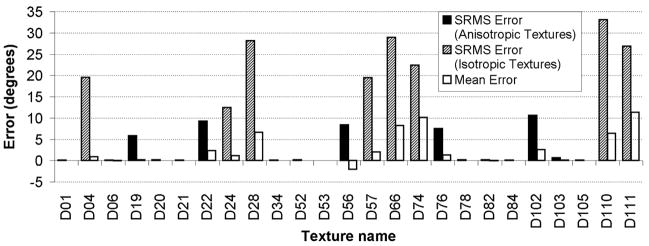
To evaluate the robustness of the proposed method to illumination, we changed the illuminations of the images by multiplying a 2-D Gaussian function shown in Fig. 6. The principal directions were estimated using the proposed method before and after changing the illumination. Defining the error as the difference between these two estimations, the means and SRMS of errors are presented in Fig. 7. As shown, the illumination does not have significant effect on the orientation estimation of directional textures. The textures D22, D56, D76 and D102 have larger errors due to either multiple principal directions or weak staight lines affected by illumination.
Fig. 6.
The 2-D Gaussian function for changing the illumination.
Fig. 7.
The SRMS and means of differences between the estimated orientations before and after changing the illumination. The textures D22, D56, D76 and D102 have larger errors compared with other directional textures due to either multiple principal directions or weak staight lines affected by illumination.
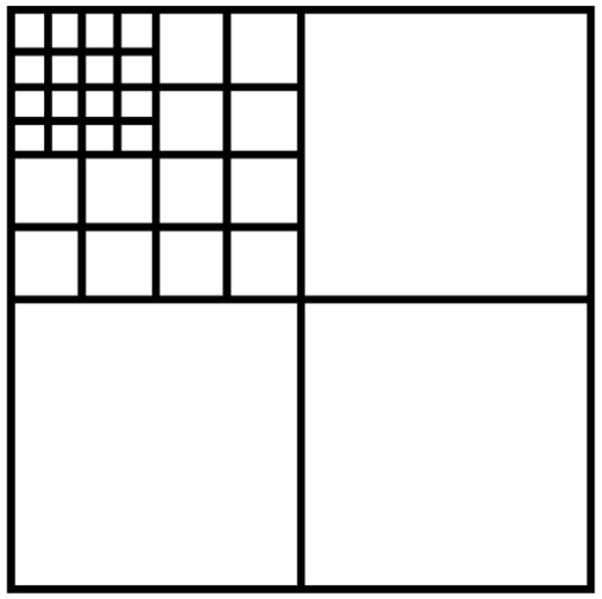
Data set 2 consists of 24 texture images used in [9]. These texture images are publicly available for experimental evaluation of texture analysis algorithms [17]. We used the 24-bit RGB texture images captured at 100 dpi spatial resolution and illuminant “inca” and converted them to gray-scale images. Each texture is captured at nine rotation angles (0°, 5°, 10°, 15°, 30°, 45°, 60°, 75°, and 90°). Each image is of size 538×716 pixels. Twenty nonoverlapping 128×128 texture samples were extracted from each image by centering a 4×5 sampling grid. We used the angle 0° for training and all the other angles for testing the classifier. Therefore, there are 480 (24×20) training and 3,840 (24×20×8) testing samples. The wavelet transform was calculated using the structure shown in Fig. 8. We ignored the HH submatrix of the first level of decomposition, since this subband corresponds to the highest resolution and mainly carries noise. Therefore 30 subbands were selected. Wavelet features were calculated for each subband using (3). Table 4 shows the error results using four different wavelet bases and different number of neighbors for k-NN classifier before and after applying the weights. As shown in this table, the maximum correct classification percentage (CCP) is 96.0%. The results using local binary pattern are presented in Table 5. As shown, the maximum classification rate is also 96.0% using 10+26=36 features. Ojala et al. [9] have achieved a classification rate of 97.9% in their experimental results. However, the total number of features they used is much greater than 30. A classification rate of 97.4% has been reported in [8] using the same data set and 32 features.
Fig. 8.
The wavelet decomposition structure for data set 2.
Table 4.
The correct classification percentages for data set 2 using the proposed method with feature e1, different wavelet bases, and different k values in k-NN classifier.
| Wavelet Bases | Features | k | |||||
|---|---|---|---|---|---|---|---|
| 1 | 3 | 5 | 1 | 3 | 5 | ||
| Before Weight | After Weight | ||||||
| db4 | e1 | 93.4 | 91.9 | 91.0 | 95.3 | 93.8 | 92.9 |
| db6 | e1 | 94.0 | 92.4 | 91.3 | 96.0 | 94.0 | 93.1 |
| db8 | e1 | 93.5 | 92.2 | 91.5 | 95.2 | 93.8 | 93.0 |
| db12 | e1 | 93.4 | 91.9 | 90.7 | 94.8 | 93.5 | 92.5 |
Table 5.
The correct classification percentages for data set 2 using local binary patterns and different k values in k-NN classifier.
|
k |
||||||||
|---|---|---|---|---|---|---|---|---|
| Feature | P,K | 1 | 3 | 5 | 1 | 3 | 5 | |
| Before Weight | After Weight | |||||||
|
|
8,1 | 74.0 | 73.8 | 73.3 | 73.4 | 72.3 | 71.7 | |
| 16,2 | 87.0 | 85.9 | 85.6 | 88.7 | 87.2 | 86.3 | ||
| 24,3 | 92.3 | 91.9 | 91.1 | 92.5 | 92.8 | 92.4 | ||
|
| ||||||||
| 8,1+16,2 | 88.9 | 88.1 | 87.3 | 90.3 | 89.1 | 88.6 | ||
| 8,1+24,3 | 96.0 | 95.7 | 94.9 | 95.8 | 95.8 | 95.3 | ||
| 16,2+24,3 | 94.3 | 93.8 | 92.8 | 95.6 | 94.8 | 94.4 | ||
|
| ||||||||
| 8,1 + 16,2+24,3 | 95.5 | 94.9 | 94.5 | 95.8 | 95.7 | 95.3 | ||
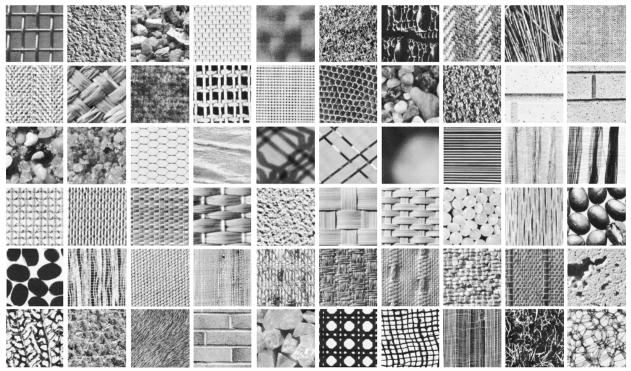
Data set 3 consists of 60 texture images of size 512×512 from the Brodatz album. These texture images are displayed in Fig. 9. The training and testing sets were created in the same way as for data set 1, yielding a total of 240 (60×4) images for training and 3,840 (60×4×16) images for testing (approximately 6% for training and 94% for testing). The experiments were also done as for data set 1. Table 6 shows the CCPs using db4 and db6 wavelet bases and different number of neighbors for the k-NN classifier. The results are reported before and after applying the weights on the features. As shown, the maximum CCP is 96.7%. Data set 3 contains most of the 15 textures used in [10] (except D29 and D69). A classification rate of 84.6% has been reported in [10] while different orientations of the textures have been used in the training phase. However, in our experiments only non-rotated textures have been used for training. Nevertheless, a direct comparison with the method in [10] is not possible due to the difference between the classifiers.
Fig. 9.
The 60 textures from the Brodatz album used in data set 3. First row: D01, D04, D05, D06, D08, D09, D10, D11, D15, D16. Second row: D17, D18, D19, D20, D21, D22, D23, D24, D25, D26. Third row: D27, D28, D34, D37, D46, D47, D48, D49, D50, D51. Fourth row: D52, D53, D55, D56, D57, D64, D65, D66, D68, D74. Fifth row: D75, D76, D77, D78, D81, D82, D83, D84, D85, D86. Sixth row: D87, D92, D93, D94, D98, D101, D103, D105, D110, D111.
Table 6.
The correct classification percentages for data set 3 using the proposed method with two wavelet bases, different feature sets, and different k values in k-NN classifier.
| Wavelet Bases |
k |
||||||
|---|---|---|---|---|---|---|---|
| Features | 1 | 3 | 5 | 1 | 3 | 5 | |
| Before Weight | After Weight | ||||||
| db4 | e1 | 89.3 | 83.9 | 77.2 | 92.2 | 86.1 | 74.7 |
| e2 | 64.9 | 55.5 | 57.4 | 68.4 | 59.4 | 60.4 | |
| e1&e2 | 94.4 | 90.1 | 85.8 | 96.7 | 93.2 | 85.4 | |
|
| |||||||
| db6 | e1 | 89.3 | 83.3 | 76.7 | 91.8 | 85.5 | 73.5 |
| e2 | 55.4 | 43.5 | 44.7 | 58.9 | 50.1 | 52.3 | |
| e1&e2 | 92.9 | 86.4 | 81.8 | 96.5 | 91.8 | 84.7 | |
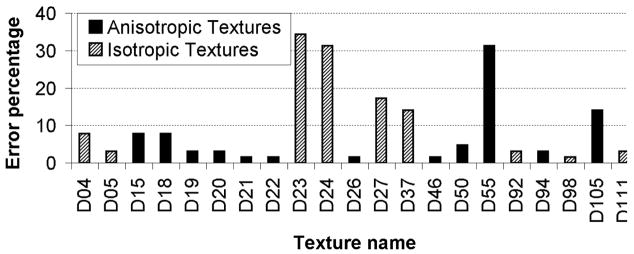
Fig. 10 shows the errors for the maximum classification rate of 96.7% in Table 6. To minimize its size, only the textures with non-zero error have been shown. Table 7 shows the classification rates using wavelet db4 features for the 20 isotropic textures from data set 3 (D04, D05, D09, D10, D23, D24, D27, D28, D37, D482, D57, D66, D74, D75, D86, D87, D92, D98, D110, and D111). Compared with Table 6, the classification rate is lower for the isotropic textures.
Fig. 10.
The errors for the maximum classification rate of 96.7% in Table 6. In this figure only the textures with non-zero error are shown.
Table 7.
The correct classification percentages for isotropic textures of data set 3 using the proposed method with db4 wavelet, different feature sets, and different k values in k-NN classifier.
| Wavelet Basis |
k |
||||||
|---|---|---|---|---|---|---|---|
| Features | 1 | 3 | 5 | 1 | 3 | 5 | |
| Before Weight | After Weight | ||||||
| db4 | e1 | 84.0 | 80.0 | 74.2 | 86.4 | 81.9 | 75.2 |
| e2 | 54.2 | 42.9 | 44.3 | 56.1 | 45.4 | 46.9 | |
| e1&e2 | 91.0 | 88.4 | 84.5 | 94.3 | 90.3 | 84.3 | |
V. Conclusion
We have introduced a new technique for rotation invariant texture analysis using Radon and wavelet transforms. In this technique, the principal direction of the texture is estimated using Radon transform and then the image is rotated to place the principal direction at 0°. Next, wavelet transform is employed to extract the features. The method for estimation of the principal direction is robust to additive white noise and illumination variations. We did a comparison with two of the most recent rotation invariant texture analysis techniques. Experimental results show that the proposed method is comparable to or outperforms these methods while using a smaller number of features.
Although the proposed method for principal direction estimation is suitable for most of the ordinary textures, more complex textures may need more complex techniques. For example, some textures may have straight lines along several directions. This may create ambiguity for the direction estimation. In this situation, more complex methods may be employed to estimate the direction. To make the method invariant to other geometric distortions, the second part of the method, i.e., the feature extraction method can be modified.
Acknowledgments
This work was supported in part by NIH grant R01 EB002450.
Footnotes
In this paper, the derivative of a signal is estimated by the difference of successive values.
For 128×128 images, D48 is non-directional.
References
- 1.Chen J-L, Kundu A. Rotation and gray scale transform invariant texture identification using wavelet decomposition and hidden Markov model. IEEE Trans Pattern Anal Machine Intell. 1994 Feb;16(2):208–214. [Google Scholar]
- 2.Pun CM, Lee MC. Log-polar wavelet energy signatures for rotation and scale invariant texture classification. IEEE Trans Pattern Anal Machine Intell. 2003 May;25(5):590–603. [Google Scholar]
- 3.Manthalkar R, Biswas PK, Chatterji BN. Rotation and scale invariant texture features using discrete wavelet packet transform. Pattern Recognition Letters. 2003;24:2455–2462. [Google Scholar]
- 4.Charalampidis D, Kasparis T. Wavelet-based rotational invariant roughness features for texture classification and segmentation. IEEE Trans Image Processing. 2002 Aug;11(8):825–837. doi: 10.1109/TIP.2002.801117. [DOI] [PubMed] [Google Scholar]
- 5.Haley GM, Manjunath BS. Rotation-invariant texture classification using a complete space-frequency model. IEEE Trans Image Processing. 1999;8(2):255–269. doi: 10.1109/83.743859. [DOI] [PubMed] [Google Scholar]
- 6.Wu WR, Wei SC. Rotation and gray-scale transform-invariant texture classification using spiral resampling, subband decomposition, and hidden Markov model. IEEE Trans Image Processing. 1996 Oct;5(10):1423–1434. doi: 10.1109/83.536891. [DOI] [PubMed] [Google Scholar]
- 7.Do MN, Vetterli M. Rotation invariant characterization and retrieval using steerable wavelet-domain hidden Markov models. IEEE Trans Multimedia. 2002 Dec;4(4):517–526. [Google Scholar]
- 8.Jafari-Khouzani K, Soltanian-Zadeh H. Rotation Invariant Multiresolution Texture Analysis Using Radon and Wavelet Transforms. IEEE Trans Image Processing. 2005 doi: 10.1109/tip.2005.847302. in Press. [DOI] [PMC free article] [PubMed] [Google Scholar]
- 9.Ojala T, Pietikainen M, Maenpaa T. Multiresolution gray-scale and rotation invariant texture classification with local binary patterns. IEEE Trans Pattern Anal Machine Intell. 2002 July;24(7):971–987. [Google Scholar]
- 10.Campisi P, Neri A, Panci G, Scarano G. Robust rotation-invariant texture classification using a model based approach. IEEE Trans Image Processing. 2004 June;13(6):782–791. doi: 10.1109/tip.2003.822607. [DOI] [PubMed] [Google Scholar]
- 11.Jafari-Khouzani K, Soltanian-Zadeh H. Radon transform orientation estimation for rotation invariant texture analysis. Henry Ford Health System; Detroit, MI: Tech. Rep. TR-0105, http://www.radiologyresearch.org/hamids.htm. [DOI] [PMC free article] [PubMed] [Google Scholar]
- 12.Mester R. Orientation estimation: conventional techniques and a new non-differential approach. Proc. 10th European Signal Proc. Conf.; 2000. pp. 921–924. [Google Scholar]
- 13.Bigun J, Granlund GH, Wiklund J. Multidimensional orientation estimation with applications to texture analysis and optical flow. IEEE Trans Pattern Anal Machine Intell. 1991 Aug;13(8):775–790. [Google Scholar]
- 14.Chandra DVS. Target orientation estimation using Fourier energy spectrum. IEEE Trans Aerosp Electron Syst. 1998 July;34(3):1009–1012. [Google Scholar]
- 15.Bracewell, Ronald N. Two-Dimensional Imaging. Englewood Cliffs, NJ: Prentice Hall; 1995. [Google Scholar]
- 16.Brodatz P. Texture: A Photographic Album for Artists and Designers. New York: Dover; 1966. [Google Scholar]
- 17.Ojala T, Mäenpää T, Pietikäinen M, Viertola J, Kyllönen J, Huovinen S. Outex - New framework for empirical evaluation of texture analysis algorithms. Proc. 16th Int. Conf. on Pattern Recognition; 2002. pp. 701–706. http://www.outex.oulu.fi. [Google Scholar]


