

Abstract
Background:
Neurodegeneration with brain iron accumulation (NBIA) defines a group of genetic disorders characterized by brain iron deposition and associated with neuronal death. The known causes of NBIA include pantothenate kinase-associated neurodegeneration (PKAN), neuroferritinopathy, infantile neuroaxonal dystrophy (INAD), and aceruloplasminemia.
Objective:
To define the radiologic features of each NBIA subtype.
Methods:
Brain MRIs from patients with molecularly confirmed PKAN (26 cases), neuroferritinopathy (21 cases), INAD (four cases), and aceruloplasminemia (10 cases) were analyzed blindly to delineate patterns of iron deposition and neurodegeneration.
Results:
In most cases of PKAN, abnormalities were restricted to globus pallidus and substantia nigra, with 100% having an eye of the tiger sign. In a minority of PKAN cases there was hypointensity of the dentate nuclei (1/5 on T2* sequences, 2/26 on fast spin echo [FSE]). In INAD, globus pallidus and substantia nigra were involved on T2* and FSE scans, with dentate involvement only seen on T2*. By contrast, neuroferritinopathy had consistent involvement of the dentate nuclei, globus pallidus, and putamen, with confluent areas of hyperintensity due to probable cavitation, involving the pallida and putamen in 52%, and a subset having lesions in caudate nuclei and thalami. More uniform involvement of all basal ganglia and the thalami was typical in aceruloplasminemia, but without cavitation.
Conclusions:
In the majority of cases, different subtypes of neurodegeneration associated with brain iron accumulation can be reliably distinguished with T2* and T2 fast spin echo brain MRI, leading to accurate clinical and subsequent molecular diagnosis.
GLOSSARY
- FSE
= fast spin echo;
- INAD
= infantile neuroaxonal dystrophy;
- NBIA
= neurodegeneration associated with brain iron accumulation;
- PKAN
= pantothenate kinase associated neurodegeneration;
- ROI
= region of interest.
Iron accumulates within the basal ganglia and dentate nuclei during normal aging.1 More intense iron deposition has been demonstrated within the substantia nigra in Parkinson disease, and structures affected by β amyloid plaques in Alzheimer disease, implicating iron deposition in the pathogenesis of common neurodegenerative diseases, possibly through increased oxidative stress.2,3 Direct evidence supporting a causal role for iron deposition in neurodegenerative conditions comes from a group of genetic disorders termed neurodegeneration with brain iron accumulation (NBIA), in which a variety of genetic defects in iron metabolism lead to brain iron accumulation with neuronal death in the affected brain regions.4
Four subtypes of NBIA have been defined at the molecular genetic level. Pantothenate kinase associated neurodegeneration (PKAN, NBIA type one, MIM 234200), formerly known as Hallervorden-Spatz syndrome, is caused by mutation of the pantothenate kinase 2 gene (PANK2).5 Infantile neuroaxonal dystrophy (INAD, MIM 256600) is a recessive disorder with psychomotor regression due to mutations in PLA2G6.6 Mutations of the ferritin light chain gene (FTL1) cause the adult onset autosomal dominant movement disorder neuroferritinopathy (FTL, NBIA type two, hereditary ferritinopathy, MIM 606159).7 A further form of NBIA is aceruloplasminemia (aCp, MIM 604290), an autosomal recessive ceruloplasmin deficiency which results in iron deposition in the reticuloendothelial system and brain, presenting with diabetes and an extrapyramidal movement disorder in adult life.8 Extensive phenotypic overlap presents a major challenge in the clinical diagnosis of different subtypes of NBIA, particularly in the early stages. Although molecular genetic testing can provide the definitive diagnosis, comprehensive testing is only available on a research basis, and the genetic defect remains undefined in a large subgroup of patients with so-called NBIA of unknown cause. A reliable clinical investigation capable of predicting the genetic diagnosis would be useful to inform genetic counseling, predict the disease course, and ensure appropriate enrollment in clinical trials of new treatments. Dramatic evidence of focal brain iron accumulation on brain imaging is usually the first indication of NBIA, but the features distinguishing the different subtypes have yet to be defined.
METHODS
MRI brain scans from 61 cases of NBIA were obtained from multiple centers across North America and Western Europe. Both gradient echo (T2*) and fast spin echo (FSE) sequences were examined. T2* sequences are highly sensitive for detection of brain iron while FSE is more frequently used in routine clinical practice. We compared T2* and FSE scans to evaluate whether T2* sequences permitted detection of iron deposition not seen on FSE. Scans from 26 cases of PKAN (5 with T2* images and T2 FSE images and 21 with T2 FSE images alone), 4 cases of INAD (2 with T2* images and 2 with T2 FSE), 21 cases of neuroferritinopathy (all with T2* images and T2 FSE images), and 10 cases of aceruloplasminemia were analyzed. For the aceruloplasminemia cases, original scans were available for one case and MRI images from a further 9 cases were obtained from case reports which were identified through a systematic review of the literature using keywords “aceruloplasminemia” and “acaeruloplasminaemia” on PubMed and Medline for the period 1990–2006.9–17 All cases were confirmed with a molecular genetic diagnosis. All of the neuroferritinopathy cases had the 460 InsA mutation of FTL1.
As this was a retrospective study, the scans were performed on different MR scanners with corresponding sequence parameters. The scans were analyzed by a single radiologist, blind to the molecular diagnosis. It was not possible to blindly analyze the aceruloplasminemia scans obtained from case reports. A subset of scans was reviewed by a second radiologist for validation. Regions of interest (ROIs) were scored as hypointense, isointense, or hyperintense. The ROIs examined were dentate nucleus, substantia nigra, globus pallidus, putamen, caudate, thalamus, and cerebral cortex. Scans were also scored for presence of an eye of the tiger sign, defined as an area of central hyperintensity surrounded by hypointensity centered on the globus pallidus.
RESULTS
For the PKAN cases, 14 were male and 12 were female, aged 2–41 years, mean age 10 years. The INAD cases were two boys and two girls, aged 5–10 years, mean 8 years. Of the neuroferritinopathy cases, 9 were men and 12 were women, aged 32–69 years, mean 52 years. The aceruloplasminemia cases were five men and five women, aged 27–72 years, with a mean age of 51 years.
The radiologic features of each disorder are summarized in the table. On T2* imaging, PKAN was associated with an eye of the tiger sign involving the globus pallidus (5/5, 100%), hypointensity of the substantia nigra (4/5, 80%) and dentate nucleus (1/5, 20%) (figure 1A). In INAD, T2* demonstrated hypointensity of globus pallidus (2/2, 100%), dentate nuclei (2/2, 100%), and substantia nigra (2/2, 100%) (figure 1B). In neuroferritinopathy, T2* showed widespread hypointensity in the cerebral cortex (15/21, 71%), globus pallidus (8/21, 38%), putamen (6/21, 28%), caudate nuclei (3/21, 14%), thalamus (4/21, 19%), substantia nigra (17/21, 81%), and dentate nuclei (20/21, 95%) (figure 1C). In 52% (11/21) of neuroferritinopathy cases the globus pallidus and putamen were involved by a confluent area of hyperintensity with a rim of peripheral hypointensity. This hyperintense area is likely to be due to fluid within an area of cystic degeneration, as autopsy of advanced neuroferritinopathy cases has demonstrated cystic degeneration of the putamena and pallida with fluid accumulation within the cysts. Thus the neuroferritinopathy T2* scans fell into two groups: one (10/21, 48%) with hypointensity of the basal ganglia nuclei and a second group (11/21, 52%) with confluent hyperintensity (probable cavitation) of pallida and putamen with hypointensity of substantia nigra and dentate nuclei. In two cases of neuroferritinopathy there was an eye of the tiger sign indistinguishable from that seen in PKAN (figure 2). In aceruloplasminemia, the pattern of iron deposition on T2* scans was similar to that in neuroferritinopathy, involving cerebral cortex (4/4, 100%), globus pallidus (4/4, 100%), putamen (4/4, 100%), caudate (4/4, 100%), thalamus (4/4, 100%), dentates (4/4, 100%), substantia nigra (4/4, 100%), and cerebellar cortex (2/4, 50%) (figure 1D).
Table T2 (gradient echo) and fast spin echo (FSE) MR brain images in neurodegeneration with brain iron accumulation (NBIA)
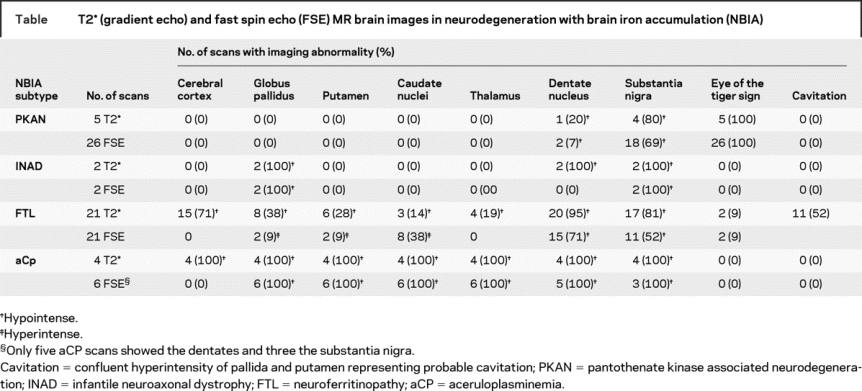
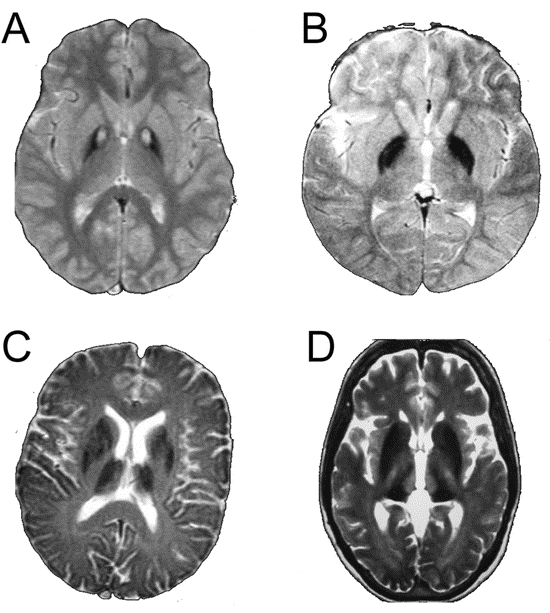
Figure 1 T2 gradient echo images
(A) T2* MRI scan from 17-year-old boy with pantothenate kinase associated neurodegeneration. Note bilateral eye of the tiger sign in globus pallidus. (B) T2* MRI scan from 9-year-old girl with infantile neuroaxonal dystrophy. Note bilateral hypointensity of globus pallidus. (C) T2* MRI scan from a 69-year-old woman with neuroferritinopathy. Note hypointensity of globus pallidus, putamen, caudate, and thalamus. (D) T2* MRI scan from a 55-year-old man with aceruloplasminemia. Note hypointensity of globus pallidus, putamen, caudate, and thalamus.
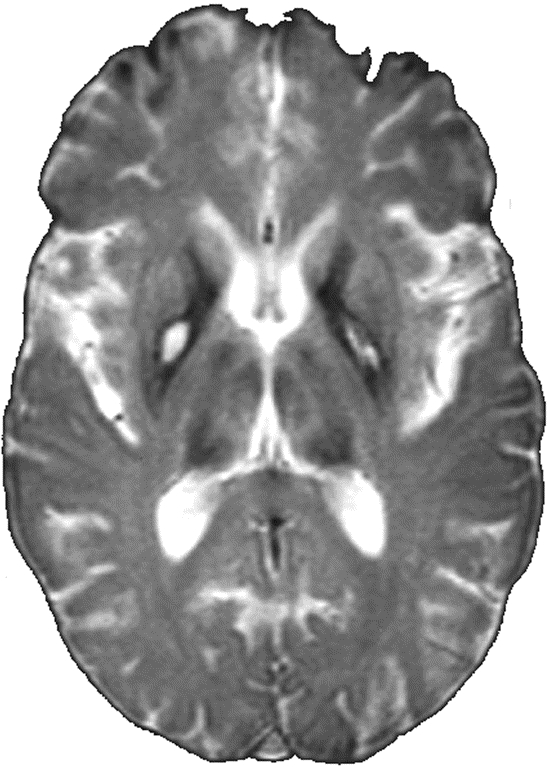
Figure 2 T2 gradient echo image of a 45-year-old woman with neuroferritinopathy
Note bilateral eye of the tiger sign in globus pallidus and thalamic hypointensity.
T2-FSE scans in PKAN demonstrated an eye of the tiger sign in globus pallidus (26/26, 100%), with hypointensity of substantia nigra (18/26, 69%) and dentate nuclei (2/26, 7%) (figure 3A). In T2 FSE scans of INAD the globus pallidus was hypointense (2/2, 100%) with 100% having nigral hypointensity (figure 3B). In neuroferritinopathy, 9% (2/21) had small areas of hyperintensity within the globus pallidus and putamen while 38% (8/21) had areas of increased signal in the caudate. Hypointensity of dentates (15/21, 71%) and substantia nigra (11/21, 52%) was also observed. In 52% (11/21) of neuroferritinopathy cases the globus pallidus and putamen were involved by a confluent area of hyperintensity with peripheral hypointensity, as described above; this is likely to be due to cystic degeneration (figure 3C). The neuroferritinopathy FSE scans fell into two groups: one (10/21, 48%) with small areas of hyperintensity within pallida, putamen, and caudates with hypointensity of substantia nigra and dentates, while the second group (11/21, 52%) had confluent hyperintensity (probable cavitation) of pallida and putamen with hypointensity of substantia nigra and dentate nuclei. On T2-FSE of aceruloplasminemia, hypointensity of dentates (5/5, 100%), substantia nigra (3/3, 100%), globus pallidus (6/6, 100%), putamen (6/6, 100%), caudates (6/6, 100%), and thalamus (6/6, 100%) was observed (figure 3D). In general, iron deposition on T2* sequences was observed to be more widespread than that on FSE. For example, cortical and thalamic iron deposition in FTL was observed on T2* but not FSE, while iron deposition in the putamen, dentate, and substantia nigra in FTL was more frequently observed on T2* than FSE.
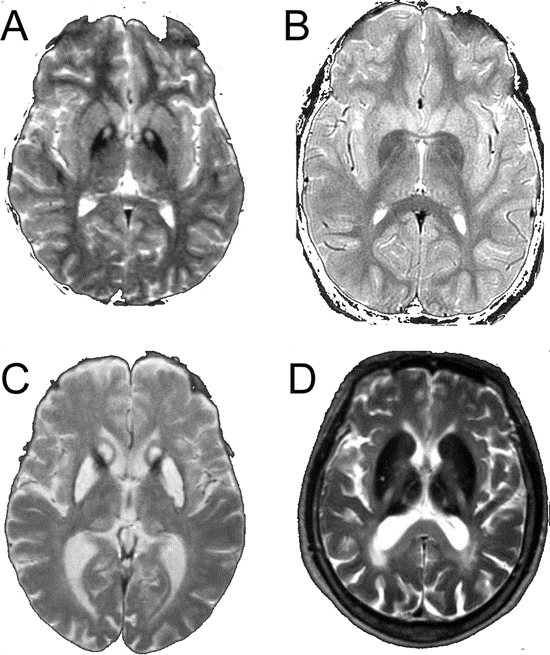
Figure 3 Fast spin echo (FSE) images
(A) FSE from 17-year-old boy with pantothenate kinase associated neurodegeneration. Note bilateral eye of the tiger sign in globus pallidus. (B) FSE from 9-year-old girl with infantile neuroaxonal dystrophy. Note bilateral hypointensity of globus pallidus. (C) FSE from a 60-year-old woman with neuroferritinopathy. Note hyperintensity of caudates with confluent hyperintensity of globus pallidus and putamen. (D) FSE from a 55-year-old woman with aceruloplasminemia. Note hypointensity of globus pallidus, putamen, caudates, and thalami.
DISCUSSION
The core imaging features that distinguish the different subtypes of NBIA are summarized in figure 4. Although the appearances of INAD were similar to PKAN, neuroferritinopathy was different on both T2* and FSE scans. In the majority of PKAN cases abnormalities were restricted to globus pallidus and substantia nigra, with all having an eye of the tiger sign, although this was subtle in some mildly affected cases. A minority of PKAN cases also had involvement of the dentate nuclei (1/5 on T2* and 2/26 on FSE). In INAD hypointensity of globus pallidus and substantia nigra was seen in all cases, with dentate hypointensity only on T2*. By contrast, in neuroferritinopathy the globus pallidus, putamen, and dentate nuclei were consistently involved with lesions of caudates or thalami in a subset, and confluent hyperintensity of the globus pallidus and putamen, probably due to cystic degeneration, in approximately half of the cases studied. The iron deposition in aceruloplasminemia had a comparable distribution to that in neuroferritinopathy, but in aceruloplasminemia all basal ganglia nuclei and thalami were simultaneously involved on T2* and FSE sequences, while in neuroferritinopathy only 3/21 (15%) had all nuclei involved, and thalamic abnormalities were not seen on FSE scans. A further distinguishing feature was the lack of areas compatible with cystic degeneration in aceruloplasminemia. The comparison of T2* and FSE scans suggests that T2* sequences are more sensitive for demonstration of brain iron accumulation, and that T2* should be the preferred imaging modality for NBIA diagnosis. The combination of hyperintense and hypointense abnormalities on NBIA scans probably results from iron deposition causing hypointense lesions in early disease with development of hyperintense lesions reflecting tissue edema and gliosis with disease progression.5 With the pathologic process progressing at different rates in different brain regions, there will be combined hypo- and hyperintense lesions on MRI.

Figure 4 Neuroimaging features distinguishing subtypes of neurodegeneration with brain iron accumulation
Although there were clear distinguishing features on brain MR imaging in most cases, there was a degree of overlap between neuroferritinopathy with PKAN (two cases) and neuroferritinopathy with aceruloplasminemia (three cases). An eye of the tiger sign, considered almost pathognomonic of PKAN,4 was observed in two cases of neuroferritinopathy (figure 2). The importance of this is reinforced by the fact that one of the original neuroferritinopathy cases was misdiagnosed with PKAN.7 Thus, an eye of the tiger sign must not be interpreted in isolation; scans should be scrutinized for involvement of other basal ganglia nuclei and cerebral cortex. Other routine clinical investigations such as serum ferritin may help clarify the diagnosis of neuroferritinopathy before molecular genetic testing, since serum ferritin is abnormally low in men and postmenopausal women with neuroferritinopathy but within normal limits in premenopausal women with neuroferritinopathy.18 Three cases of neuroferritinopathy had hypointensity of all basal ganglia nuclei on T2* scans resembling aceruloplasminemia. These cases had short disease durations (1–2 years), probably explaining why there were no hyperintense lesions as seen in more advanced disease. However, none had abnormal thalami on T2 FSE, clearly distinguishing them from aceruloplasminemia. The MR images should therefore be interpreted in context of age and disease duration, which influence the clinical and radiologic picture. Uncertainty may be resolved by repeat imaging after a 3–5-year interval. For example, in two cases of neuroferritinopathy, hyperintense areas probably representing cystic degeneration developed on scans repeated 18–24 months after initial imaging, permitting distinction from aceruloplasminemia. However, while areas compatible with cavitation were not observed in the PKAN, INAD, and aceruloplasminemia cases in this study, the possibility that cystic degeneration may develop in advanced cases of these conditions cannot be excluded and this must be taken into consideration when evaluating NBIA scans in clinical practice.
While we have focused on the imaging features of inherited causes of brain iron accumulation, there are several other disorders associated with hypointensities on brain T2* images. In beta–thalassanemia major,19 HIV,20 and Wilson disease,21 T2* hypointensities of the globus pallidus, caudate nuclei, and putamen have been described. In thalassanemia this results from iron overload, while in HIV it may reflect iron released from injured cells, and the imaging features in Wilson disease are due to the paramagnetic properties of copper. The clinical context will permit ready distinction of the NBIA disorders described here from these non-genetic conditions. Furthermore, it is important to note that the eye of the tiger sign can be seen in non-NBIA conditions such as corticobasal degeneration and progressive supranuclear palsy, and these should be considered in the differential diagnosis when appropriate.22–24
The substantia nigra, dentate nuclei, and globus pallidus are iron-rich structures in the normal brain, rendering them selectively vulnerable to neurodegeneration associated with iron deposition.1 This pattern is reflected in the imaging findings of neuroferritinopathy and aceruloplasminemia, where iron deposition is a primary phenomenon through disruption of ferritin or loss of ferroxidase activity, leading to iron deposition and subsequent neurodegeneration in all of the iron rich neuronal structures targeted in the aged brain. By contrast, in PKAN and INAD the iron is limited to the globus pallidus, substantia nigra, and, occasionally, dentate nuclei. Even in advanced cases of PKAN and INAD, we saw no evidence of iron accumulation in other structures, in keeping with the view that the iron deposition is secondary to the primary metabolic defect. Precisely why some iron-rich structures remain unaffected has yet to be established. Paradoxically, the unaffected basal ganglia in PKAN and INAD may provide the clue to developing neuroprotective agents for all forms of NBIA.
Address correspondence and reprint requests to Dr. Patrick F. Chinnery, The Medical School, Framlington Place, Newcastle upon Tyne, NE2 4HH, UK p.f.chinnery@ncl.ac.uk
P.F.C. is a Wellcome Trust Senior Fellow in Clinical Science who also receives funding from the United Mitochondrial Diseases Foundation, the PD Society (UK), and the EU FP program EUmitocombat and MITOCIRCLE. This work was also supported by grants to S.J.H. from the National Institute of Child Health and Human Development, the National Eye Institute, L’Association Internationale De Dystrophie Neuro Axonale Infantile, and the NBIA Disorders Association, with additional support from the Oregon Clinical and Translational Research Institute (OCTRI), grant number UL1 RR024140 01 from the National Center for Research Resources (NCRR), a component of the NIH, and NIH Roadmap for Medical Research.
Disclosure: The authors report no conflicts of interest.
Received August 1, 2007. Accepted in final form January 7, 2008.
REFERENCES
- 1.Gelman N, Gorell JM, Barker PB, et al. MR imaging of human brain at 3.0 T: preliminary report on transverse relaxation rates and relation to estimated iron content. Radiology 1999;210:759–767. [DOI] [PubMed] [Google Scholar]
- 2.Gerlach M, Double KL, Youdim MB, Riederer P. Potential sources of increased iron in the substantia nigra of parkinsonian patients. J Neural Transm Suppl 2006;70:133–142. [DOI] [PubMed] [Google Scholar]
- 3.House MJ, St Pierre TG, Kowdley KV, et al. Correlation of proton transverse relaxation rates (R2) with iron concentrations in postmortem brain tissue from Alzheimer’s disease patients. Magn Reson Med 2007;57:172–180. [DOI] [PubMed] [Google Scholar]
- 4.Hayflick SJ. Neurodegeneration with brain iron accumulation: from genes to pathogenesis. Semin Pediatr Neurol 2006;13:182–185. [DOI] [PubMed] [Google Scholar]
- 5.Hayflick SJ, Westaway SK, Levinson B, et al. Genetic, clinical, and radiographic delineation of Hallervorden-Spatz syndrome. N Engl J Med 2003;348:33–40. [DOI] [PubMed] [Google Scholar]
- 6.Morgan NV, Westaway SK, Morton JEV, et al. PLA2G6, encoding a phospholipase A2, is mutated in neurodegenerative disorders with high brain iron. Nat Gen 2006;38:752–754. [DOI] [PMC free article] [PubMed] [Google Scholar]
- 7.Curtis ARJ, Fey C, Morris CM, et al. Mutation in the gene encoding ferritin light polypeptide causes dominant adult-onset basal ganglia disease. Nat Gen 2001;28:350–354. [DOI] [PubMed] [Google Scholar]
- 8.Harris ZL, Takahashi Y, Miyajima H, et al. Aceruloplasminemia: molecular characterization of this disorder of iron metabolism. PNAS 1995;92:2539–2543. [DOI] [PMC free article] [PubMed] [Google Scholar]
- 9.Grisoli M, Piperno A, Chiapparini L. MR imaging of cerebral cortical involvement in aceruloplasminemia. AJNR Am J Neuroradiol 2005;26:657–661. [PMC free article] [PubMed] [Google Scholar]
- 10.Daimon M, Susa S, Ohizumi T, et al. A novel mutation of the ceruloplasmin gene in a patient with heteroallelic ceruloplasmin gene mutation. Tohoku J Exp Med 2000;191:119–125. [DOI] [PubMed] [Google Scholar]
- 11.Bosio S, De Gobbi M, Roetto A, et al. Anemia and iron overload due to compound heterozygosity for novel ceruloplasmin mutations. Blood 2002;6:2246–2248. [DOI] [PubMed] [Google Scholar]
- 12.Hatanaka Y, Okano T, Oda K, et al. Aceruloplasminemia with juvenile – onset diabetes mellitus caused by exon skipping in the ceruloplasmin gene. Intern Med 2003;42:599–604. [DOI] [PubMed] [Google Scholar]
- 13.l’Oreal O, Turlin B, Pigeon C, et al. Aceruloplasminemia: new clinical, pathophysiological and therapeutic insights. J Hepatol 2002;36:851–856. [DOI] [PubMed] [Google Scholar]
- 14.Miyajima H, Takahashi Y, Shimizu H, et al. Late onset diabetes mellitus in patients with hereditary aceruloplasminemia. Int Med 1996;35:641–645. [DOI] [PubMed] [Google Scholar]
- 15.Takeuchi Y, Yoshikawa M, Tsujino T, et al. A case of aceruloplasminemia: abnormal serum ceruloplasmin protein without ferroxidase activity. J Neurol Neurosurg Psychiatry 2002;72:543–545. [DOI] [PMC free article] [PubMed] [Google Scholar]
- 16.Perez-Aguiler F, Burguera JA, Benlloch S, Berenguer M, Rayon JM. Aceruloplasminemia in an asymptomatic patient with a new mutation. J Hepatol 2005;42:947–949. [DOI] [PubMed] [Google Scholar]
- 17.Okamoto N, Wada S, Oga T, et al. Hereditary ceruloplasmin deficiency with hemosiderosis. Hum Genet 1996;97:755–758. [DOI] [PubMed] [Google Scholar]
- 18.Chinnery PF, Crompton DE, Birchall D, et al. Clinical features and natural history of neuroferritinopathy caused by the FTL1 460InsA mutation. Brain 2007;130:110–119. [DOI] [PubMed] [Google Scholar]
- 19.Metafratzi Z, Argyropoulou MI, Kiortsis DN, et al. T2 relaxation rate of basal ganglia and cortex in patients with beta-thalassanemia major. Br J Radiol 2001;74:407–410. [DOI] [PubMed] [Google Scholar]
- 20.Miszkiel KA, Paley MN, Wilkinson ID, et al. The measurement of R2, R2* and R2′ in HIV infected patients using the prime sequence as a measure of brain iron deposition. Magn Reson Imaging 1997;15:1113–1119. [DOI] [PubMed] [Google Scholar]
- 21.Sudmeyer M, Saleh A, Wojtecki L, et al. Wilson’s disease tremor is associated with magnetic resonance imaging lesions in basal ganglia structures. Mov Disord 2006;21:2134–2139. [DOI] [PubMed] [Google Scholar]
- 22.Davie CA, Barker GJ, Machado C, et al. Proton magnetic resonance spectroscopy in Steele–Richardson–Olszewski syndrome. Mov Dis 1997;12:767–771. [DOI] [PubMed] [Google Scholar]
- 23.Molinuevo JL, Munoz E, Valldeoriola F, et al. The eye of the tiger sign in cortical-basal ganglionic degeneration. Mov Dis 1999;14:169–171. [DOI] [PubMed] [Google Scholar]
- 24.Kumar N, Boes CJ, Babovic-Vuksanovic D, Boeve BF. The “eye-of-the-tiger” sign is not pathognomonic of the PANK2 mutation. Arch Neurol 2006;63:292–293. [DOI] [PubMed] [Google Scholar]