

Abstract
Long-term potentiation of synapse strength requires enlargement of dendritic spines on cerebral pyramidal neurons. Long-term depression is linked to spine shrinkage. Indeed, spines are dynamic structures: they form, change their shapes and volumes, or can disappear in the space of hours. Do all such changes result from synaptic activity, or do some changes result from intrinsic processes? How do enlargement and shrinkage of spines relate to elimination and generation of spines, and how do these processes contribute to the stationary distribution of spine volumes? To answer these questions, we recorded the volumes of many individual spines daily for several days using two-photon imaging of CA1 pyramidal neurons in cultured slices of rat hippocampus between postnatal days 17 and 23. With normal synaptic transmission, spines often changed volume or were created or eliminated, thereby showing activity-dependent plasticity. However, we found that spines changed volume even after we blocked synaptic activity, reflecting a native instability of these small structures over the long term. Such “intrinsic fluctuations” showed unique dependence on spine volume. A mathematical model constructed from these data and the theory of random fluctuations explains population behaviors of spines, such as rates of elimination and generation, stationary distribution of volumes, and the long-term persistence of large spines. Our study finds that generation and elimination of spines are more prevalent than previously believed, and spine volume shows significant correlation with its age and life expectancy. The population dynamics of spines also predict key psychological features of memory.
Keywords: dendritic spine, synaptic plasticity, slice culture, memory, NMDA receptors, hippocampus
Introduction
The brain can store information by strengthening or weakening synaptic connections between neurons. This plasticity probably underlies learning and memory in the hippocampus and cortex (Harris et al., 2003; Malenka and Bear, 2004). Empirical and computational studies of synaptic plasticity assume that synapses get stronger or weaker in response to certain stimuli (Malenka and Bear, 2004) but otherwise stay the same, similar to memory elements in a computer. There are, however, two caveats in this commonly held view. First, although synaptic connections are some of the most stable products of cell adhesion, molecules in the synapse turn over within several hours (Okabe et al., 1999; Nakagawa et al., 2004; Gray et al., 2006; Honkura et al., 2008), meaning that synapses cannot avoid a certain degree of biological fluctuation. Second, if all synapses are “write enabled,” meaning they are capable of activity-dependent plasticity, then today's thoughts may overwrite yesterday's memories, causing them to decay quickly (Kasai et al., 2003; Fusi et al., 2005). This unresolved issue has been called the plasticity-stability dilemma (Abraham and Robins, 2005).
In the dendrites of pyramidal neurons, we and others have observed a tight structure–function relationship for excitatory synaptic connections made on spiny protrusions (Matsuzaki et al., 2001; Smith et al., 2003; Xie et al., 2005; Beique et al., 2006; Asrican et al., 2007). This is likely because larger spines have a greater postsynaptic density (PSD) (Harris and Stevens, 1989) that accumulates more AMPA-type glutamate receptors (so named because the receptors also respond to AMPA) (Nusser et al., 1998; Takumi et al., 1999). In addition, the number of synaptic veiscles in the presynaptic terminal is correlated with PSD area (Harris and Stevens, 1989; Knott et al., 2006). Thus, spine volume appears to be a good monitor for synaptic strength.
We are now able to study the plasticity and stability of synaptic connections over many days. If synaptic plasticity is truly long lasting, we expect it will be accompanied by structural plasticity. Indeed, the onset of long-term potentiation (LTP) is linked to spine-head enlargement (Matsuzaki et al., 2004; Okamoto et al., 2004; Otmakhov et al., 2004; Kopec et al., 2006; Honkura et al., 2008; Tanaka et al., 2008), and some dendritic spines in the cortex get bigger when animals experience a novel sensation (Holtmaat et al., 2006). At the same time, other spines remain stable for weeks (Grutzendler et al., 2002; Trachtenberg et al., 2002). This selective dynamism is not limited to juveniles, because new-spine creation and old-spine destruction continue well into adulthood (Zuo et al., 2005b).
Remarkably, the steady distributions of spine volumes are similar whether pyramidal neurons are studied in vivo or in vitro (Benavides-Piccione et al., 2002). No study, however, has yet answered a trio of important questions: Do changes in spine size exclusively reflect activity-dependent plasticity? How do changes in spine size relate to generation and elimination of spines? What determines the stationary distribution of spine sizes?
We sought to answer these questions by monitoring individual spines over a period of days. Using two-photon imaging of CA1 pyramidal neurons from rat hippocampal slices in culture, we observed that spine volumes fluctuate in both activity-dependent and -independent manners. These spine behaviors reflect the overall population dynamics, the proper understanding of which requires a mathematical model. Our study represents the most thorough characterization of spine dynamics to date and explains various spine behaviors and psychological features of memory.
Materials and Methods
Preparations.
Hippocampal slices with a thickness of 350 μm were prepared from 7-d-old Sprague Dawley rats, unless stated otherwise. Slices were mounted on 0.4 μm culture inserts (Millipore) and incubated at 35°C under 5% CO2 in medium composed of 50% MEM (Invitrogen), 25% HBSS (Invitrogen), 25% horse serum (Nichirei), glucose (6.5 g/L), penicillin (100 U/ml), and streptomycin (0.1 mg/ml). Approximately 60% of the culture medium was replaced every 3 d. After 6 d in vitro, slices were transfected using a Gene Gun system (PDS-1000; Bio-Rad) carrying a vector with the enhanced green fluorescent protein (eGFP) cDNA under the control of the chicken β-actin gene promoter and cytomegalovirus enhancer (pCX-EGFP; kindly provided by J. Miyazaki, Faculty of Medicine, Osaka University, Osaka, Japan). Four days after transfection (the equivalent of postnatal day 17), CA1 pyramidal neurons that expressed eGFP were identified, and dendritic imaging began. Most imaging experiments were performed on the equivalent of postnatal days 17–23. Each culture insert was transferred to a recording chamber and superfused with a solution that contained (in mm) 125 NaCl, 2.5 KCl, 1.8 CaCl2, 1.25 NaH2PO4, 1.3 MgCl2, 26 NaHCO3, and 20 glucose and was bubbled with 95% O2 and 5% CO2. All physiological experiments were performed at room temperature (23–25°C). The recording chamber and objective lens of the microscope were sterilized with ethanol before experiments. The culture insert was returned to the original medium and incubated again at 35°C after each imaging session.
To block activity-dependent plasticity mediated by NMDA channels, 50 μm d,l-2-amino-5-phosphonovaleric acid (APV; Tocris) and 20 μm (+)-5-methyl-10,11-dihydro-5H-dibenzo [a,d] cyclohepten-5,10-imine maleate (MK-801) (Tocris) were added to the culture medium at the onset of the observation period and every day thereafter. In some experiments, Na+ channels were blocked by adding 1 μm tetrodotoxin (TTX) (Nacalai Tesque), and Ca+ channels were blocked by adding 20 μm nimodipine (Tocris) for Cav1.2–1.3 (Kasai and Neher, 1992; Hille, 2001), 1 μm ωCTX-MVIIC (Peptide Institute) for Cav2.1 and 2.2 (McDonough et al., 2002), 0.3 μm SNX-482 (Peptide Institute) for Cav2.3 (Newcomb et al., 1998), and 10 μm mibefradil (Sigma) for Cav2.3 and Cav3.1–3.3 (Randall and Tsien, 1997; Bloodgood and Sabatini, 2007) to the culture medium (see Fig. 3). For those studies in which NMDA-sensitive glutamate receptor (NMDAR) inhibitors were added from the early stage of development (see Fig. 4), slices were prepared from 4- or 5-d-old rats and transfected with eGFP 3–6 d later, and imaging was started on the equivalent of postnatal days 10–14. These experiments were approved by the Animal Experiment Committee of the Faculty of Medicine, University of Tokyo.
Figure 3.

Spine dynamics in the presence of NMDAR inhibitors and TTX. A, B, Percentage (A) and absolute (B) changes in spine-head volume from hippocampal slices cultured in the presence of NMDAR inhibitors (APV and MK-801) and TTX. Data were obtained from 350 spines on eight dendrites. C, D, Percentage (C) and absolute (D) changes in spine-head volume from hippocampal slices cultured in the presence of additional inhibitors of VDCCs: nimodipine, ωCTX-MVIIC, SNX-482, and mibefradil. Data were obtained from 291 spines on seven dendrites.
Figure 4.

Spine generation in the continuous presence of NMDAR inhibitors. In a hippocampal slice cultured in the continuous presence of NMDAR inhibitors from postnatal day 4, when the tissue was isolated, the same dendritic region on the equivalents of postnatal day 10 (P10; A) and postnatal day 23 (P23; B) is shown.
Time-lapse imaging using two-photon excitation.
Each imaging session lasted for 10–20 min. Imaging was performed with an upright microscope (BX61WI; Olympus) equipped with a water-immersion objective lens (LUMFL 60×; numerical aperture 1.1) and a laser-scanning microscope system (FV1000; Olympus). Samples were illuminated with a mode-locked femtosecond-pulse Ti:sapphire laser (Chameleon; Coherent) set at a wavelength of 955 nm. The point-spread function of the focal volume was estimated using 0.1-μm-diameter fluorescent beads as 0.37 μm (full-width at half-maximum) laterally and 1.5 μm axially. Three-dimensional composites were made from a stack of 17–25 two-dimensional images, each separated by 0.5 μm. Each pixel in the composite had a value equal to the summed fluorescence of the stack at that position.
Estimation of spine-head volume and spine-neck length.
Spine-head volume (V) was estimated from the total fluorescence intensity (F) of the composite image of each spine with a head structure clearly separate from the dendritic shaft. A conversion coefficient, V/F, was derived from the fluorescence profile of the largest, most spherical spine on the dendrite during that period of observation, as described previously (Matsuzaki et al., 2001; Noguchi et al., 2005; Beique et al., 2006). This coefficient was applied to all data collected in that region during the 3–7 d recording period. To correct for day-to-day variation in the expression of eGFP, total fluorescence of the dendritic shaft was recorded for each sample on each day. Estimates of spine-head volume were corrected for this variation, which was usually <10% per day (range, 0.3–25%; mean ± SD, 9 ± 2%; n = 21). Such corrections were small relative to the percentage change in spine-head volumes (see Figs. 1B, 2B). The conversion coefficient (V/F) was used primarily to normalize eGFP expression levels between different slice preparations. The data from one dendrite (see Figs. 1B, 2B, green circles) were representative of the data from all dendrites (see Figs. 1B, 2B), indicating that the conversion was performed appropriately. Changes in spine volume are likely to represent biological phenomena rather than estimation errors, because small daily changes were detected in the fixed preparations (see Fig. 6F,G). In fact, the combination of intrinsic and activity-dependent fluctuations explained the distribution of spine-head volumes (see Fig. 8) and the elimination and generation of spines (see Fig. 10).
Figure 1.

Long-term changes in dendritic spines on CA1 pyramidal neurons in slice cultures under normal (control) conditions. A, Example of a time-lapse series of images for the same dendritic region on consecutive days. Numbers represent individual spines; red numbers represent newly generated spines, whereas the blue number represents a spine that was eliminated within the next day. The protrusions labeled f are filopodia. B, C, Percentage (B) and absolute (C) changes in spine-head volume (ΔV) per day. Data were obtained from 478 spines on 10 dendrites. Green symbols represent data from a single dendrite. The dashed line in C labeled V = 0 indicates eliminated spines. The quantity on the x-axis reflects the starting volume of the spine that was eliminated on the second day.
Figure 2.

Long-term changes in dendritic spines in the presence of NMDAR inhibitors. A, Example of a time-lapse series of images for the same dendritic region on consecutive days. Numbers represent individual spines; red numbers represent newly generated spines, whereas blue numbers represent spines that were eliminated within the next day. B, C, Percentage (B) and absolute (C) changes in spine-head volume (ΔV) per day. Data were obtained from 484 spines on 12 dendrites. Green symbols represent data from a single dendrite. The dashed line in C labeled V = 0 indicates eliminated spines.
Figure 6.
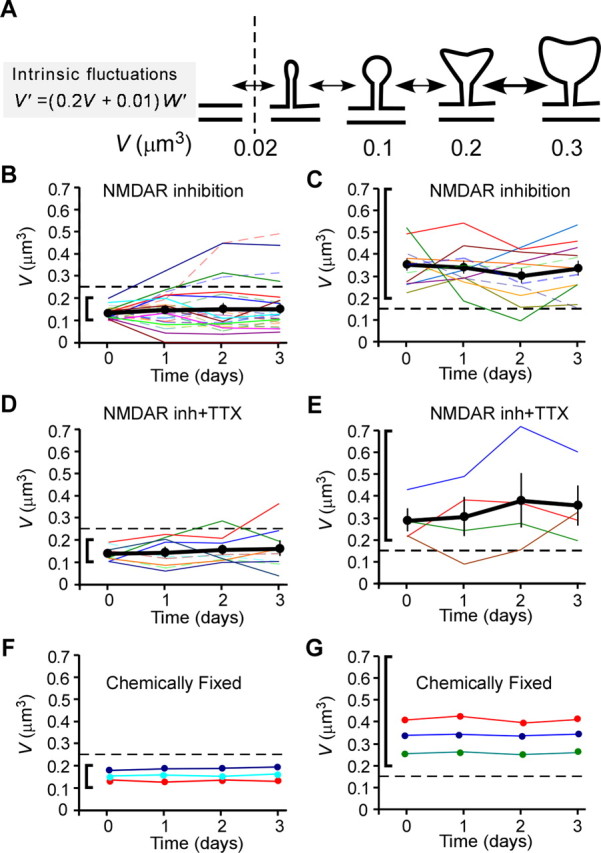
Fluctuations in head volume of individual spines. A, Scheme for transitions between spines with different volumes. The equation describes the model prediction I-1, as shown in Figure 5. Intrinsic fluctuations (black arrows) are greater for larger spines. The vertical dashed line indicates the smallest volume consistent with definition of a spine in the present study. B, D, Time courses of head-volume changes for medium-sized spines with initial volumes between 0.1 and 0.2 μm3 in the presence of NMDAR inhibitors (B) or NMDAR inhibitors plus TTX (D). C, E, Time courses of head-volume changes for large spines with initial volumes >0.2 μm3 in the presence of NMDAR inhibitors (C) or NMDAR inhibitors plus TTX (E). Data are shown for all spines successfully investigated on 3 consecutive days. The thick black traces are the average values for all spines in B–E. Vertical bars show SEM. No significant drift was detected. F, G, Similar plots as shown in B–D, but using a fixed preparation.
Figure 8.
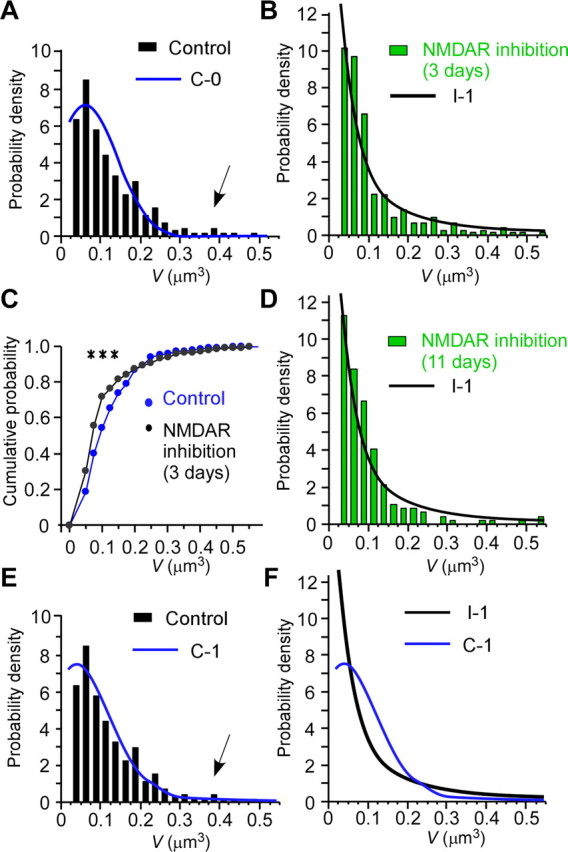
Steady-state distributions of spine-head volume. A, B, Probability–density distributions of spine-head volume for slice cultures incubated in the absence (A) or presence (B) of NMDAR inhibitors for 3 d. Smooth lines are theoretical curves predicted from the models C-0 and I-1, respectively. The arrow in A indicates deviation of the predicted values from the experimental values for certain large spines. C, Cumulative distributions of spine-head volumes in the absence or presence of NMDAR inhibitors; the distributions are derived from the data in A and B, respectively. The difference between the two conditions is significant (***p < 0.001, Smirnov test; n = 283 and 293 spines, respectively). D, Probability–density distribution of spine-head volume (n = 202 spines on six dendrites) at the equivalent of postnatal day 16 for preparations that had been continuously exposed to NMDAR inhibitors from the time of hippocampal isolation at postnatal day 5, when few spines are present (Fig. 4A). The black line is a theoretical curve predicted from model I-1. E, Probability–density distribution of spines as shown in A but fitted with the model C-1. The arrow indicates reduced deviation of the predicted and experimental values for certain large spines. F, Comparison of the theoretical probability–density distributions for models C-1 and I-1.
Figure 10.

Elimination and generation of spines. A, Elimination of spines per 1, 2, or 3 d in the absence or presence of NMDAR inhibitors. Data are means ± SEM from 10 to 12 dendrites. B, Dependence of spine elimination rate per day on spine-head volume in the absence or presence of NMDAR inhibitors; stars represent values for newly generated spines (n = 53 or 56 spines, respectively). Values did not differ significantly from those of the entire spine population under either condition (p > 0.6, χ2 test). Rates were determined from all data obtained within a range equivalent to postnatal days 17–22. C, Elimination rate per day of persistent spines that existed between day 0 and day i − 1 (i = 1 − 3). Data are means ± SEM, and the data set is the same as that in A. *p < 0.05; **p < 0.01, versus the corresponding value for day 1 (paired Student's t test). D, Probability–density distributions of newly generated spines that were absent on day 0 and present on day 1 in the absence (n = 83 spines; open circles) or presence (n = 83 spines; filled circles) of NMDAR inhibitors. Thin and thick theoretical lines in all panels were obtained from the models C-1 and I-1, respectively, as described in Appendix A.
Spine-neck length was measured as described previously (Noguchi et al., 2005). In brief, spine heads and dendritic shafts were fitted with Gaussian functions. Their full-width at half-maximal diameters were converted to predicted diameters to determine the boundaries of these structures. The length of the spine neck was defined as the distance between the edge of the head and the edge of the shaft.
Mean and variance of changes in spine-head volume.
The mean change in spine-head volume per day [μ(V)] and the SD of this change [σ(V)] were calculated using the following equations:
 |
 |
where each value of μ(V) and σ(V) represented a given experimental period (0 ≤ i ≤ 5 d) from spines (k = 1, 2,…) that had volumes of [Vk(i)] that were grouped into distinct ranges R1 = (0.02, 0.05), R2 = (0.05, 0.1), R3 = (0.1, 0.15), R4 = (0.15, 0.2), or R5 = (0.2, Vmax). Nj is the total number of spines satisfying Vk(i) ∈ Rj. Values of μ and σ were calculated for each dendrite, and the mean and SEM for 12 and 10 dendrites are shown in Figures 5 and 7, A and B, respectively. The statistical significance of differences in the values of μ and σ was determined with the unpaired Student's t test in Figure 7. Analysis of paired values from 10 or 12 dendrites with the paired Student's t test corrected for possible interdendrite variation in Figure 10C.
Figure 5.

Quantitative analysis of fluctuations in spine-head volume in the absence of activity-dependent plasticity. SD (σ) (A, C, E) and mean (μ) (B, D, F) of fluctuations in spine-head volume in the presence of NMDAR inhibitors (A, B), NMDAR inhibitors plus TTX (C, D), or NMDAR inhibitors plus TTX plus VDCC inhibitors (E, F) are shown. Each plotted point represents pooled data from many spines (Figs. 2C, 3B,D) with similar initial volumes. Vertical and horizontal error bars denote SEM and SD, respectively. Thick straight lines show model predictions for intrinsic fluctuations (I-1). Gray shaded areas represent contributions of intrinsic fluctuations.
Figure 7.

Quantitative analysis of fluctuations in spine-head volume under normal (control) conditions. A, B, SD (σ) (A) and mean (μ) (B) of fluctuations in spine-head volume in the presence of normal synaptic activity. Each plotted point represents pooled data from many spines (Fig. 1C) with similar initial volumes. Vertical and horizontal error bars denote SEM and SD, respectively. ***p < 0.001 (unpaired Student's t test), versus a corresponding value obtained in the presence of NMDAR inhibitors (Fig. 5A); *p < 0.05 (unpaired Student's t test), versus zero (B). Black and blue lines show model predictions for intrinsic fluctuations (black, I-1) and the control condition (light blue, C-0; dark blue, C-1; red, C-2). Gray and blue shaded areas indicate the contributions of intrinsic fluctuations and activity-dependent plasticity, respectively, to changes in spine-head volume. Filled squares in B correspond to spines with a neck length of >0.6 μm. C, Scheme for transitions between spines with different volumes. Activity-dependent plasticity (blue arrows) preferentially affects smaller spines. Activity-dependent shrinkage outcompetes activity-dependent enlargement in larger spines. The vertical dashed line indicates the smallest volume consistent with definition of a spine in the present study. V′ and W′ stand for the time derivative of V(t) and W(t), respectively. D, E, Time courses of head-volume changes for medium-sized spines with initial volumes between 0.1 and 0.2 μm3 (D) or with initial volumes >0.2 μm3 (E). The thick black traces are the average values for all spines. *p < 0.05; **p < 0.01, versus the corresponding value for day 0 (unpaired Student's t test).
As described previously, spine-head volume may fluctuate spontaneously in as little as 10 min (Fischer et al., 1998; Matsuzaki et al., 2004). In the recording conditions used for these experiments, the rapid fluctuation showed a coefficient of variation (CV) of 0.13. Despite the rapid fluctuations, the mean spine volume did not change over 3 h (data not shown). Furthermore, the time course of these rapid fluctuations was distinct from the time course of long-term fluctuations described elsewhere in this study. The rapid fluctuations are likely caused by treadmilling of actin within the dynamic pool of actin filaments (Honkura et al., 2008), whereas long-term fluctuations represent changes in the size of the PSD, which controls the dynamic and stable pools of actin fibers in a spine. The rapid fluctuations introduced some uncertainty to the current spine-volume measurements, but this uncertainty was predicted to have a small effect (<20%) on the estimates of the SD (σ) for long-term fluctuations, based on C-1 or I-1 parameters (Appendix A).
Results
Dynamics of spine structure in the presence of activity
To understand the behavior of dendritic spines in living tissues, we examined the dendrities of CA1 pyramidal cells in slices of rat hippocampus using two-photon imaging. The slices were maintained in culture, which allowed us to track the volumes of individual spines over several days. Biolistic transfection with a vector encoding eGFP enabled us to identify individual pyramidal neurons and make detailed measurements of the spines on those neurons (Fig. 1A). We began the experiments on the equivalent of postnatal day 17 and observed the same area daily for 4–7 d. It has been reported that synaptic properties in this type of preparation are similar to those found in vivo on the equivalent day (De Simoni et al., 2003) and that the intact circuit between CA3 and CA1 regions of the hippocampal slices preserves spontaneous activity in CA1 neurons (Lauri et al., 2003).
We chose to restrict our analysis to CA1 neurons in which the dendritic arbor remained unaltered during the experimental period, thereby ensuring that any changes in dendritic spines were not caused by gross alterations in dendritic structure. We did not examine headless protrusions (filopodia) or spines that had heads <0.02 μm3 (∼1.5% of spines) (Fig. 1A), because such filopodia-like structures are highly motile and seldom make synaptic contacts (Harris and Stevens, 1989; Fiala et al., 1998; Knott et al., 2006).
Compared with large spines, small spines were more plastic, often enlarging (Fig. 1A) (spines 1, 2, 4, 6, and 9), shrinking (spines 1, 3, 6, and 9), or being eliminated within 1 d (spine 3). Our observation that large spines were more stable than small spines (Fig. 1A, spine 7) was consistent with previous studies in vivo (Trachtenberg et al., 2002; Holtmaat et al., 2005; Zuo et al., 2005a). We also witnessed the generation of new spines within 1 d (Fig. 1A, spines 3 and 5). We describe our systematic analysis of the generation and elimination of spines in the latter part of this work (see Fig. 10).
We determined spine-head volume by measuring the total fluorescence of a three-dimensional composite image of the spine. We plotted changes in this value in terms of percentage difference [100% × (V1 − V0)/V0] (Fig. 1B) and in terms of absolute difference (V1 − V0) for more quantitative analysis (Fig. 1C). Overall, small spines showed the greatest changes percentage wise (Fig. 1B), but the absolute magnitude of such changes was modest, <0.1 μm3/d (Fig. 1C). Similar trends existed within a subset of these data (Fig. 1B,C, green circles) taken from spines found on a single dendrite. The presence of similar variability, in one dendrite and in many dendrites, supports the idea that this variability was not attributable to an error in the calibration of spine volume, because all observations of a given dendrite used the same parameter to convert fluorescence into volume (Materials and Methods). Spine-volume changes showed little relation to the behavior of neighboring spines (correlation coefficient between neighboring spines was 0.043 for 190 spines; p = 0.55). This volume measurement allowed us to study the time courses in volume changes (see Figs. 6, 7, 9) and stationary distribution of spine volumes (see Fig. 8) in later sections.
Figure 9.

Relevance of the diffusion approximation for spine dynamics. A, C, Relationship of changes in Wi between the two successive time intervals in the presence (A) or absence (C) of NMDAR inhibitors. The correlation coefficients were −0.004 (p = 0.969) and −0.189 (p = 0.054), respectively. Values of Wi were obtained as described in Appendix A (S11). B, D, Probability–density distributions of changes in Wi per 1 d in the presence (B) or absence (D) of NMDAR inhibitors.
Dynamics of spine structure in the absence of activity-dependent plasticity
To determine whether the changes in spine volume were caused by activity-dependent plasticity, we added two glutamate receptor inhibitors to the culture medium at the onset of imaging experiments. APV (50 μm) and MK-801 (20 μm) both inhibit NMDARs. Dendritic spines showed much less structural plasticity in the presence of these drugs (Fig. 2), and the changes that did occur were small (Fig. 2A, spines 1–11), as we quantitatively examine in Figure 7A. The decreased plasticity was evident in terms of relative (Fig. 2B) and absolute (Fig. 2C) changes in volume, especially for small spines. NMDAR inhibition also decreased the rate of spine elimination (8.0%) (Fig. 2A, spines 8 and 10) relative to controls (18.3%; p < 0.001) (Table 1), but the rate of spine generation was unaffected (14.0% vs 14.5%) (Table 1). Although APV and MK-801 reduced the elimination of spines, they did not stop it, and both destruction and creation of spines remained widespread.
Table 1.
Spine elimination and generation per day
| Condition | Spine elimination (%) | Spinegeneration (%) | Change in spine density (%) | Number of dendrites |
|---|---|---|---|---|
| Control | 18.3 ± 1.8 | 14.5 ± 1.9 | −3.8 ± 1.9 | 10 |
| APV + MK-801 | 8.0 ± 1.6* | 14.0 ± 2.0† | 6.0 ± 1.7 | 12 |
The numbers of spines that were eliminated or newly generated were counted in dendritic regions over 4–7 d. They are expressed as a percentage of the spine number on the preceding day. Data are means ± SEM for the number of dendritic regions indicated. Spine density tended to decrease or increase in the absence or presence of NMDAR inhibitors, respectively, consistent with the general trend for spine elimination during development and its blockade by NMDAR inhibitors (Zuo et al., 2005a). *p < 0.001; †p = 0.85 (not significant), versus corresponding value for the control condition (unpaired Student's t test).
Changes in spine volume followed a similar pattern: NMDAR inhibitors decreased the frequency and magnitude of volume changes, but did not prevent them, and spine volumes continued to fluctuate in the presence of these drugs (Fig. 2). The changes we observed under these conditions were associated with subtle alterations in spine morphology (Fig. 2A) and showed little relationship to the behavior of neighboring spines (correlation coefficient between neighboring spines was 0.039 for 234 spines; p = 0.55). This independence is consistent with a degree of randomness in spine behavior. Similar independence existed within a subset of these data (Fig. 2B,C, green circles) taken from spines found on a single dendrite. These changes in spine volume are likely to represent biological phenomena rather than estimation errors, because only small daily changes were detected in the fixed preparations (see Fig. 6F,G).
We revealed that the fluctuations of spine volume in the presence of NMDAR inhibitors are unrelated to Na+ spikes, because the addition of TTX (1 μm) to block Na+ channels caused no additional effects (Fig. 3A,B; see Fig. 5C,D). Neither are the fluctuations mediated by Ca2+ spikes, because inhibitors of voltage-dependent Ca2+ channels (VDCC; see Materials and Methods) did not change the fluctuations (Fig. 3C,D; see Fig. 5E,F). Spine elimination (9.2 ± 2.4; n = 7) and generation (12.3 ± 3.9) were unaffected by the addition of inhibitors of Na+ and Ca2+ channels. Although TTX is the simplest means of blocking neuronal activity, we did not include the drug in most experiments, because TTX tended to kill neurons over the course of several days (Fishbein and Segal, 2007). The same was true of VDCC inhibitors, which were toxic when applied over 3 d.
Dendritic spines formed and grew in the absence of NMDAR activity. This was true even when slices were continuously exposed to NMDAR inhibitors from the day of hippocampal isolation (postnatal day 4) when spines were rare (Fig. 4A). Such NMDAR independence is consistent with previous studies in which spine generation and growth persisted in the presence of NMDAR inhibitors or TTX (Annis et al., 1994; Rao and Craig, 1997; Luthi et al., 2001). Importantly, these drugs did not cause the spines to all look the same (volumes varied greatly from spine to spine even when we blocked activity-dependent plasticity from the onset of spine generation) (Fig. 4B).
We therefore conclude that spine volumes fluctuate spontaneously and that this fluctuation is independent of activity-dependent plasticity. Rather, we think the fluctuations reflect constitutive cellular processes. These types of changes, which we refer to as intrinsic fluctuations, are common among small living structures and may be considered as a form of “noise.” However, as we will explain, this fluctuation in spine volume plays a crucial role in determining the stability of spines.
This theory led us to the next phase of the work, which was to quantify the intrinsic fluctuation of the synapse in the absence of activity-dependent plasticity. In this study, we defined intrinsic fluctuations as the changes in spine volume that occur in the presence of NMDAR inhibitors. Because the fluctuations were not significantly affected by blockers of Na+ and Ca2+ spikes, they could not be caused by the evoked release of any neurotransmitters, dendritic Ca2+ spikes (Golding et al., 2002), and NMDA spikes (Schiller et al., 2000). Intrinsic fluctuations, thus defined and actually measured in our experimental condition, have all the characteristics of random fluctuation, as we show later that there was no temporal correlation (see Fig. 9A), and the average had no drift (Fig. 5).
We did not block the spontaneous release of neurotransmitters while measuring intrinsic fluctuations for two reasons: (1) because spontaneous release occurs naturally in synapses and (2) because it is necessary for the maintenance of synapses, as its blockade with botulinum toxin greatly reduced the density of dendritic spines (McKinney et al., 1999). We therefore could not exclude that intrinsic fluctuations involve plasticity induced by metabotropic glutamate receptors or AMPA receptors activated by spontaneous release of glutamate. In general, intrinsic fluctuations are produced by many cellular events (including stochastic changes in every signaling mechanism), turnover of structural molecules and organelles, and mechanical and metabolic perturbations from surrounding cells.
Quantitative analysis of spine structural plasticity
To explore the rules that might govern these intrinsic fluctuations, we pooled data from spines with similar initial volumes. Our common unit of observation was the change in volume from 1 d to the next, and we calculated the mean change (μ) and SD of change (σ) for each of the size-segregated data pools (Fig. 5A,B). We found that larger spines showed the most diverse constellation of changes, increases and decreases of large and small magnitudes, or no changes at all. In other words, σ was greater for larger spines. Indeed, σ was approximately proportional to spine-head volume (Fig. 5A). In contrast, μ was around zero (Fig. 5B), indicating that the increases in volume balanced out the decreases, on average. We detected the same patterns in σ and μ among spines in which we had blocked Na+ channels (Fig. 5C,D), or Na+ and Ca2+ channels (Fig. 5E,F), in addition to NMDA receptors. Inhibition of Na+ and Ca2+ channels slightly increased the standard deviation of small-spine volumes (Fig. 5C,E). This was mostly ascribed to slight increases in elimination of spines (data not shown), likely reflecting the toxic effects of the inhibitors on neurons.
These conclusions on the SD of change (σ) and mean change (μ) (Fig. 5) can be directly confirmed in the original time series data (Fig. 6), in which the volumes of individual spines are plotted. The time course and direction of these changes (Fig. 6A) appeared to vary randomly in the presence of NMDAR inhibitors (Fig. 6B,C; see Fig. 9A), and in the further presence of the Na+ channel blocker (Fig. 6D,E). The variations were greater for larger spines (Fig. 6C,E) than smaller ones (Fig. 6B,D), as analyzed in Figure 5. Also, the average values for spine volume within the population did not change over time (Fig. 6B–E, black lines), consistent with zero drift (μ = 0) in Figure 5. These daily variations did not represent the estimation errors, because they were not significant in fixed preparations (Fig. 6F,G).
Medium-sized spines (0.1 < V < 0.2 μm3) sometimes became large spines (V > 0.25 μm3) through the random accumulation of these fluctuations (Fig. 6B), and ∼14% of such medium-sized spines became large spines within 3 d (Table 2). Thus, large spines could form via activity-independent processes. Presumably, the same mechanism explains why we observed some large spines in slices that had been exposed continuously to NMDAR inhibitors from the time of hippocampal isolation (Fig. 4).
Table 2.
Transition probabilities for medium-sized and large spines over 3 d
| Condition | 0.1 < V < 0.2 to V > 0.25 μm3 (growth of medium spines) |
V > 0.2 to V < 0.15 μm3 (shrinkage of large spines) |
Model | ||
|---|---|---|---|---|---|
| Actual | Predicted | Actual | Predicted | ||
| Control | 1.6% (1 of 63) | 3.4% | 27.6% (8 of 29) | 30% | C-1 |
| APV + MK-801 | 13.6% (8 of 59)* | 8.0% | 12.5% (3 of 24) | 12% | I-1 |
Transition probabilities were estimated from all spines that fulfilled the initial conditions and that could be monitored for 3 d. The predicted values were obtained from the actual initial values of spines as described in Appendix A (S9). The actual data were not significantly different from the predicted results (p > 0.5, Fisher's test) in all four cases. *p = 0.012, versus corresponding value for the control condition (Fisher's test).
We found that normal synaptic activity (in samples without APV or MK-801) amplified the variability in spine-size changes (reflected in an increase in σ), but this effect was limited to small spines (V < 0.1 μm3) (Fig. 7A). Spines with a head volume >0.1 μm3 showed similar values for σ regardless of the presence or absence of NMDAR inhibitors (Fig. 7A), indicating that intrinsic fluctuations were not caused by NMDAR inhibitors. Thus, small spines got bigger or smaller in response to synaptic activity or intrinsic fluctuations, but medium and large spines changed volume mainly through intrinsic fluctuations (Fig. 7A,C). Our findings are consistent with the observation that large spines do not get bigger in response to synaptic stimulation (Matsuzaki et al., 2004; Kopec et al., 2006) (Appendix B). These data support the idea that small spines preferentially involve in learning, whereas large spines could be structural substrates for mnemonic traces (Kasai et al., 2003; Hung et al., 2008).
Although synaptic activity did not affect σ of larger spines, it did affect μ. When NMDARs were blocked, volume increases cancelled out volume decreases (μ = 0). But when synaptic activity was normal, μ was significantly less than zero (Fig. 7B). In other words, spines over a certain size (0.1 μm3) were more likely to shrink than to enlarge when the synapse was active (Fig. 7C). This pattern was also evident in individual spines tracked over a 3 d period (Fig. 7D,E). Large spines shrank from V > 0.2 to V < 0.15 μm3 more frequently in the presence of activity-dependent plasticity (27.6% over 3 d) than in its absence (12.5%) (Table 2). Similarly, more large spines formed in samples that contained APV and MK-801 than in controls (13.6 vs 1.6% over 3 d) (Table 2; Fig. 6B,D, 7D).
These observations may relate to the fact that NMDAR activation yields a smaller increase in Ca2+ concentration in larger spines because of diffusion (Noguchi et al., 2005). Therefore, larger spines tend to have lower peak concentrations of activity-induced Ca2+, which in turn are more likely to lead to long-term depression (LTD) and shrinkage (Lisman, 1989; Yang et al., 1999). Moreover, we found that the tendency for large spines to get smaller depended not just on spine-head volume but also on spine-neck length. Considering only the subset of spines that had necks longer than 0.6 μm (Fig. 1A, spine 7), the largest spines (V > 0.2 μm3) were as likely to enlarge as to shrink. In other words, for this subpopulation of very large spines with long necks, μ was not significantly different than zero even when the synapse was active (p = 0.7) (Fig. 7B, filled squares). However, μ remained negative for medium-sized spines (0.1 < V < 0.2 μm3) at active synapses, even when the spines had long necks. Thus, large spines with long necks are resistant to activity-dependent shrinkage and enlargement: they are “write protected.”
The presence of NMDAR inhibitors also affected the distribution of spine-head volumes (Fig. 8A,B). A 3 d exposure to APV and MK-801 caused a significant increase in the number of spines with a head volume of <0.1 μm3 (Fig. 8C). This alteration was similar in slices treated for 3 d or for the entire period after hippocampal isolation (Fig. 8D).
Mathematical model for population dynamics of spines
We have observed that spines are continuously getting bigger or smaller in a semirandom manner. To describe such random continuous fluctuations, Brownian motion is used in both the natural and social sciences (Tuckwell, 1988; Kloeden and Platen, 1999; Câteau and Fukai, 2001). Brownian motion W(t) describes the continuous movement, or “random walk,” of a very small particle that is buffetted by surrounding particles. When a time-dependent random variable (stochastic process), V(t), shows the fluctuations that have an average change (or drift) μ(V) and SD σ(V), the dynamics of V(t) is described with the Langevin equation:
 |
where W(t) represents standard Brownian motion with a variance of 1/d (Tuckwell, 1988; Risken, 1989; Câteau and Fukai, 2003; Câteau and Reyes, 2006). We have applied the Langevin equation to the volume fluctuations of spines V(t), by using the SD and drift obtained from the experiments (Fig. 7C).
We validated our use of the Langevin equation by deriving W(t) (Fig. 9) from the actual data. We describe this calculation in detail in Appendix A (S11). To summarize, W(t) fulfilled two conditions for Brownian motion. First, changes in W(t) did not depend on the past history of such changes (Fig. 9A,C). Second, the changes in W(t) showed a roughly Gaussian distribution (with a variance of 1/d) (Fig. 9B,D).
We found that we could approximate the intrinsic fluctuations in spine volume with σ(V) = αV + β and μ(V) = 0, where α and β are 0.2 and 0.01, respectively (Fig. 5A,B, lines I-1). The stationary density distribution for this stochastic process is then obtained [Appendix A (S1)] as follows:
where C is a constant for normalization under the reflecting boundary conditions at both V = 0.02 and 1 μm3. We set these boundaries because spines with a volume of <0.02 μm3 were classified as filopodia (hence, excluded from our analysis), and those with a volume of >1 μm3 were seldom observed. The fact that spine generation and spine elimination were approximately balanced (Table 1) indicated that 0.02 μm3 was effectively a reflecting boundary. Indeed, the theoretical distribution of spine volumes does a good job overall of predicting the actual distribution of spine volumes (Fig. 8B,D). The theory explains that small spines are predominant because they experience small fluctuations and zero drift (μ = 0). As a result, they accumulate (Fig. 5). Larger spines tend to spread out because they experience larger fluctuations.
If we approximate fluctuations in the presence of activity as σ(V) = β and μ(V) = −γV + δ, where β, γ, and δ are 0.045, 0.16, and 0.01, respectively (Fig. 7A,B, blue lines C-0), then we can express the stationary distribution of spine volumes [Appendix A (S1)] as follows:
which fits the actual distribution (Fig. 8A) with the exception of a few large spines (Fig. 8A, arrow). A corresponding normal distribution has a round peak at 0.06 μm3 (δ/γ) and an SD of 0.08 μm3 [β(2γ)−0.5]. Model C-1 in Figure 7, A and B, better predicts the existence of spines with a head volume >0.3 μm3 (Fig. 8E, arrow). The models C-0 and C-1 are defined by fitting the SD and mean with piecewise linear functions. Thus, activity-dependent enlargement transforms a population of small spines into medium-sized ones (Fig. 8F), whereas the dominance of shrinkage over enlargement (γ > 0) (Fig. 7B) restricts the generation of large spines. Our model thus provides the theoretical basis for the stationary distribution of spine volumes in pyramidal cells in vitro and in vivo (Benavides-Piccione et al., 2002).
This theory reconciles two observations that seemed at odds with one another. How could synaptic activity have a modest effect on the distribution of spine volumes (Fig. 8F) when NMDAR inhibitors altered spine dynamics so significantly (Fig. 7)? The answer is that intrinsic fluctuations determine much of the distribution (Fig. 7A) and because generation of large spines through activity-dependent plasticity is restricted (Fig. 7A,B). This theory further predicts that the small changes in the stationary distribution of spine volume detected in certain neurological and psychiatric disorders (Fiala et al., 2002; Hung et al., 2008) may actually reflect prominent impairment of spine dynamics.
An important feature of our model (Eq. 1) (Fig. 7C) is that it also accounts for spine elimination. Data on spines that existed on day 0 but were eliminated by day 1, 2, or 3 fit well with the model (Fig. 10A), which defined elimination as the shrinkage of a spine to <0.02 μm3 (Fig. 7C) [Appendix A (S2)]. This finding shows that the smallest spines obey the model until the time immediately before their elimination (Fig. 7C), and that spine elimination is a direct result of activity-dependent plasticity and intrinsic fluctuations. The fact that our calculations so accurately explained the rate of spine elimination (Fig. 10) and the distribution of spine-head volume (Fig. 8) confirms that activity-dependent and intrinsic fluctuations are biological phenomena and not measurement errors or artifacts.
The model predicts that small spines will be eliminated more frequently than larger ones, a prediction that we confirmed experimentally [Fig. 10B; see also Fig. 1A (spine 3) and Fig. 2A (spines 8 and 10)]. As a result, older spines became larger: spines that persisted for >3 d were significantly larger (0.13 μm3; n = 204) than average (0.094 μm3; n = 321; p < 0.001, Mann–Whitney test). As a related point, we found that the daily elimination rate for spines that existed between day 0 and day i − 1 (i = 1, 2, or 3) and were counted on day i was smaller for more persistent spines (paired Student's t test, p < 0.04–0.01). In other words, older spines were eliminated less often (Fig. 10C), as the model predicts. Thus, older spines get larger, and larger spines resist elimination. In short, spines that persist, resist.
New spines also obey the model on several counts (Fig. 7C). First, most spines <1 d old had head volumes <0.1 μm3 [Figure 10D; see also Fig. 1A (spines 3 and 5) and Fig. 2A (spines 4, 6, 7, and 10)]. Thus, new spines grow gradually, and large spines are usually older. Second, new spines are eliminated at about the same rate as existing spines (Fig. 10B) of the same size. This finding shows that new spines are more often eliminated because they are small, not because they are new per se (Fig. 10D). Thus, spine volumes V(t) do not depend on the past history (Markov property), as assumed in Equation 1. For a pool of hypothetical new spines with volumes of 0.021 μm3 (just over the threshold), our model predicts that 40% will be eliminated within 10 min as a result of intrinsic fluctuations [Appendix A (S3a)]. This prediction is consistent with the behavior of filopodia, the precursors of mature spines, which make transient contacts with many presynaptic terminals before selecting one and forming a stable connection (Grutzendler et al., 2002; Konur and Yuste, 2004; Zuo et al., 2005a; Knott et al., 2006; Nagerl et al., 2007). Thus, our model of spine dynamics can naturally explain otherwise peculiar behaviors of filopodia based on the actual data of spine dynamics.
Synaptic activity did not appear to enhance the rate of spine generation in this study (Table 1) or a previous one in vivo (Zuo et al., 2005b). However, logic requires that synaptic activity must actually enhance spine generation, because activity increases the rate of spine elimination (Fig. 10A, Table 1). Our one-observation-per-day protocol underestimates the connection between activity and spine generation because it missed the generation of transient spines that formed in the interval between image-acquisition sessions. Our model predicts that the real daily rates of spine generation were 93% of the total number in the absence of synaptic activity and 242% in its presence, assuming that each newly generated spine has an initial volume of 0.021 μm3 [Appendix A (S4a)]. This calculation indicates that synaptic activity induced the generation of 149% of the total number of spines (242% minus 93%) per day. This prediction is consistent with previous studies that used rapid imaging, which showed that neuronal activity causes new spines and filopodia to form (Engert and Bonhoeffer, 1999; Maletic-Savatic et al., 1999). Thus, our theory resolves the apparent experimental discrepancy between previous rapid imaging and the slow, time-lapse experiments described here.
Additional predictions for spine population dynamics
Our model (Fig. 7C) allows us to predict how intrinsic fluctuations might affect spines over long periods of time. We first estimated the average time course of changes in spine volume, assuming that spine volumes become zero after elimination (defined as a volume <0.02 μm3). We found that average spine volume slowly shrank because of this elimination (Fig. 11A), although the drift (μ) in spine volume was zero, and spines could maintain their original volumes for a few days (Fig. 11A). When we calculated the evolution of medium-to-large spines (initial volumes, 0.1, 0.3, or 0.6 μm3) in the absence of activity-dependent plasticity (Fig. 11A), we found that the spines shrank with a time constant of ∼80 d for all three starting volumes. The predicted time courses correspond to the reported persistence of LTP, given that spine volume is proportional to the functional expression of AMPA receptors (Matsuzaki et al., 2001; Smith et al., 2003; Beique et al., 2006; Asrican et al., 2007). Thus, intrinsic fluctuations of spine volume are compatible with the long-term (>80 d) persistence of LTP for population EPSPs in vivo (Abraham, 2003).
Figure 11.

Population dynamics of spines predicted by the mathematical model. A, Changes in volume over time as predicted by model I-1 for spines with initial volumes of 0.6, 0.3, or 0.1 μm3. Spines are eliminated when V reaches 0.02 μm3; thereafter, V is assigned a value of zero. B, Relationship between mean life expectancy and spine-head volume according to models I-1, C-0, C-1, and C-2. C, D, Dependence on spine age of the mean head volume and mean life expectancy, respectively, of spines that follow models I-1, C-0, C-1, or C-2.
The model predicts that spine-head volumes change gradually (Fig. 7C), which in turn dictates that bigger spines have longer life expectancies (Fig. 11B, model I-1), a prediction consistent with experimental data (Fig. 10B). The mean life expectancy becomes shorter when activity-dependent plasticity randomly “overwrites” the synapses (Fig. 11B, model C-1). Life expectancy also varies with the distribution of spine volumes: a greater proportion of large spines (which resist activity-dependent shrinkage) yields longer average life expectancy (Fig. 11B, model C-2). In contrast, life expectancy is shortened (Fig. 11B, model C-0) if such a write-protection mechanism is absent (Fig. 7B, model C-0).
The model also matches experimental data (Fig. 10D) in predicting that the head volume of spines correlates with spine age (Fig. 11C, model I-1) [Appendix A (S8)]. This correlation held even in the presence of normal synaptic activity (Fig. 11C, models C-0, C-1, and C-2). Larger spines, therefore, tend to contain information that was acquired earlier than that encoded by small spines. Moreover, spine age is an important predictor of their life expectancy (Fig. 11D, model I-1), as we observed (Fig. 10C). Older spines, therefore, have longer life expectancies, akin to our memory (see Discussion). Thus, spine sizes reflect not just synaptic connectivity but also the age and life expectancy of the spines.
For several reasons, we believe our observations in cultured slices, in addition to the model made from those observations, reflect physiological process in the intact brain. The existence of intrinsic fluctuations, for example, is supported by the finding that the distributions of spine volume in mouse neocortex are similar in vivo (Benavides-Piccione et al., 2002; Ballesteros-Yanez et al., 2006) and in vitro (Fig. 8). Also, our in vitro data (Table 1) and previous work in vivo (Zuo et al., 2005b) both show that NMDAR inhibition does not completely block spine elimination and generation, although the time courses may appear different. In one report, adult neocortex in vivo showed an 8% rate of spine elimination over a 14 d period in the presence of an NMDAR inhibitor (Zuo et al., 2005b). In contrast, we observed an 8% rate of spine elimination in a single day for young hippocampal neurons in vitro (Table 1). However, we note that this difference can be reconciled by changing the time axis in the neocortical model by a factor of 14 [Appendix A (S1a)], because the same rate of elimination was achieved within 1 d in young hippocampus while within 14 d in the neocortex. Doing so yields a predicted life expectancy of 57 × 14 = 798 d for neocortex spines with a head volume of 0.3 μm3. This calculated value matches the lifelong persistence of large spines in the mouse neocortex in vivo (Zuo et al., 2005a). In this way, our hippocampal model explains the observed transition between medium-sized spines and large ones (Table 2), and the neocortical model predicts that such transitions occur over a time period increased by a factor of 14. The slow formation and decay of large spines may explain why the neocortex is a “slow learner” and is the site for long-term memory storage (Wiltgen et al., 2004).
Discussion
We have provided the most thorough description of long-term spine dynamics to date. Our study explains key aspects of spine behavior that have, until now, been poorly understood, including the stationary distributions of spine volumes in vivo and in vitro, the long-term persistence of large spines, the behavior of filopodia, and the activity dependence of spine generation.
Intrinsic fluctuations of dendritic spines
Dendritic spines get larger and smaller even in the absence of plastic changes caused by NMDA receptors and action potentials. We refer to these activity-independent changes as intrinsic fluctuations and find that they can occur within the space of a day. Although individual spines can expand or shrink as a result of intrinsic fluctuations, the overall profile of synaptic volumes remained constant (μ(V) = 0). Intrinsic fluctuations probably represent the inevitable instability caused by several processes, including the miniature neurotransmitter releases, the turnover of molecular constituents within the spine, the spontaneous fluctuations of many signaling mechanisms, and metabolic and mechanical influences from surrounding cells. Intrinsic fluctuations naturally account for the randomness of spine-volume distributions in the absence of activity (Rao and Craig, 1997; Luthi et al., 2001) and may explain how spines form and grow when the brain is essentially inactive (Annis et al., 1994; Rao and Craig, 1997; Luthi et al., 2001), or in the early developmental period.
We were able to quantify intrinsic fluctuations in cultured slices of rat hippocampus between postnatal days 17 and 23. Although it is likely that similar but slower fluctuations exist in adult cortex in vivo, the direct quantification of intrinsic fluctuations in vivo presents more of a challenge. If, as we predict, the time course of fluctuations in adult neocortex neurons is indeed much slower than that of young hippocampal neurons, then an accurate measurement of this phenomenon in the adult cortex would require weeks of stable observations under the complete blockade of activity-dependent plasticity.
It has been reported that blockade of action potentials induces so-called homeostatic plasticity (Turrigiano et al., 1998) and increases the global expression of glutamate receptors. In the present study, we studied spine structures and found no evidence that activity blockade increased average spine volume. These results suggest that, although the two parameters correlate strongly under certain conditions (Matsuzaki et al., 2001), the expression of glutamate receptors can be controlled separately from the structure of the spine (Turrigiano and Nelson, 2000) and that intrinsic fluctuations do not reflect homeostatic plasticity. Other studies state that the application of APV to block NMDA-mediated miniature EPSPs increased protein synthesis in the dendrites (Sutton et al., 2006). Such protein synthesis, however, would not account for intrinsic fluctuations of spine volumes because NMDAR inhibitors never increased the level of volume fluctuation and fluctuations of spines >0.1 μm3 were primarily unaffected by NMDAR inhibitors.
We found that the drift, or trend, of spine-volume changes was negligible (μ(V) = 0) in the absence of activity-dependent plasticity. Spines can keep their original volume at least for a few days at least in young hippocampus (Figs. 6B, 11A) and for 1 month, presumably, in the adult neocortex. Thus, neuronal networks can store information for short periods in terms of the strength of synaptic connections, as is often assumed in neuronal network models. However, the average volume gradually declines over longer time periods (Fig. 11A) because of random fluctuations of spine volume (Fig. 6) and the elimination of the smallest spines. Our model predicts that the life expectancy of spines is long: assuming μ = 0, the life expectancy of a 0.3 μm3 spine might range from 57 to 798 d to 64 years depending on the value assigned to the CV in daily spine volume (σ/V was set at 20%, 5.3% and 1%, in these examples) [Appendix A (S1a)]. Thus, the neuronal network can store a memory trace for short and long periods through the regulation of synaptic weights and the selection of synaptic connections, respectively.
The calculations above represent the cusp of understanding the eminent stability of the dendritic spine, needing only a molecular–mechanical explanation for a small CV (σ/V) and a zero drift (μ). Although existing molecules shape spines, they turn over within 3 h (Okabe et al., 1999; Gray et al., 2006) and cannot account for spine stability over 1 year (Zuo et al., 2005a), a period many times greater (1 year/3 h = 2848) than their residence time within the spine. The stable nature of the dendritic spine is consistent with the notion of the dissipative structure (Glansdorff and Prigogine, 1971), in which structural stability is explained by the nonequilibrium dynamics of an open system. We propose that the link between synaptic function and spine volume is essential for the long-term maintenance of synaptic plasticity, because spine volume is stable, whereas AMPA and NMDA receptors turn over within 30 min (Heine et al., 2008; Zhao et al., 2008). Indeed, in physiological conditions, LTP and LTD are both associated with changes in spine volume from the outset (Matsuzaki et al., 2004; Okamoto et al., 2004; Zhou et al., 2004; Wang et al., 2007).
Spine volume was a critical determinant of both intrinsic fluctuations and activity-dependent plasticity (Fig. 7C). In fact, the smallest spines, those newly formed or almost eliminated, obey the same rules (Fig. 10) as other spines, which means that spine volume is intimately tied to the dynamics of spine creation and destruction. Our model also explains the volume distributions of spines (Fig. 8), which supports the claim that the behaviors of all types of spines have been properly considered. These findings indicate that spine volume is the key parameter determining the behaviors of spines. The fact that spine volume is intimately tied to the dynamics of spine creation and destruction suggests that the same cellular mechanism mediates the volume changes and elimination/generation of spines, and that adhesion molecules between presynaptic and postsynaptic structures play a key role in these processes (Kasai et al., 2003; Craig and Kang, 2007; Shapiro et al., 2007).
Spine-volume distributions are similar in the young hippocampus as well as in the adult neocortex. Our theory predicts that the volume distribution of spines is highly sensitive to the balance between activity-dependent plasticity and intrinsic fluctuations (Appendix A). This prediction suggests that activity-dependent plasticity and intrinsic fluctuations are regulated in parallel and that they share common molecular mechanisms that determine the structural stability of a spine. It will be important in the future to clarify how intrinsic fluctuations are optimized for functioning of neuronal networks.
Population behaviors of dendritic spines
We found that dendritic spines form in the complete absence of NMDA receptor activation, in line with results from in vivo experiments (Zuo et al., 2005b). Importantly, our model predicts that the generation of spines occurs far more frequently than can be detected by time-lapse imaging, which fails to count those spines that only appear transiently during the interval between imaging sessions [Appendix A (S4a)]. Thus, our model indicates that the true or total rate of spine generation can be far greater than what is actually detected by time-lapse imaging. This corresponds to the fact that filopodia constantly emerge and touch many presynaptic terminals before selecting one and forming a stable connection (Knott et al., 2006; Nagerl et al., 2007). The high frequency of new-synapse formation may be a key characteristic of the cerebral cortex relative to the peripheral nervous system, where synaptic elimination plays a dominant role (Lichtman and Colman, 2000).
We observed that new spines may also form in response to synaptic activity, as others have shown in rapid-imaging experiments (Engert and Bonhoeffer, 1999; Maletic-Savatic et al., 1999; Nagerl et al., 2004). These studies, however, describe a delay of at least 20 min between electrical stimulation and the formation of new spines. This time course is too slow to explain rapid memory formation. Furthermore, activity-dependent spine generation cannot be synapse specific, because synapse creation comes only after spine formation (Knott et al., 2006; Nagerl et al., 2007). As a candidate mechanism for memory formation, the immediate enlargement of an existing spine is not bound by these constraints (Matsuzaki et al., 2004; Tanaka et al., 2008).
We found that older spines have longer life expectancies (Fig. 11D). This feature is unique to biological memory and is not used in any man-made memory devices. It is therefore worthwhile to speculate how this feature affects the macroscopic properties of memory in the cortex. As far back as 1885, Hermann Ebbinghaus noted that older memories last longer and are less likely to be forgotten than newer memories (Ebbinghaus, 1885; Wixted and Ebbesen, 1991). Ebbinghaus (1885) quantified the persistence of memory by measuring savings in the time required for relearning between 0.013 and 31 d after the first learning. He found that the decay of memory was not exponential but logarithmic, and it could be described by k/[(Log[a t])c + k], which has been called the “savings function” or the “forgetting curve.” Our data show that for very small spines (0.021–0.03 μm3), the average change in volume over time shows a rapid decay and then a long plateau (Fig. 12). The rapid decay marks the frequent elimination of these small spines, and the plateau represents the persistence of those spines that have enlarged through intrinsic fluctuations. The time course of volume decay for the smallest spines (0.021 μm3) is well fitted by the savings function (Fig. 12, dashed line). If the slight enlargement of the small spines in a neuronal network does indeed represent a new memory trace, then these persistent spines may account for the savings of time during relearning. If so, then we have provided a physiological explanation for a psychological observation that was made 123 years ago.
Figure 12.

Average time course of head-volume changes for spines that obey model I-1 and have initial values of 0.04, 0.03, and 0.021 μm3. The mean values become <0.02 μm3 because the model dictates that V go to zero after reaching 0.02 μm3, meaning that spines are eliminated yet remain included in the calculated average. The dashed line represents the saving function, k/[(Log[a,t])c + k], where k = 0.13, a = 480, and c = 1.2.
Our model predicts that larger spines have a longer life expectancy (Fig. 11B) despite the greater magnitude of intrinsic fluctuations (Fig. 5A). We explain this incongruity by noting that spine volumes change slowly and that large spines must shrink before they can be eliminated. In the absence of activity-dependent synaptic plasticity, the mean life expectancy for a large spine (0.3 μm3) is 57 d (Fig. 11B), but normal synaptic activity can shorten it considerably if activity-dependent changes randomly overwrite the spine. However, large spines with long necks are resistant to activity-dependent shrinkage (Figs. 7B, 11B, model C-2). Spines with a large head and a long neck are found more frequently in the neocortex than in the hippocampus (Harris and Stevens, 1989; Benavides-Piccione et al., 2002; Noguchi et al., 2005), and more frequently in the human neocortex than in the mouse neocortex (Benavides-Piccione et al., 2002). These anatomical details, in light of our current results, support the fact that the neocortex is responsible for longer-lasting memory, particularly in human beings.
Although most large spines form through intrinsic fluctuations (Fig. 7C), activity-dependent plasticity can contribute to this process. Rather than creating large spines directly, repeated activity-dependent growth creates a pool of medium-sized spines (0.1 < V < 0.2 μm3) that facilitates the creation of large spines by intrinsic fluctuations. This mechanism may explain why the formation of a stable memory requires repetitive learning over extended periods of time.
In summary, the simple model provides unifying understanding of the spine dynamics and psychological features of memory. Our work helps clarify the link between spine form and spine function, the role of spines in memory formation and storage, and the possible ramifications of spine abnormalities observed in developmental, neurological, and psychiatric conditions.
Appendix A
Spine dynamics
Here we describe mathematical models for the statistical dynamics of dendritic spines. A Mathematica5.2 notebook presenting the numerical evaluation (SpineDynamics.nb) is available at http://www.bm2.m.u-tokyo.ac.jp/spinedist/dl.html. The section numbers below correspond to those in the session numbers in the Mathematica notebook.
S0: Stochastic processes of spine volume
Spine volumes (V) are expressed by the following Langevin equation, if the time course of spine-volume change can be approximated with a diffusion process with an SD of σ(V) and a drift of μ(V):
 |
where W(t) is a standard white noise with a variance of 1/d (Tuckwell, 1988;Risken, 1989; Câteau and Fukai, 2003; Câteau and Reyes, 2006). The diffusion approximation will be validated in section S11. Analysis of the stochastic process with either the Fokker-Planck equation or Monte Carlo simulation yielded identical results (S10). We mostly used the Fokker-Planck equation for quantitative analysis. Monte Carlo simulation was useful for generating sample paths for intuitive understanding and for confirming the results of numerical evaluations with the Fokker-Planck equation. We performed stochastic integration according to Itô's definition (Risken, 1989; Kloeden and Platen, 1999). Then, the transition probability density p(V,t|y) of the spine volume, which is V at time t and y at t = 0, satisfies a Fokker-Planck equation:
 |
The partial differential equation is converted into simultaneous ordinary differential equations by dividing volume axis into many compartments with a regular interval (0.001–0.01 μm3) in S2–S10 (Crank, 1975). Minimal (Vmin) and maximal (Vmax) values of spine volume are set at 0.02 and 1 μm3, respectively, because spines with volume <0.02 μm3 were classified as filopodia, and spines with volumes >1.0 μm3 have seldom been found.
S1: Stationary volume distributions
The stationary solution of the Fokker-Planck equation can be derived directly as follows when a reflecting boundary condition is assumed at both Vmin and Vmax:
 |
where C is a constant for normalization (Risken, 1989). In the absence of activity-dependent plasticity, we have approximately μ(V) = 0 and σ(V) = αV + β, and the stochastic process is reduced to a variant of the geometric Brownian motion:
the stationary distribution of which is given by an inverse square function:
 |
In control conditions with normal synaptic signaling, we have approximately μ(V) = −γV + δ and σ(V) = β, where the stochastic process is reduced to the Ornstein-Uhlenbeck process:
the stationary distribution of which is given by the following:
 |
The model described by Equation 7 with (α, β) = (0.2, 0.01) is referred as I-1, and the one described by Equation 9 with (β, γ, δ) = (0.045, 0.16, 0.01) is referred as C-0. For the realistic sets of parameters in control conditions shown in Figure 7, A and B:
 |
for both C-1 and C-2, and
 |
for C-1, and
 |
for C-2 as shown in Figure 7B. Stationary distributions for these parameters could be numerically obtained using Equation 6 [SpineDynamics.nb (S1)].
Volume distributions 3 d after treatment with NMDA inhibitors can be numerically estimated using the Fokker-Planck equation (Eq. 5) with the parameters (I-1) under the reflecting boundary condition [SpineDynamics.nb (S1.2)]. The distribution is qualitatively similar to the stationary distribution for I-1 (Fig. 8B).
S1a: Neocortical model
Intrinsic fluctuations appear to occur far more slowly in the neocortex than they do in the young hippocampus. Assuming that in the absence of activity, the distribution of spines in the neocortex is the same as it is in the hippocampus, the Langevin equation for intrinsic fluctuations for the neocortex is expressed as follows:
because the stationary distribution is given by Equation 8. The small elimination rate in neocortex (8%/14 d) relative to hippocampus (8%/d) can be explained by either A2 = 1/14 or by expanding the time axis by a factor of 14.
The life expectancy of spines with V = 0.3 μm3 is predicted as 57 d (Fig. 11B), 798 (57 × 14) days, or 64 (57 × 400 d) years when A = 1, 1/, or 1/20, respectively. Because the SD of spine volume (σ) is nearly proportional to spine volume (Eq. 14), we can approximate the variability of spine volume using the CV per day, which is 0.2A. The values of CV are 20%, 5.3%, and 1% when A = 1, 1/, and 1/20, respectively. Thus, a slight difference in CV of spine volume per day results in an enormous difference in the life expectancy of spine.
S2: Elimination per days
The elimination of the spines T days after identification is calculated by the following:
 |
where the stationary distribution f(y) for the model C-1 is assumed as the initial distribution and the absorbing boundary is set at V = Vmin. Note that the slopes of E(T, f) versus T, or the elimination rates per day, are reduced with a longer interval of observation (T) (Fig. 10A), because the persistent population of spines gradually become larger.
S3: Spine-volume dependence of elimination rates
If a spine has an initial volume of V0, the probability that the spine persists for T days is obtained as follows:
 |
The elimination rate per T days is then expressed as follows:
S3a: Elimination rates of small spines
Assuming the volume of a new spine is 0.021 μm3, our model predicts that 40% of them will be eliminated within 10 min in the absence of activity (I-1) using E(10 min, 0.021).
S4: Spine-volume distributions of new spines
Assuming the new spines have a volume of 0.021 μm3, volume distributions of newly generated spines, which are absent on day 0 and found on day T, can be predicted using the Fokker-Planck equation with an absorbing boundary at V = Vmin and constant generation of the smallest spines between days 0 and T with a rate of 1/T. The integral of the transition density distribution after T days reflects the survival fraction of new spines S(T) and is used to normalize the distribution. Note that S(T) is dependent on μ(V) and σ(V) and is a complex function of T, as is the case with E(T, f).
S4a: Total rates of spine generation and spine density
The apparent spine generation within T days G(T) detected by time-lapse imaging is the multiple of the total rate of spine generation for T days GTotal(T)(= T × GTotal) and the survival fraction of new spines S(T) defined in S4:
The survival fraction within one day S(1) are calculated as 15% and 6% in the absence (I-1) and presence (C-1) of activity, respectively (S4). Hence, the total rates of spine generation were 93% (14%/0.15) and 242% (14.5%/0.06) of existing spines. Thus, the total or true spine generation must occur far more frequently than detected by time-lapse imaging.
The total rate of spine elimination ETotal(T, f) are also far prevalent than actually detected. It is expressed as the sum of elimination of existing spines E(T, f) and that of newly generated transient spines, GTotal(T) − G(T):
The total elimination rates for 1 d (T = 1) are 87% (= 8 + 93 − 14) and 245.8% (= 18.3 + 242 − 14.5) in the absence (I-1) and presence (C-1) of activity, respectively. In the absence of activity, for example, a total of 93% spines are newly generated and 87% spines are eliminated, and spine density was increased by 6% (Table 1).
Changes in the spine density per T day is described as follows:
The spine density can be increased or decreased by subtle changes in the balance between the total generation of spines GTotal(T), the survival fraction of new spines S(T), and the elimination of existing spines E(T, f). The spine density was increased with NMDAR inhibition in our study (Table 1) as it was in vivo (Zuo et al., 2005b). Other studies, however, have reported that spine density was reduced when NMDAR was inhibited with other methods (Alvarez et al., 2007; Shankar et al., 2007; Ultanir et al., 2007). Such decrease in spine density can be explained if NMDAR inhibition suppressed the total generation of spines GTotal(T) more than E(T, f)/S(T).
S5: Average time course of spine volume
The average time course of spine volume with the initial value of V0 can be expressed as follows:
 |
S6: Spine-volume dependence of the mean life expectancy
Using Equation 16, the probability density distribution of the life expectancies of spines is expressed as − , and the mean life expectancy L(V0) can be obtained by the following:
 |
S7: Spine-age dependence of the mean spine volume and life expectancy
The distribution of the spines that are generated on day 0 and persist until day A can be obtained by p(V, A|0.02) with the absorbing boundary at V = Vmin. The distribution is normalized to obtain the probability density function f(V|A). Spine-age dependence of the mean volume VAge(A) and the mean life expectancy LAge(A) is obtained by the following:
 |
 |
S8: Correlation coefficients between spine age and volume
Correlation coefficients of the two random variables, spine age and spine volume, are obtained as 0.48, 0.32, 0.42, and 0.51 for I-1, C-0, C-1, and C-2, respectively. These values indicate that spine ages and volumes are not only dependent but significantly correlated. The correlation coefficients were calculated as follows. Probability density function of ages of the spines that have the volume of V on day 0 can be obtained by the following:
 |
for a sufficiently large value of K. The probably density function of spines with volume V and age A is then given by the following:
which gives the probably density function of spines with age A as follows:
 |
Using these probability density functions, f(V, A), f(V), and fAge(A), we can obtain the correlation coefficient of A and V (Wilks, 1962).
S9: Transition probability
The transition probability of spines with initial volumes of Vi to the range, R, in t days is obtained as follows:
 |
The mean transition probability can be obtained using many spines with different initial volumes.
S10: Monte Carlo simulation of spine dynamics
Numerical evaluation with the Fokker-Planck equation can be confirmed by Monte Carlo simulation. A sample path (V1,,,,VN) of spine volume with an initial volume of V0 can be calculated according to (n = 0,1,,,,N − 1):
where w0,w1,,,,wN−1 are independent, standard, Gaussian-distributed random variables (Risken, 1989), and Δt is a small time interval (0.01–1 d). By using computer-generated random numbers, we can readily determine sample paths of spine volume. For the reflecting boundary condition at Vmin, Vi is substituted with Vmin − (Vi − Vmin) = 2Vmin − Vi, when Vi is less than Vmin.
We can obtain the stationary distributions (S10.1) and average time courses (S10.2) identical to those estimated with the Fokker-Planck equation, indicating that evaluation of the Fokker-Planck equation was correctly performed for the reflecting and absorbing boundary conditions. We also confirmed that the elimination rate, life expectancy, distribution of aged spines, etc., are similarly estimated with the Fokker-Planck and Monte Carlo approaches.
S11: Rationale for the diffusion approximation
We directly assessed the fundamental assumption of Brownian motion that enabled our use of the Langevin equation. Brownian motion, W(ti) = Wi, fulfills two properties. First, changes in Wi do not depend on their past history, and hence (W2 − W1) and (W1 − W0) should be independent. Using Equation 29 and Δt = 1, we have the following:
We used parameters μ and σ, similar to I-1 and C-1, to obtain Wi+1 − Wi in the presence and absence of NMDA inhibitors. We plotted (W2 − W1) against (W1 − W0) in the presence (Fig. 9A) and in the absence (Fig. 9C) of NMDA inhibitors and found that their correlation coefficients were −0.004 (p = 0.969) and −0.189 (p = 0.054), respectively. A slight correlation in control may represent a systematic trend of activity-dependent plasticity in our slice-culture conditions.
Second, W(t) − W(0) should have a Gaussian distribution with a variance of t. Distributions of Wi+1 − Wi are roughly Gaussian both in the presence and absence of NMDA inhibitors (Fig. 9B,D). The variances were 1.1, 1.9, and 2.5 (n = 420, 269, 129) for t of 1, 2, and 3 d, respectively, in the presence of NMDA inhibitors, and 1.3, 1.9, and 2.5 (n = 415, 286, 147) in the absence of NMDA inhibitors. Increases in the variances were less than the ideal Brownian motion even in the presence of NMDA inhibitors, suggesting that spines may be more stable than predicted by the simple diffusion approximation (Eq. 4).
Appendix B
The resistance of large spines to long-term enlargement has been described in two previous reports (Matsuzaki et al., 2004; Kopec et al., 2006) that used synaptic stimulation to induce spine enlargement in acute experiments. The former study (Matsuzaki et al., 2004) showed that the absolute increases in the volume of large spines were insignificant relative to rapid spontaneous fluctuations of spine volume [Matsuzaki et al. (2004), their supplemental Fig. 2c]. In contrast, the latter study (Kopec et al., 2006) showed that some large spines underwent significant absolute increases in volume. This apparent discrepancy may be attributable to three factors. First, in the latter study (Kopec et al., 2006), the increase in spine volume was estimated as the mean of values at 5, 40, and 70 min after induction; therefore, these values must reflect the early enlargement apparent at 5 min. Second, large spines were defined in the latter study (Kopec et al., 2006) as those with a volume of >1.6 times the population average of a certain set of spines. However, spine volume is highly variable (Fig. 8), and the population average can be small. As a result, spines with a volume of >1.6 times the population average may actually contain small spines. Third, spine enlargement was induced by the application of chemical compounds to the entire slice preparation in the latter study (Kopec et al., 2006), whereas it was induced by synapse-specific stimulation in the former study (Matsuzaki et al., 2004).
Large spines were reported to enlarge similarly as small spines in a report (Yang et al., 2008) in which theta-burst electrical stimulation were used to induce LTP. In the study, the spine volumes were calibrated into volumes by the fluorescence of dendritic branches from the same image stack, assuming that they were thick enough to contain the entire focal volume. This is not the case, however, because the brightness of the dendritic branch is variable from dendrite to dendrite, and such calibration must yield overestimation of spine volumes.
These acute studies in the structural plasticity of dendritic spines investigated the plasticity only up to a few hours, and the plasticity may not be more persistent. In contrast, the present study quantified the plasticity over days and should represent more realistic properties of long-term structural plasticity.
Footnotes
This work was supported by grants-in-aid from the Ministry of Education, Culture, Sports, Science, and Technology (MEXT) of Japan (H.K., M.M.), by the Global Centers of Excellence Program (Integrative Life Science Based on the Study of Biosignaling Mechanisms) of MEXT (H.K.), and by grants from the National Institutes of Health (H.K.) and the Takeda Science Foundation (H.K.). We thank H. Nakahara, G. J. Augustine, Y. Shiraki, G. C. R. Ellis-Davies, W. B. Gan, C. R. Brodie, and H. Câteau for discussion and N. Takahashi, T. Kise, T. Suzuki, Y. Hara, M. Yoshida, Y. Iwanami, and R. Takizawa for technical assistance.
References
- Abraham WC. How long will long-term potentiation last? Philos Trans R Soc Lond B Biol Sci. 2003;358:735–744. doi: 10.1098/rstb.2002.1222. [DOI] [PMC free article] [PubMed] [Google Scholar]
- Abraham WC, Robins A. Memory retention—the synaptic stability versus plasticity dilemma. Trends Neurosci. 2005;28:73–78. doi: 10.1016/j.tins.2004.12.003. [DOI] [PubMed] [Google Scholar]
- Alvarez VA, Ridenour DA, Sabatini BL. Distinct structural and ionotropic roles of NMDA receptors in controlling spine and synapse stability. J Neurosci. 2007;27:7365–7376. doi: 10.1523/JNEUROSCI.0956-07.2007. [DOI] [PMC free article] [PubMed] [Google Scholar]
- Annis CM, O'Dowd DK, Robertson RT. Activity-dependent regulation of dendritic spine density on cortical pyramidal neurons in organotypic slice cultures. J Neurobiol. 1994;25:1483–1493. doi: 10.1002/neu.480251202. [DOI] [PubMed] [Google Scholar]
- Asrican B, Lisman J, Otmakhov N. Synaptic strength of individual spines correlates with bound Ca2+-calmodulin-dependent kinase II. J Neurosci. 2007;27:14007–14011. doi: 10.1523/JNEUROSCI.3587-07.2007. [DOI] [PMC free article] [PubMed] [Google Scholar]
- Ballesteros-Yanez I, Avides-Piccione R, Elston GN, Yuste R, DeFelipe J. Density and morphology of dendritic spines in mouse neocortex. Neuroscience. 2006;138:403–409. doi: 10.1016/j.neuroscience.2005.11.038. [DOI] [PubMed] [Google Scholar]
- Beique JC, Lin DT, Kang MG, Aizawa H, Takamiya K, Huganir RL. Synapse-specific regulation of AMPA receptor function by PSD-95. Proc Natl Acad Sci U S A. 2006;103:19535–19540. doi: 10.1073/pnas.0608492103. [DOI] [PMC free article] [PubMed] [Google Scholar]
- Benavides-Piccione R, Ballesteros-Yanez I, DeFelipe J, Yuste R. Cortical area and species differences in dendritic spine morphology. J Neurocytol. 2002;31:337–346. doi: 10.1023/a:1024134312173. [DOI] [PubMed] [Google Scholar]
- Bloodgood BL, Sabatini BL. Nonlinear regulation of unitary synaptic signals by CaV(2.3) voltage-sensitive calcium channels located in dendritic spines. Neuron. 2007;53:249–260. doi: 10.1016/j.neuron.2006.12.017. [DOI] [PubMed] [Google Scholar]
- Câteau H, Fukai T. Fokker-Planck approach to the pulse packet propagation in synfire chain. Neural Netw. 2001;14:675–685. doi: 10.1016/s0893-6080(01)00065-x. [DOI] [PubMed] [Google Scholar]
- Câteau H, Fukai T. A stochastic method to predict the consequence of arbitrary forms of spike-timing-dependent plasticity. Neural Comput. 2003;15:597–620. doi: 10.1162/089976603321192095. [DOI] [PubMed] [Google Scholar]
- Câteau H, Reyes AD. Relation between single neuron and population spiking statistics and effects on network activity. Phys Rev Lett. 2006;96 doi: 10.1103/PhysRevLett.96.058101. 058101. [DOI] [PubMed] [Google Scholar]
- Craig AM, Kang Y. Neurexin-neuroligin signaling in synapse development. Curr Opin Neurobiol. 2007;17:43–52. doi: 10.1016/j.conb.2007.01.011. [DOI] [PMC free article] [PubMed] [Google Scholar]
- Crank J. Oxford: Oxford UP; 1975. The mathematics of diffusion. [Google Scholar]
- De Simoni A, Griesinger CB, Edwards FA. Development of rat CA1 neurones in acute versus organotypic slices: role of experience in synaptic morphology and activity. J Physiol (Lond) 2003;550:135–147. doi: 10.1113/jphysiol.2003.039099. [DOI] [PMC free article] [PubMed] [Google Scholar]
- Ebbinghaus H. Leipzig: Dunker and Humbolt; 1885. Über das Gedachtnis. [Google Scholar]
- Engert F, Bonhoeffer T. Dendritic spine changes associated with hippocampal long-term synaptic plasticity. Nature. 1999;399:66–70. doi: 10.1038/19978. [DOI] [PubMed] [Google Scholar]
- Fiala JC, Feinberg M, Popov V, Harris KM. Synaptogenesis via dendritic filopodia in developing hippocampal area CA1. J Neurosci. 1998;18:8900–8911. doi: 10.1523/JNEUROSCI.18-21-08900.1998. [DOI] [PMC free article] [PubMed] [Google Scholar]
- Fiala JC, Spacek J, Harris KM. Dendritic spine pathology: cause or consequence of neurological disorders? Brain Res Rev. 2002;39:29–54. doi: 10.1016/s0165-0173(02)00158-3. [DOI] [PubMed] [Google Scholar]
- Fischer M, Kaech S, Knutti D, Matus A. Rapid actin-based plasticity in dendritic spines. Neuron. 1998;20:847–854. doi: 10.1016/s0896-6273(00)80467-5. [DOI] [PubMed] [Google Scholar]
- Fishbein I, Segal M. Miniature synaptic currents become neurotoxic to chronically silenced neurons. Cereb Cortex. 2007;17:1292–1306. doi: 10.1093/cercor/bhl037. [DOI] [PubMed] [Google Scholar]
- Fusi S, Drew PJ, Abbott LF. Cascade models of synaptically stored memories. Neuron. 2005;45:599–611. doi: 10.1016/j.neuron.2005.02.001. [DOI] [PubMed] [Google Scholar]
- Glansdorff P, Prigogine I. London: John Wiley; 1971. Themodynamics of structure, stability and fluctuations. [Google Scholar]
- Golding NL, Staff NP, Spruston N. Dendritic spikes as a mechanism for cooperative long-term potentiation. Nature. 2002;418:326–331. doi: 10.1038/nature00854. [DOI] [PubMed] [Google Scholar]
- Gray NW, Weimer RM, Bureau I, Svoboda K. Rapid redistribution of synaptic PSD-95 in the neocortex in vivo. PLoS Biol. 2006;4:e370. doi: 10.1371/journal.pbio.0040370. [DOI] [PMC free article] [PubMed] [Google Scholar]
- Grutzendler J, Kasthuri N, Gan WB. Long-term dendritic spine stability in the adult cortex. Nature. 2002;420:812–816. doi: 10.1038/nature01276. [DOI] [PubMed] [Google Scholar]
- Harris KM, Stevens JK. Dendritic spines of CA 1 pyramidal cells in the rat hippocampus: serial electron microscopy with reference to their biophysical characteristics. J Neurosci. 1989;9:2982–2997. doi: 10.1523/JNEUROSCI.09-08-02982.1989. [DOI] [PMC free article] [PubMed] [Google Scholar]
- Harris KM, Fiala JC, Ostroff L. Structural changes at dendritic spine synapses during long-term potentiation. Philos Trans R Soc Lond B Biol Sci. 2003;358:745–748. doi: 10.1098/rstb.2002.1254. [DOI] [PMC free article] [PubMed] [Google Scholar]
- Heine M, Groc L, Frischknecht R, Beique JC, Lounis B, Rumbaugh G, Huganir RL, Cognet L, Choquet D. Surface mobility of postsynaptic AMPARs tunes synaptic transmission. Science. 2008;320:201–205. doi: 10.1126/science.1152089. [DOI] [PMC free article] [PubMed] [Google Scholar]
- Hille B. Sunderland, UK: Sinauer Associates; 2001. Ion channels of excitable membranes. [Google Scholar]
- Holtmaat A, Wilbrecht L, Knott GW, Welker E, Svoboda K. Experience-dependent and cell-type-specific spine growth in the neocortex. Nature. 2006;441:979–983. doi: 10.1038/nature04783. [DOI] [PubMed] [Google Scholar]
- Holtmaat AJ, Trachtenberg JT, Wilbrecht L, Shepherd GM, Zhang X, Knott GW, Svoboda K. Transient and persistent dendritic spines in the neocortex in vivo. Neuron. 2005;45:279–291. doi: 10.1016/j.neuron.2005.01.003. [DOI] [PubMed] [Google Scholar]
- Honkura N, Matsuzaki M, Noguchi J, Ellis-Davies GC, Kasai H. The subspine organization of actin fibers regulates the structure and plasticity of dendritic spines. Neuron. 2008;57:719–729. doi: 10.1016/j.neuron.2008.01.013. [DOI] [PubMed] [Google Scholar]
- Hung AY, Futai K, Sala C, Valtschanoff JG, Ryu J, Woodworth MA, Kidd FL, Sung CC, Miyakawa T, Bear MF, Weinberg RJ, Sheng M. Smaller dendritic spines, weaker synaptic transmission, but enhanced spatial learning in mice lacking Shank1. J Neurosci. 2008;28:1697–1708. doi: 10.1523/JNEUROSCI.3032-07.2008. [DOI] [PMC free article] [PubMed] [Google Scholar]
- Kasai H, Neher E. Dihidropyridine-sensitive and w-conotoxin-sensitive calcium channels in a mammalian neuroblastoma-glioma cell line. J Physiol (Lond) 1992;448:161–188. doi: 10.1113/jphysiol.1992.sp019035. [DOI] [PMC free article] [PubMed] [Google Scholar]
- Kasai H, Matsuzaki M, Noguchi J, Yasumatsu N, Nakahara H. Structure-stability-function relationships of dendritic spines. Trends Neurosci. 2003;26:360–368. doi: 10.1016/S0166-2236(03)00162-0. [DOI] [PubMed] [Google Scholar]
- Kloeden PE, Platen E. Berlin: Springer; 1999. Numerical solution of stochastic differential equations. [Google Scholar]
- Knott GW, Holtmaat A, Wilbrecht L, Welker E, Svoboda K. Spine growth precedes synapse formation in the adult neocortex in vivo. Nat Neurosci. 2006;9:1117–1124. doi: 10.1038/nn1747. [DOI] [PubMed] [Google Scholar]
- Konur S, Yuste R. Imaging the motility of dendritic protrusions and axon terminals: roles in axon sampling and synaptic competition. Mol Cell Neurosci. 2004;27:427–440. doi: 10.1016/j.mcn.2004.07.005. [DOI] [PubMed] [Google Scholar]
- Kopec CD, Li B, Wei W, Boehm J, Malinow R. Glutamate receptor exocytosis and spine enlargement during chemically induced long-term potentiation. J Neurosci. 2006;26:2000–2009. doi: 10.1523/JNEUROSCI.3918-05.2006. [DOI] [PMC free article] [PubMed] [Google Scholar]
- Lauri SE, Lamsa K, Pavlov I, Riekki R, Johnson BE, Molnar E, Rauvala H, Taira T. Activity blockade increases the number of functional synapses in the hippocampus of newborn rats. Mol Cell Neurosci. 2003;22:107–117. doi: 10.1016/s1044-7431(02)00012-x. [DOI] [PubMed] [Google Scholar]
- Lichtman JW, Colman H. Synapse elimination and indelible memory. Neuron. 2000;25:269–278. doi: 10.1016/s0896-6273(00)80893-4. [DOI] [PubMed] [Google Scholar]
- Lisman J. A mechanism for the Hebb and the anti-Hebb processes underlying learning and memory. Proc Natl Acad Sci U S A. 1989;86:9574–9578. doi: 10.1073/pnas.86.23.9574. [DOI] [PMC free article] [PubMed] [Google Scholar]
- Luthi A, Schwyzer L, Mateos JM, Gahwiler BH, McKinney RA. NMDA receptor activation limits the number of synaptic connections during hippocampal development. Nat Neurosci. 2001;4:1102–1107. doi: 10.1038/nn744. [DOI] [PubMed] [Google Scholar]
- Malenka RC, Bear MF. LTP and LTD: an embarrassment of riches. Neuron. 2004;44:5–21. doi: 10.1016/j.neuron.2004.09.012. [DOI] [PubMed] [Google Scholar]
- Maletic-Savatic M, Malinow R, Svoboda K. Rapid dendritic morphogenesis in CA1 hippocampal dendrites induced by synaptic activity. Science. 1999;283:1923–1927. doi: 10.1126/science.283.5409.1923. [DOI] [PubMed] [Google Scholar]
- Matsuzaki M, Ellis-Davies GCR, Nemoto T, Miyashita Y, Iino M, Kasai H. Dendritic spine geometry is critical for AMPA receptor expression in hippocampal CA1 pyramidal neurons. Nat Neurosci. 2001;4:1086–1092. doi: 10.1038/nn736. [DOI] [PMC free article] [PubMed] [Google Scholar]
- Matsuzaki M, Honkura N, Ellis-Davies GC, Kasai H. Structural basis of long-term potentiation in single dendritic spines. Nature. 2004;429:761–766. doi: 10.1038/nature02617. [DOI] [PMC free article] [PubMed] [Google Scholar]
- McDonough SI, Boland LM, Mintz IM, Bean BP. Interactions among toxins that inhibit N-type and P-type calcium channels. J Gen Physiol. 2002;119:313–328. doi: 10.1085/jgp.20028560. [DOI] [PMC free article] [PubMed] [Google Scholar]
- McKinney RA, Capogna M, Durr R, Gahwiler BH, Thompson SM. Miniature synaptic events maintain dendritic spines via AMPA receptor activation. Nat Neurosci. 1999;2:44–49. doi: 10.1038/4548. [DOI] [PubMed] [Google Scholar]
- Nagerl UV, Eberhorn N, Cambridge SB, Bonhoeffer T. Bidirectional activity-dependent morphological plasticity in hippocampal neurons. Neuron. 2004;44:759–767. doi: 10.1016/j.neuron.2004.11.016. [DOI] [PubMed] [Google Scholar]
- Nagerl UV, Kostinger G, Anderson JC, Martin KA, Bonhoeffer T. Protracted synaptogenesis after activity-dependent spinogenesis in hippocampal neurons. J Neurosci. 2007;27:8149–8156. doi: 10.1523/JNEUROSCI.0511-07.2007. [DOI] [PMC free article] [PubMed] [Google Scholar]
- Nakagawa T, Futai K, Lashuel HA, Lo I, Okamoto K, Walz T, Hayashi Y, Sheng M. Quaternary structure, protein dynamics, and synaptic function of SAP97 controlled by L27 domain interactions. Neuron. 2004;44:453–467. doi: 10.1016/j.neuron.2004.10.012. [DOI] [PubMed] [Google Scholar]
- Newcomb R, Szoke B, Palma A, Wang G, Chen X, Hopkins W, Cong R, Miller J, Urge L, Tarczy-Hornoch K, Loo JA, Dooley DJ, Nadasdi L, Tsien RW, Lemos J, Miljanich G. Selective peptide antagonist of the class E calcium channel from the venom of the tarantula Hysterocrates gigas. Biochemistry. 1998;37:15353–15362. doi: 10.1021/bi981255g. [DOI] [PubMed] [Google Scholar]
- Noguchi J, Matsuzaki M, Ellis-Davies GCR, Kasai H. Spine-neck geometry determines NMDA receptor-dependent Ca2+ signaling in dendrites. Neuron. 2005;46:609–622. doi: 10.1016/j.neuron.2005.03.015. [DOI] [PMC free article] [PubMed] [Google Scholar]
- Nusser Z, Lujan R, Laube G, Roberts JD, Molnar E, Somogyi P. Cell type and pathway dependence of synaptic AMPA receptor number and variability in the hippocampus. Neuron. 1998;21:545–559. doi: 10.1016/s0896-6273(00)80565-6. [DOI] [PubMed] [Google Scholar]
- Okabe S, Kim HD, Miwa A, Kuriu T, Okado H. Continual remodeling of postsynaptic density and its regulation by synaptic activity. Nat Neurosci. 1999;2:804–811. doi: 10.1038/12175. [DOI] [PubMed] [Google Scholar]
- Okamoto K, Nagai T, Miyawaki A, Hayashi Y. Rapid and persistent modulation of actin dynamics regulates postsynaptic reorganization underlying bidirectional plasticity. Nat Neurosci. 2004;7:1104–1112. doi: 10.1038/nn1311. [DOI] [PubMed] [Google Scholar]
- Otmakhov N, Tao-Cheng JH, Carpenter S, Asrican B, Dosemeci A, Reese TS, Lisman J. Persistent accumulation of calcium/calmodulin-dependent protein kinase II in dendritic spines after induction of NMDA receptor-dependent chemical long-term potentiation. J Neurosci. 2004;24:9324–9331. doi: 10.1523/JNEUROSCI.2350-04.2004. [DOI] [PMC free article] [PubMed] [Google Scholar]
- Randall AD, Tsien RW. Contrasting biophysical and pharmacological properties of T-type and R-type calcium channels. Neuropharmacology. 1997;36:879–893. doi: 10.1016/s0028-3908(97)00086-5. [DOI] [PubMed] [Google Scholar]
- Rao A, Craig AM. Activity regulates the synaptic localization of the NMDA receptor in hippocampal neurons. Neuron. 1997;19:801–812. doi: 10.1016/s0896-6273(00)80962-9. [DOI] [PubMed] [Google Scholar]
- Risken H. Berlin: Springer; 1989. The Fokker-Planck equation. [Google Scholar]
- Schiller J, Major G, Koester HJ, Schiller Y. NMDA spikes in basal dendrites of cortical pyramidal neurons. Nature. 2000;404:285–289. doi: 10.1038/35005094. [DOI] [PubMed] [Google Scholar]
- Shankar GM, Bloodgood BL, Townsend M, Walsh DM, Selkoe DJ, Sabatini BL. Natural oligomers of the Alzheimer amyloid-β protein induce reversible synapse loss by modulating an NMDA-type glutamate receptor-dependent signaling pathway. J Neurosci. 2007;27:2866–2875. doi: 10.1523/JNEUROSCI.4970-06.2007. [DOI] [PMC free article] [PubMed] [Google Scholar]
- Shapiro L, Love J, Colman DR. Adhesion molecules in the nervous system: structural insights into function and diversity. Annu Rev Neurosci. 2007;30:451–474. doi: 10.1146/annurev.neuro.29.051605.113034. [DOI] [PubMed] [Google Scholar]
- Smith M, Ellis-Davies GCR, Magee JC. Mechanism of the distance-dependent scaling of Schaffer collateral synapse in CA1 pyramidal neurons. J Physiol (Lond) 2003;548:245–258. doi: 10.1113/jphysiol.2002.036376. [DOI] [PMC free article] [PubMed] [Google Scholar]
- Sutton MA, Ito HT, Cressy P, Kempf C, Woo JC, Schuman EM. Miniature neurotransmission stabilizes synaptic function via tonic suppression of local dendritic protein synthesis. Cell. 2006;125:785–799. doi: 10.1016/j.cell.2006.03.040. [DOI] [PubMed] [Google Scholar]
- Takumi Y, Ramirez-Leon V, Laake P, Rinvik E, Ottersen OP. Different modes of expression of AMPA and NMDA receptors in hippocampal synapses. Nat Neurosci. 1999;2:618–624. doi: 10.1038/10172. [DOI] [PubMed] [Google Scholar]
- Tanaka J, Horiike Y, Matsuzaki M, Miyazaki T, Ellis-Davies GCR, Kasai H. Protein synthesis and neurotrophin-dependent structural plasticity of single dendritic spines. Science. 2008;319:1683–1687. doi: 10.1126/science.1152864. [DOI] [PMC free article] [PubMed] [Google Scholar]
- Trachtenberg JT, Chen BE, Knott GW, Feng G, Sanes JR, Welker E, Svoboda K. Long-term in vivo imaging of experience-dependent synaptic plasticity in adult cortex. Nature. 2002;420:788–794. doi: 10.1038/nature01273. [DOI] [PubMed] [Google Scholar]
- Tuckwell HC. Vol 2. Cambridge, UK: Cambridge UP; 1988. Introduction to theoretical neurobiology. [Google Scholar]
- Turrigiano GG, Nelson SB. Hebb and homeostasis in neuronal plasticity. Curr Opin Neurobiol. 2000;10:358–364. doi: 10.1016/s0959-4388(00)00091-x. [DOI] [PubMed] [Google Scholar]
- Turrigiano GG, Leslie KR, Desai NS, Rutherford LC, Nelson SB. Activity-dependent scaling of quantal amplitude in neocortical neurons. Nature. 1998;391:892–896. doi: 10.1038/36103. [DOI] [PubMed] [Google Scholar]
- Ultanir SK, Kim JE, Hall BJ, Deerinck T, Ellisman M, Ghosh A. Regulation of spine morphology and spine density by NMDA receptor signaling in vivo. Proc Natl Acad Sci U S A. 2007;104:19553–19558. doi: 10.1073/pnas.0704031104. [DOI] [PMC free article] [PubMed] [Google Scholar]
- Wang XB, Yang Y, Zhou Q. Independent expression of synaptic and morphological plasticity associated with long-term depression. J Neurosci. 2007;27:12419–12429. doi: 10.1523/JNEUROSCI.2015-07.2007. [DOI] [PMC free article] [PubMed] [Google Scholar]
- Wilks SS. New York: Wiley; 1962. Mathematical statistics. [Google Scholar]
- Wiltgen BJ, Brown RA, Talton LE, Silva AJ. New circuits for old memories: the role of the neocortex in consolidation. Neuron. 2004;44:101–108. doi: 10.1016/j.neuron.2004.09.015. [DOI] [PubMed] [Google Scholar]
- Wixted JT, Ebbesen EB. On the form of forgetting. Psychol Sci. 1991;2:409–415. [Google Scholar]
- Xie Z, Huganir RL, Penzes P. Activity-dependent dendritic spine structural plasticity is regulated by small GTPase Rap1 and its target AF-6. Neuron. 2005;48:605–618. doi: 10.1016/j.neuron.2005.09.027. [DOI] [PubMed] [Google Scholar]
- Yang SN, Tang YG, Zucker RS. Selective induction of LTP and LTD by postsynaptic [Ca2+]i elevation. J Neurophysiol. 1999;81:781–787. doi: 10.1152/jn.1999.81.2.781. [DOI] [PubMed] [Google Scholar]
- Yang Y, Wang XB, Frerking M, Zhou Q. Spine expansion and stabilization associated with long-term potentiation. J Neurosci. 2008;28:5740–5751. doi: 10.1523/JNEUROSCI.3998-07.2008. [DOI] [PMC free article] [PubMed] [Google Scholar]
- Zhao J, Peng Y, Xu Z, Chen RQ, Gu QH, Chen Z, Lu W. Synaptic metaplasticity through NMDA receptor lateral diffusion. J Neurosci. 2008;28:3060–3070. doi: 10.1523/JNEUROSCI.5450-07.2008. [DOI] [PMC free article] [PubMed] [Google Scholar] [Retracted]
- Zhou Q, Homma KJ, Poo MM. Shrinkage of dendritic spines associated with long-term depression of hippocampal synapses. Neuron. 2004;44:749–757. doi: 10.1016/j.neuron.2004.11.011. [DOI] [PubMed] [Google Scholar]
- Zuo Y, Lin A, Chang P, Gan WB. Development of long-term dendritic spine stability in diverse regions of cerebral cortex. Neuron. 2005a;46:181–189. doi: 10.1016/j.neuron.2005.04.001. [DOI] [PubMed] [Google Scholar]
- Zuo Y, Yang G, Kwon E, Gan WB. Long-term sensory deprivation prevents dendritic spine loss in primary somatosensory cortex. Nature. 2005b;436:261–265. doi: 10.1038/nature03715. [DOI] [PubMed] [Google Scholar]