

Abstract
Macrophage infiltration into adipose tissue is a hallmark of obesity. We recently reported two phenotypically distinct subsets of adipose tissue macrophages (ATM) based on the surface expression of the glycoprotein F4/80 and responsiveness to treatment with a peroxisome proliferator-activated receptor (PPAR) γ agonist. Hence, we hypothesized that F4/80hi and F4/80lo ATM differentially express PPAR γ. This study phenotypically and functionally characterizes F4/80hi and F4/80lo ATM subsets during obesity. Changes in gene expression were also examined on sorted F4/80lo and F4/80hi ATM by quantitative real-time RT-PCR. We show that while F4/80lo macrophages predominate in adipose tissue of lean mice, obesity causes accumulation of both F4/80lo and F4/80hi ATM. Moreover, accumulation of F4/80hi ATM in adipose tissue is associated with impaired glucose tolerance. Phenotypically, F4/80hi ATM express greater amounts of CD11c, MHC II, CD49b, and CX3CR1 and produce more TNF-α, MCP-1, and IL-10 than F4/80lo ATM. Gene expression analyses of the sorted populations revealed that only the F4/80lo population produced IL-4, whereas the F4/80hi ATM expressed greater amounts of PPAR γ, δ, CD36 and toll-like receptor-4. In addition, the deficiency of PPAR γ in immune cells favors expression of M1 and impairs M2 macrophage marker expression in adipose tissue. Thus, PPAR γ is differentially expressed in F4/80hi versus F4/80low ATM subsets and its deficiency favors a predominance of M1 markers in WAT.
Keywords: Macrophages, obesity, adipose tissue, F4/80, PPAR gamma
1. Introduction
Overweight and obesity represent a significant public health problem [1]. The obesity epidemic is associated with increased rates of chronic metabolic and inflammatory diseases, such as cardiovascular disease (CVD), hypertension, metabolic syndrome, and type II diabetes (T2D), which link to insulin resistance [2]. Thus, understanding the underlying mechanisms of obesity-induced insulin resistance is essential for developing safe and effective therapies and preventive approaches against obesity-related complications.
It is well recognized that obesity is associated with low-grade systemic inflammation, but it has only been in the past five years when it was discovered that the mononuclear phagocyte system plays a major role in its development. Early in 2003, two papers revealed that macrophages accumulate in white adipose tissue (WAT) of obese mice [3; 4], and it was subsequently revealed that monocyte chemoattractant protein-1 (MCP-1) and its receptor; the C-C motif chemokine receptor 2 (CCR2) are integral in this response [5; 6; 7]. Protection against obesity-induced insulin resistance was achieved by deleting key inflammatory mediators, such as c-Jun activated kinase 1 (JNK-1) [8], inhibitor of NF-κB kinase β (IKK β) [9; 10] and toll-like receptor 4 (TLR-4) [11]. Thus, consistent with the old on/off old model of macrophage activation, the initial focus in obesity research was to characterize the association between inflammatory macrophage accumulation and activation in fat and insulin resistance. However, the potential impact that the heterogeneity and plasticity of adipose tissue macrophages has on obesity and insulin resistance has largely been ignored.
Obesity is associated with macrophage infiltration into adipose tissue and a phenotypic switch from an M2 anti-inflammatory phenotype to an M1, pro-inflammatory phenotype. We recently identified two subsets of macrophages in adipose tissue based on their surface expression of F4/80 (F4/80hi and F4/80lo) and responsiveness to treatment with abscisic acid (ABA), a novel agonist of PPAR γ [12]. More specifically, treatment of mice with ABA significantly decreased accumulation of F4/80hi macrophages and production of MCP-1[12]. The accumulation of F4/80hi macrophages in adipose tissue of obese mice was also associated with increased severity of colitis [13]. These data suggest that F4/80hi ATM are functionally distinct than F4/80lo ATM and that PPAR γ may be differentially expressed in these two macrophage subsets. Based on this background, we hypothesized that F4/80hi ATM express greater amounts of PPAR γ than F4/80lo ATM. In support of this hypothesis, a series of recent studies have underscored the importance of PPARs as central regulators of ATM fate and function. More specifically, PPAR γ modulates maturation [14] and infiltration [15] of macrophages into adipose tissue, whereas expression of PPAR δ, the PPAR isotype with the broadest expression pattern, is induced by adipocyte-derived IL-13 and IL-4 [ 16; 17].
This study characterizes differential cytokine levels and phenotype of F4/80hi and F4/80lo ATM in vivo; establishes a link between accumulation of F4/80hi macrophages in adipose tissue and impaired glucose tolerance; demonstrates that PPAR γ, δ and CD36 are expressed at greater concentrations in F4/80hi than F4/80lo ATM and provides molecular evidence in vivo that the deficiency of PPAR γ in immune cells favors expression of M1 and impairs M2 markers in adipose tissue.
2. Materials and Methods
2.1. Mice and treatments
All experimental procedures were approved by the Institutional Animal Care and Use Committee of Virginia Polytechnic Institute and State University and met or exceeded requirements of the Public Health Service/National Institutes of Health and the Animal Welfare Act. BKS.Cg -+Leprdb /+Leprdb /OlaHsd (db/db), lean mice, PPAR γ-expressing (floxed) and tissue-specific PPAR γ null mice (PPAR γ fl/fl; MMTV-Cre+) in a B6 background were housed at the animal facilities at Virginia Polytechnic Institute and State University in a room maintained at 22° C, with a 12:12 h light-dark cycle starting from 6:00 AM.
Db/db mice become obese at 5 weeks of age. In some experiments db/db mice or lean mice were sacrificed at 10 weeks of age. The intra-abdominal white adipose tissue was then and used to generate single-cell suspensions. For the diet-induced obesity (DIO) studies, 6-week old C57BL6/J (n=40) mice were fed either low-fat [18] or high-fat (40% kcal from fat) [19] AIN-93G based-diets for 0, 70, or 140 days. In all experiments weight gain was monitored weekly. Development of impaired glucose tolerance was assessed by intraperitoneal glucose tolerance (IPGTT). After injecting 2 g glucose/kg body weight, blood glucose concentrations were measured at 0, 15, 45 and 90 minutes post-injection with an Accu-Chek® Glucometer (Roche, Indianapolis, IN).
2.2. Isolation of macrophages from white adipose tissue
Abdominal WAT was excised, weighed, minced into small <10 mg pieces and placed into digestion media consisting of DMEM (Mediatech, Herndon, VA) supplemented with 2.5% HEPES (Mediatech) and 10 mg/mL fatty-acid free bovine serum albumin (FAB-poor BSA, Sigma), and Collagenase Type II (0.3 %, Sigma-Aldrich). Tissues were incubated in a rotating 37°C water bath for 45 minutes and then filtered through a 100 μm filter (Becton Dickinson, Franklin Lakes, NJ) to remove debris and centrifuged at 4°C at 300×g for 8 minutes. The pellet, consisting of stromal vascular cells (SVCs), was washed with DMEM and centrifuged at 4°C at 300×g for 8 minutes. The supernatant was discarded and erythrocytes were lysed by incubating the SVCs in 2 mL of ammonium chloride buffer for 2 minutes before stopping the reaction with 9 mL 1X phosphate-buffered saline (PBS). Cells were centrifuged again at 4°C at 300×g for 10 minutes, suspended in 1 ml of 1X PBS, and enumerated with a Z1 Single Particle Counter (Beckman Coulter, Fullerton, CA).
2.3. Assessment of adipocyte hypertrophy
Adipose tissue specimens were fixed in 10% phosphate buffered neutral formalin, embedded in paraffin, cut at thicknesses of 5 microns and stained with hematoxylin and eosin (H&E). The area of adipocytes from WAT was analyzed using Image Pro Plus software (Media Cybernetics, Bethesda, MD). Each section was analyzed at 5 separate fields at a magnification of 100X. Areas were calculated for each adipocyte in a field, yielding an average adipocyte area per field. The five fields were then averaged to obtain the average adipocyte area for each mouse.
2.4. Immunophenotyping of stromal vascular cells from adipose tissue
Cells were seeded into 96-well plates (Costar) at 2×10⁵ cell/well. Non specific binding of antibodies was prevented by incubating cells with 20 μg/ml FcBlock (BD Biosciences — Pharmingen) for 20 minutes. Cells were then incubated with anti-mouse F4/80 PE-Cy5 (ebioscience, San Diego, CA), CD11b Alexa-fluor 700 (ebioscience), Ly6C-biotin (Serotec, Raleigh, NC), CD11c PE-Cy5.5 (ebioscience), MHC II PE (ebioscience), CCR7 PE-Cy7 (ebioscience) antibodies and anti human CCR2-PE (R&D systems, Minneapolis, MN) and CX3CR1 -FITC (MBL international, Woburn, MA) antibodies cross reactive with mouse. Strepavidin-Texas Red was used in a second step reaction for biotinylated antibodies. For intracellular cytokine detection, cell were fixed and permeabilized with Cytofix-Cytoperm solution (BD) after staining for extracellular markers. Cells were then incubated with anti-mouse antibodies to TNF-α PE (ebioscience), IL-6 FITC (ebioscience), IL-10 FITC (ebioscience), or MCP-1 PE (ebioscience) diluted in Perm-Wash buffer (BD). Data acquisition was computed with a BD LSR II flow cytometer and analysis performed with FACS Diva software (BD).
2.5. Lipopolysaccharide (LPS)-stimulation of the stromal vascular fraction
Stromal-vascular cells (SVCs) were seeded into round-bottom sterile 96-well plates (BD), treated with or without 200 ng/mL LPS and incubated for 12 hours at 37°C, as decribed by Zhuo et al [20]. After incubation, cells were immunophenotyped for expression of cell surface markers and intracellular cytokines.
2.6. Sorting of F4/80hi and F4/80lo populations
Following the initial phenotypic analysis of WAT macrophages, a separate experiment was done to sort F4/80hi and F4/80lo macrophages. Abdominal WAT was extracted from db/db mice and digested in calcium and magnesium-free 1XHBSS (Mediatech) containing Type II Collagenase (0.3%, Sigma) for 45 min at 37°C. Digests were then filtered and washed as described previously. Afterwards, samples were resuspended in 40% Percoll (Sigma), overlayed onto 70% Percoll, and centrifuged for 20 min at room temperature. Cells were recovered from the gradient density interface. Prior to FACS sorting, the cell suspension was enriched by positive magnetic selection using anti-mouse CD11b magnetic particles-DM (BD) following the manufacturer recommendations. Positively selected CD11b+ cells were resuspened in sorting buffer, enumerated with a Z1 Single Particle Counter and stained with F4/80 PE-Cy7 and CD45 APC-Cy7 as described above. F4/80lo and F4/80hi macrophages were then purified on a FACSAria cell sorter (BD). Purity of sorted populations was >98%.
2.7. Real-time quantitative RT-PCR
Total RNA was isolated from the sorted macrophage populations using the RNeasy Micro kit (Qiagen) according to the manufacturer's instructions. cDNA was generated from 0.5 μg of total RNA using the qScript cDNA Synthesis Kit (Quanta Biosciences, Gaithersburg, MD) and the concentration of cDNA for the genes of interest was obtained by real-time quantitative PCR analysis using an iCycler IQ System and Sybr Green PCR master mix (Applied Biosystems, Foster City, CA). Standard curves were generated using 10-fold dilutions of purified amplicons obtained by RT-PCR starting at 5 pg of cDNA. Amplicons were purified with the MiniElute PCR Purification Kit (Qiagen) and quantitated on an agarose gel by using a DNA mass ladder (Promega). Primer concentrations and annealing temperatures were optimized for the iCycler iQ system (Bio-Rad) for each set of primers using the system's gradient protocol. PCR efficiencies were maintained between 92 and 105% and the correlation coefficient for the standard curve above 0.98 (Table 1). A melting curve analysis was performed to monitor for the presence of nonspecific product amplification and primer/dimmers as previously shown [18]. Results are presented as starting quantity of target cDNA (picograms) per microgram of total RNA.
TABLE 1.
| Primer | Sequence | Length | Accession Number |
|---|---|---|---|
| β-actinF | 5′CCCAGGCATTGCTGACAGG3′ | 141 | X03672 |
| β-actinR | 5′TGGAAGGTGGACAGTGAGGC3′ | ||
| PPAR δF | 5′ACAGTGACCTGGCGCTCTTC3′ | 96 | U10375 |
| PPAR δR | 5′TGGTGTCCTGGATGGCTTCT3′ | ||
| PPAR γF | 5′CAGGCTTGCTGAACGTGAAG3′ | 117 | NM_011146 |
| PPAR γR | 5′GGAGCACCTTGGCGAACA3′ | ||
| CD36F | 5′CCGGGCCACGTAGAAAACA3′ | 156 | NM_007643 |
| CD36R | 5′CCTCCAAACACAGCCAGGAC3′ | ||
| TNF-αF | 5′ACTGCCAGAAGAGGCACTCC3′ | 137 | NM_013693 |
| TNF-αR | 5′CGATCACCCCGAAGTTCA3′ | ||
| TLR-4 F | 5′GGCGCTCCGAGTTCTGA3′ | 73 | NM_009841 |
| TLR-4 R | 5′GTACCTGCTTCAGCCCAGTG3′ | ||
| IL-4 F | 5′GCTATTGATGGGTCTCAACC′3 | 112 | NM_021283 |
| IL-4 R | 5′GCCGATCATCTCTCTCAAGT′3 | ||
| IL-13 F | 5′-CCCTCAGCCATGAAATAACT-3′ | 99 | NM_008355 |
| IL-13 R | 5′-GCGTAACAGGCCATTCTTCC-3′ | ||
| CCL1 F | 5′-CCAGACATTCGGCGGTTG-3′ | 90 | NM_011329.2 |
| CCL1 R | 5′-CAGCAGCAGGCACATCAG-3′ | ||
| CCL17 F | 5′-TAAGACCTCAGTGGAGTGTTC-3′ | 140 | NM_011332.2 |
| CCL17 R | 5′-AAATGCCTCAGCGGGAAGC-3′ | ||
| L19 F | 5′- CAAGAAGGAAGAGATCATCAAGAC -3′ | 75 | BC010710 |
| L19 R | 5′-GTACAGACACGAGGGAAGC -3′ |
F, forward; R, reverse. PCR primer pairs were designed for an optimal annealing temperature of 57°C and product lengths between 72 and 157 base pairs.
When plotting threshold cycle versus log starting quantity (pg), standard curves had slopes between -3.1 and -3.7; PCR efficiencies between 92 and 105 and R2 above 0.98.
2.8. Statistical analyses
Data were analyzed as a completely randomized design. To determine the statistical significance of the model, analysis of variance (ANOVA) was performed using the general linear model procedure of Statistical Analysis Software (SAS), and probability value (P) < 0.05 was considered to be significant. When the model was significant, ANOVA was followed by Fisher's Protected Least Significant Difference multiple comparison method.
3. Results
3.1. F4/80hi and F4/80lo infiltration into adipose tissue
We examined ATM infiltration in both lean and obese db/db mice. As anticipated, there were significant differences in body weights between the lean and obese groups (Fig 1C). We found that the F4/80lo ATM predominated over the F4/80hi ATMs in the stromal vascular fraction (SVF) of lean mice (Fig 1C). In addition, both subpopulations were significantly increased in the db/db mice when compared to the lean group (Fig 1C).
Fig. 1.
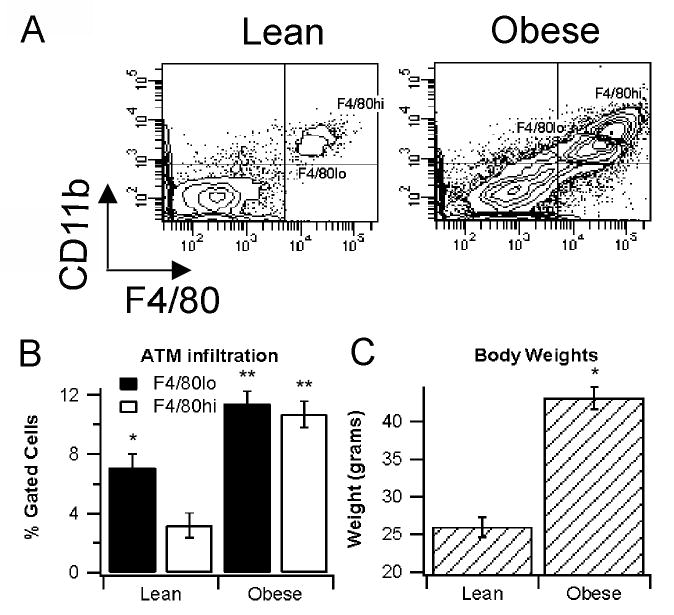
F4/80hi and F4/80lo populations in lean and obese mice. White adipose tissue (WAT) was extracted from 10-week old lean (n=7) and obese mice (n=6) and flow cytometry was run on the stromal vascular fraction (SVF) obtained by digestion with collagenase and fractionation with percoll. (A) Representative density plots, (B) macrophage infiltration and (C) body weights. Data points with different asterisks indicate a statistically significant difference (P<0.05).
3.2. Time course of F4/80hi and F4/80lo infiltration into adipose tissue
To better understand the kinetics of F4/80hi and F4/80lo accumulation into WAT, we fed high or low-fat diets to wild-type mice for 0, 70, or 140 days. Mice fed the HFD weighed more and had significantly larger adipocytes after 140 days (Fig 2A, 2B). Differences in glucose tolerance between mice administered the different dietary treatments were observed on days 70 and 140 (Fig. 2C, 2D). More, specifically, mice fed HFD had an impaired glucose-normalizing ability following a glucose tolerance test in comparison to mice fed LFD. Throughout the dietary intervention there was also a progressive increase in F4/80hi and F4/80lo ATM percentages in the HFD-fed mice, while in the LFD-fed mice the percentages for both populations were not significantly increased (Fig. 2E, 2F).
Fig. 2.
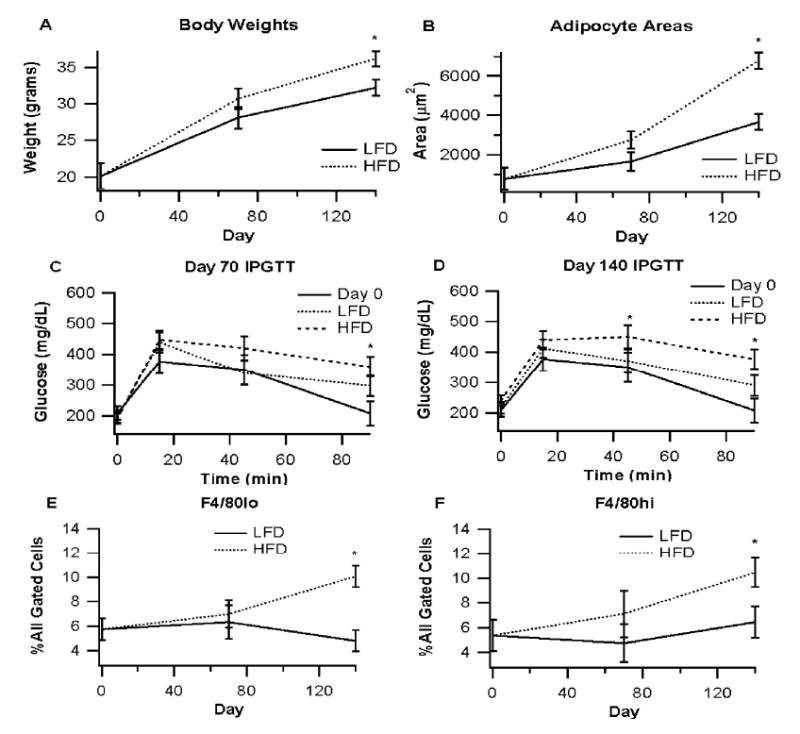
Time course of adipose tissue macrophage (ATM) infiltration. C57BL6/J mice were fed either high-fat or low-fat diets (HFD vs LFD) for 0, 70, or 140 days. (A) Body weights were recorder for each group and (B) average adipocyte areas from intra-abdominal white adipose tissue were calculated from hemotoxylin and eosin (H&E) stained slides using Image Pro software. (C, D) Intraperitoneal glucose tolerance tests (IPGTT, 2 g glucose/kg body weight) were conducted at all timepoints for an assessment of glucose homeostasis. (E, F) Accumulation of F4/80hi and F4/80lo adipose tissue macrophages in the stromal vascular fraction (SVF) for each group is depicted. Data points with an asterisk are statistically different from group (P<0.05).
3.3. Phenotype of ATM subsets
To determine the phenotypic differences between the ATM subsets, we assessed differences in median fluorescence intensity (MFI) among a series of extracellular markers in both F4/80lo and F4/80hi ATMs. MFI is indicative of protein concentration on the surface of the cells. Macrophages in the F4/80lo subset were significantly larger than those in the F4/80hi subset in lean mice, as indicated by a significant difference in forward scatter (FSC), but not in the obese mice (Fig. 3). Side scatter (SSC), which is indicative of the cell's internal complexity, was significantly greater in F4/80hi ATMs and in obese mice.
Fig. 3.
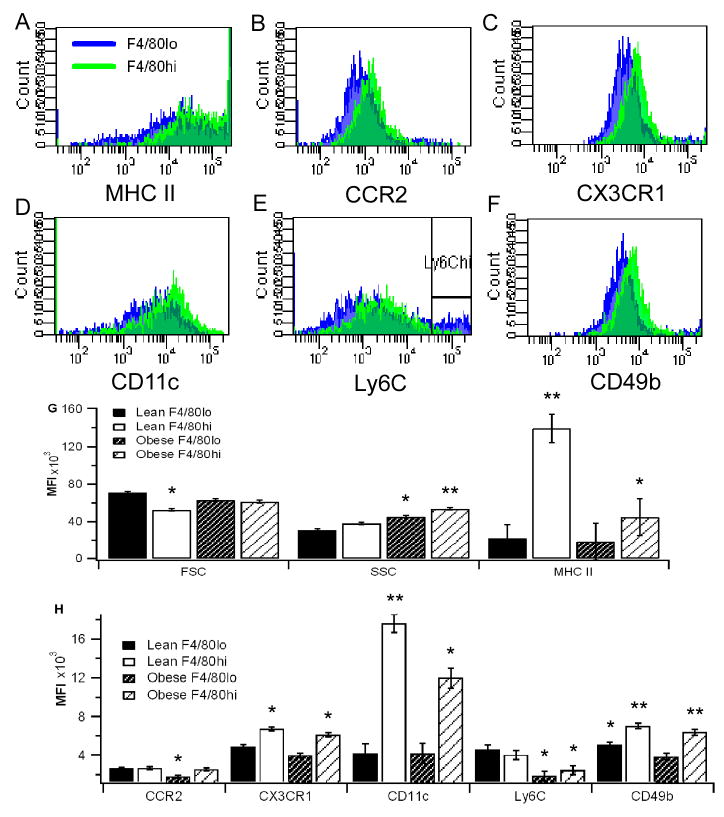
Phenotype of F4/80hi and F4/80lo adipose tissue macrophages (ATMs) in lean and obese mice. Cells were stained with primary antibodies for surface proteins F4/80, CD11b, CX3CR1, CCR2, CD11c, Ly6C, CD49b and MHC II. (A-F) Representative histograms for F4/80lo (blue) and F4/80hi (green) ATMs from db/db mice are provided, and (G, H) the median fluorescence intensities (MFIs) for both lean and obese mice were statistically analyzed. Data points with different asterisks indicate a statistically significant difference (P<0.05).
In both the lean and obese groups, the F4/80hi ATMs expressed more CX3CR1, CD11c, CD49b, and MHC II. Of these markers, CD11c has been consistently reported to be upregulated in macrophages infiltrating WAT and is viewed as a characteristic of pro-inflammatory macrophages [21; 22]. CCR2 is another marker which has also been heavily implicated in the pathogenesis of obesity-induced insulin resistance [5]. We found that CCR2 was expressed more highly in F4/80hi than F4/80lo ATMs of obese mice, but there were no significant differences found in the lean mice. These differences were the result of a decrease in the CCR2 MFI of F4/80lo ATMs from lean to obese rather than an increase in F4/80hi CCR2 expression.
3.4. Heterogeneity in the F4/80lo population
In our analyses, we noted a population of Ly6Chi cells in the F4/80lo population that was not present in the F4/80hi subset (Fig. 3G). Because high levels of Ly6C have been linked to a pro-inflammatory subtype of monocytes [23], we performed a more detailed analysis of this Ly6Chi population of F4/80lo ATMs to the remainder of the population (Fig. 4). In both lean and obese mice, Ly6ChiF4/80lo cells comprised of approximately one-fifth of the total F4/80lo population (Fig. 4C). The Ly6ChiF4/80lo cells were also CCR2hi and also expressed significantly higher levels of CCR7 than the other F4/80lo ATMs (Fig. 4D).
Fig. 4.
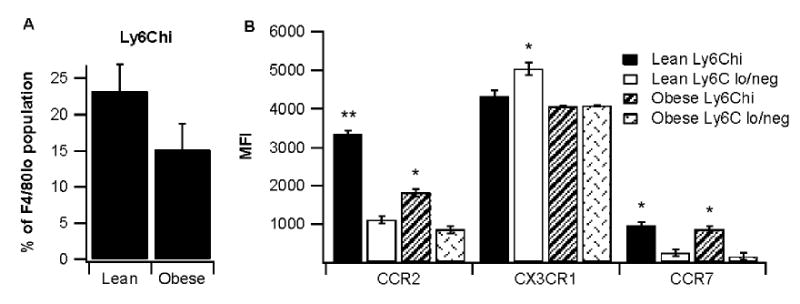
Heterogeneity in the F4/80lo population. Ly6ChiF4/80lo adipose tissue macrophages (ATM) in lean and obese db/db mice were analyzed for alongside F4/80loLy6Clo/neg ATMs. (A) The percent of Ly6Chi ATM and (B) the average median fluorescence intensities (MFIs) for chemokine receptors CCR2, CX3CR1, and CCR7 for both subsets were assessed. Data points with different asterisks indicate a statistically significant difference (P<0.05).
3.5. Cytokine production in F4/80lo and F4/80hi ATMs
We also examined differences in cytokine production between the F4/80hi and F4/80lo ATMs between obese and lean mice, and following ex vivo LPS stimulation. For this analysis, we measured intracellular TNF-α, IL-6, MCP-1, and IL-10. In the obese mice, TNF-α, MCP-1 and IL-10 were all significantly upregulated and produced in greater quantity in the F4/80hi ATMs in comparison to F4/80lo ATMs (Fig. 5). Interestingly, IL-6 was produced in greater quantity in ATMs of lean mice than in those of the obese mice. We also investigated cytokine secretion from the Ly6ChiF4/80lo population and found that production of all four cytokines were significantly lower when compared to the rest of the F4/80lo ATMs (data not shown). Moreover, stimulation of cytokine production by LPS was more pronounced in F4/80hi than in F4/80lo ATMs. Specifically, LPS-stimulated F4/80hi ATMs produced greater amounts of IL-6, MCP-1, TNF-α, and IL-10 than LPS-stimulated F4/80lo ATMs (Fig. 6).
Fig. 5.
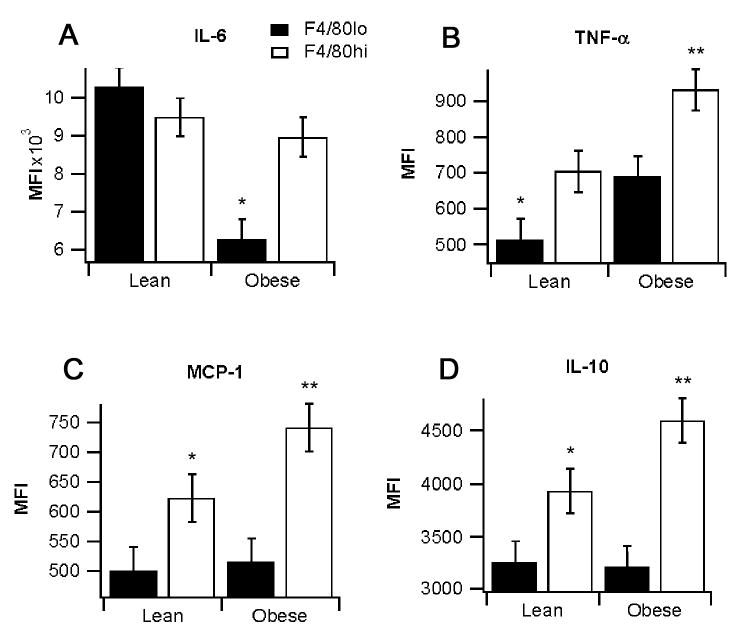
Cytokine production in F4/80lo and F4/80hi adipose tissue macrophages (ATMs). The average median fluorescence intensity (MFI) for (A) interleukin-6 (IL-6), (B) tumor necrosis factor α (TNF-α) (C) monocyte chemoattractant protein-1 (MCP-1), and (D) interleukin-10 (IL-10) for F4/80lo and F4/80hi ATMs in lean and obese mice was determined. Data points with different asterisks indicate a statistically significant difference (P<0.05).
Fig. 6.
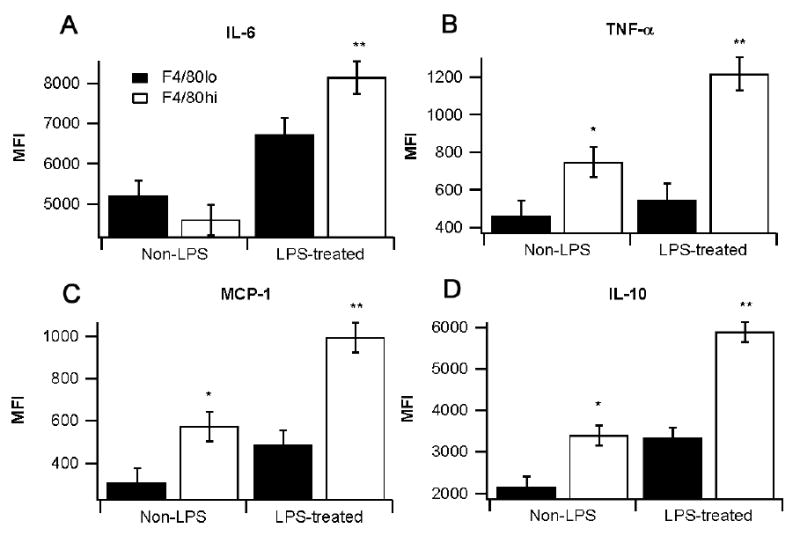
Effect of lipopolysaccharide (LPS) stimulation on intracellular cytokine production by F4/80lo and F4/80hi adipose tissue macrophages (ATMs). The average median fluorescence intensity (MFI) for (A) interleukin-6 (IL-6), (B) tumor necrosis factor α (TNF-α) (C) monocyte chemoattractant protein-1 (MCP-1), and (D) interleukin-10 (IL-10) for F4/80lo and F4/80hi ATMs in lean and obese mice was determined. Data points with different asterisks indicate a statistically significant difference (P<0.05).
3.6. Gene expression analyses of sorted F4/80hi and F4/80lo ATMs
To gain a better insight on the differentially expressed genes in these two populations, CD11b-enriched stromal vascular cells were sorted to differentiate F4/80hi from F4/80lo ATMs. We found that TLR-4, TNF-α, PPAR γ, CD36 and PPAR δ were expressed in greater amounts in F4/80hi than in F4/80lo ATMs. In contrast, IL-4 was detectable only in F4/80lo ATMs (Fig. 7).
Fig. 7.
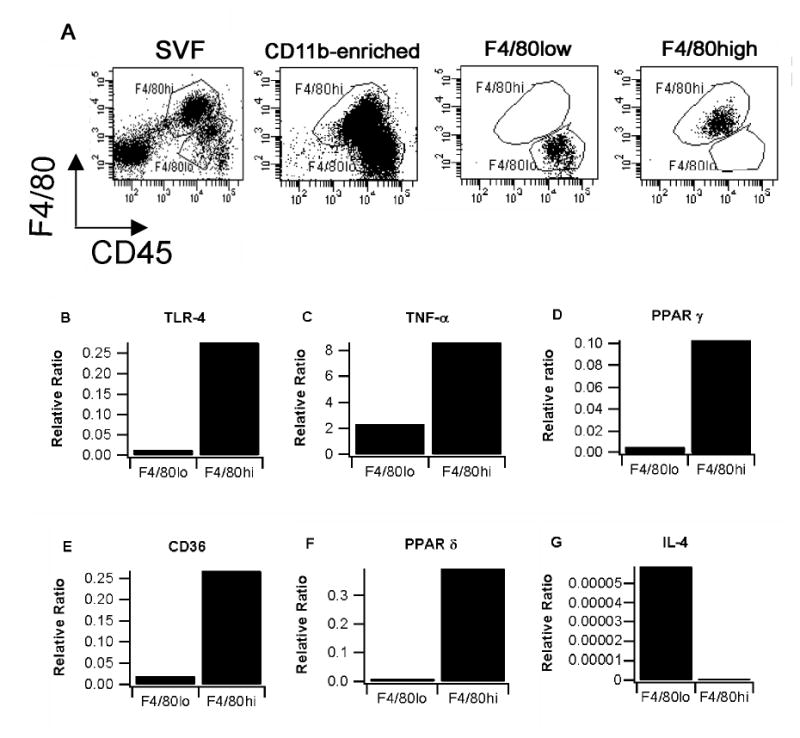
Sorting of F4/80lo and F4/80hi adipose tissue macrophages. Stromal vascular cells (SVCs) from 10 db/db mice were enriched for CD11b using magnetic beads, stained with F4/80 PE-Cy7 and CD45 APC-Cy7, and then sorted into F4/80lo and F4/80hi fractions (over 98% purity). (A) Representative dot plots for all cells in the stromal vascular fraction (SVF) of white adipose tissue, presorted through CD11b enrichment by magnetic sorting, FACS Aria sorted F4/80lo, and FACS Aria sorted F4/80hi ATM are depicted. Gene expression analyses on sorted population was performed for (B) toll-like receptor 4 (TLR-4), (C) tumor necrosis factor-α (TNF-α), (D) peroxisome proliferator-activated receptor γ (PPAR γ), (E) CD36, (F) PPAR δ, and (G) interleukin-4 (IL-4). Data were analyzed as a ratio to the housekeeping gene β-actin. Each bar represents gene expression analyses with the pooled RNA of F4/80lo and F4/80hi macrophages sorted from the visceral adipose tissue of 10 db/db mice.
3.7. M1 and M2 marker expression in WAT of PPAR γ-expressing and tissue-specific PPAR γnull mice with diet-induced obesity
We determined the effect of deleting PPAR γ in immune cells on the expression of M1 and M2 markers in white adipose tissue of mice with DIO. We demonstrate that the deficiency of PPAR γ in immune cells resulted in decreased expression of Arginase 1 and IL-13 in WAT while the M1 markers CCL1 and CCL17 were upregulated (Figure 8).
Fig. 8.

Effect of deleting PPAR γ in immune cells on the expression of chemokine (C-C motif) ligand 1 and 17 (M1 markers), Arginase 1 (M2 marker) and IL-13 in the white adipose tissue of mice with diet-induced obesity. PPAR γ fl/fl; MMTV-Cre+ (tissue-specific PPAR γ null mice) and PPAR γ fl/fl; MMTV-Cre- (floxed) littermate mice were fed high-fat diets for 28 weeks. Data are presented as least square means ± standard error of 10 observations. Data points with an asterisk are significantly different (P<0.05).
4. Discussion
Macrophage infiltration into adipose tissue is a hallmark of obesity-induced insulin resistance. While the heterogeneity of macrophage subsets in inflamed and or infected tissues has been studied for a number of years [24], little is known about the nature of the heterogeneity of ATM during obesity. For instance, it is well established that bone marrow-derived monocytes undergo distinctive pathways of differentiation in response to cytokines leading to the generation of at least four functional subsets of macrophages. M1 or classically activated macrophages were characterized in the 1960s as responsive to IFN-γ, pro-inflammatory cytokines and bacterial products such as LPS and generate CCL1, CCL17, TNF-α [25; 26; 27]. M2 or alternatively activated have been classified according to phenotypic, molecular and functional effects in response to cytokines into three functional subsets: M2a, also known as wound-healing macrophages [28], are induced by IL-4 and IL-13, express arginase 1, Ym1, Fizz1, stabilin-1, CD163, fibronectin-1, and mannose receptor 2C, trigger an immune response required to fight parasites but can also trigger allergies and asthma; M2b are induced by immune complexes and agonists of toll-like receptors (TLR) or IL-1 receptors; and M2c, deactivated or regulatory macrophages are induced by IL-10 and glucocorticoids and secrete IL-10. Whereas the M1 macrophages are involved in immune responses against intracellular pathogens and are pro-inflammatory, the M2 macrophage subsets are immune modulators (M2a and M2c), elicit anti-inflammatory effects and are involved in tissue remodeling [29; 30]. However, with a few exceptions [31], most obesity studies lack a detailed characterization of the macrophage sub-populations accumulating in metabolic tissues. Characterizing the heterogeneity of ATMs in relation to obesity-related inflammation is important because the improved understanding of their phenotype and function may yield new insights for treating or preventing obesity-related complications such as diabetes and heart disease.
F4/80 is a glycoprotein that increases as macrophages mature [32], and CD11b is an alpha integrin highly expressed on monocytes, macrophages, and involved in extravasation and phagocytosis [33]. We reported for the first time two subpopulations of F4/80+CD11b+ ATMs which differed in F4/80 surface concentrations (e.g., F4/80hi and F4/80lo) [12; 13]. Accumulation of F4/80hi, but not F4/80lo, macrophages in adipose tissue was decreased by administration of a naturally occurring PPAR γ agonist. Furthermore, the suppressed accumulation of F4/80hi ATM was associated with improved insulin sensitivity [12]. Here, we demonstrate that while F4/80lo ATM predominate in fat of lean mice, both the F4/80lo and F4/80hi populations are increased in adipose tissue of genetically obese mice and mice with diet-induced obesity and their accumulation is linked to adiposity. The increase in F4/80hi macrophages is in line with a recent report showing that obesity is associated with accumulation of F4/80+CD11c+ ATM [22]. Moreover, we find an overall increase in production of ATM-derived cytokines during obesity in both F4/80lo and F4/80hi ATM. Interestingly, ATMs secrete more pro- and anti-inflammatory cytokines than monocyte-derived macrophages following LPS stimulation [34]. However, little progress has been made in phenotypically and functionally characterizing the ATM subsets that infiltrate the WAT during obesity.
We demonstrate that F4/80hi macrophages accumulate in the adipose tissue of obese mice and express greater levels of CD11c, CX3CR1, CD49b, and MHC II than F4/80lo ATM both in lean and obese mice. CD11c is characteristically expressed in infiltrating, pro-inflammatory macrophages while MHC class-II expression was decreased in adipose tissue of CCR2 knockout mice, which are protected from obesity-induced inflammation [21; 22; 35]. MHC II is upregulated in both classically and alternatively activated macrophages [36]. CD49b is an integrin involved in monocyte attachment and migration through collagen in type 2 diabetes [37]. Rare alleles in the α2 integrin gene encoding CD49b are associated with protection from carotid atherosclerosis in diabetes patients [38]. CX3CR1 is a chemokine receptor for fratalkine/CX3CL1 highly expressed on mouse Ly6Clo monocytes [39] corresponding to human CD16+ monocytes which are generally referred to as proinflammatory monocytes [40; 41]. F4/80hi ATM were more responsive to LPS stimulation (e.g., cytokine production) than F4/80lo ATM. Altogether these findings suggest that F4/80hi ATM correspond to a pro-inflammatory phenotype. Moreover, the enhanced expression of PPAR γ in F4/80hi ATM suggests the existence of an intrinsic self-regulatory mechanism to dampen inflammation.
As opposed to the F4/80hi ATM, IL-4 mRNA expression was increased in sorted F4/80lo ATMs. IL-4 is a cytokine that induces macrophages to differentiate into an M2 phenotype. However, our data also indicate that about 20% of F4/80lo ATMs express CCR2, TNF-α, and IL-6, which is not consistent with an M2a fate. Further phenotypic analyses revealed that CCR2 and CCR7 were mainly expressed on a subset of F4/80loLy6Chi cells whereas CX3CR1 expression was greater in F4/80loLy6Clo cells from lean mice. Ly6C expression decreases as monocytes mature into macrophages and is present at high levels on a subclass of monocytes which have been implicated in the pathogenesis of atherosclerosis [23]. Mouse Ly6C+ monocytes phenotypically resemble human CD14+ cells [40]. In this regard, CD14+CD206+CD16- ATMs increase in adipose tissue of patients with increased adiposity and exhibit a remodeling phenotype consistent with the wound healing macrophage subset [28; 31].
PPAR γ negatively regulates macrophage [42] and T helper 1 cell function, while enhancing regulatory T cell (Treg) anti-inflammatory activity [43]. A series of recent papers [14; 15; 16; 17] are consistent with the notion that PPAR γ and δ promote regulation while suppress inflammation. Kang and colleagues demonstrated that adipocytes are a source of IL-4 and IL-13, which in a paracrine fashion induce macrophage PPAR δ expression and thereby favor M2 polarization [16]. Here we show for the first time that sorted F4/80hi ATM express greater concentrations of PPAR γ, δ and the PPAR γ-responsive gene CD36, a gene that is also expressed by human CD14+ ATM [44], in comparison with F4/80lo ATM. We also demonstrate that the deletion of PPAR γ in immune cells results in a marked upregulation of the M1 marker CCL17 (the ligand for CCR4) and suppression of the M2 marker arginase 1 in the white adipose tissue of mice with diet-induced obesity, suggesting a predominance of M1 differentiation in the absence of PPAR γ signaling.
In conclusion, our data confirm the presence of two phenotypically and functionally distinct subsets of macrophages in adipose tissue (F4/80hi and F4/80lo) associated with obesity. We demonstrate that the F4/80hi subset exhibits an enhanced ability to produce pro-inflammatory cytokines and PPAR γ whereas the F4/80lo subset expresses IL-4 and produces lower concentrations of cytokines. Our results establish links between the heterogeneity of ATM subsets and differential expression of PPAR γ and δ. Moreover, we show that the deletion of PPAR γ in immune cells results in enhanced expression of M1 and suppressed expression of M2 markers in WAT. Altogether, these results open up targeted therapeutic approaches against obesity-related inflammation and insulin resistance. Clinically, further studies are needed to characterize the heterogeneity of human ATMs in relation to essential features of PPAR γ- and δ-controlled networks involved in macrophage differentiation and function.
Acknowledgments
We are deeply grateful to Ms. Melissa Makris for helping with the cell sorting experiments. Supported by a grant from the National Center for Complementary and Alternative Medicine at the National Institutes of Health (5R01AT4308 to J.B.-R.), European Commission grant number 224836, the Ramon y Cajal program and funds from the Nutritional Immunology and Molecular Nutrition Laboratory.
Footnotes
Publisher's Disclaimer: This is a PDF file of an unedited manuscript that has been accepted for publication. As a service to our customers we are providing this early version of the manuscript. The manuscript will undergo copyediting, typesetting, and review of the resulting proof before it is published in its final citable form. Please note that during the production process errors may be discovered which could affect the content, and all legal disclaimers that apply to the journal pertain.
References
- 1.Ogden CL, Carroll MD, Curtin LR, McDowell MA, Tabak CJ, Flegal KM. Prevalence of overweight and obesity in the United States, 1999-2004. JAMA. 2006;295:1549–55. doi: 10.1001/jama.295.13.1549. [DOI] [PubMed] [Google Scholar]
- 2.Flegal KM, Graubard BI, Williamson DF, Gail MH. Cause-specific excess deaths associated with underweight, overweight, and obesity. JAMA. 2007;298:2028–37. doi: 10.1001/jama.298.17.2028. [DOI] [PubMed] [Google Scholar]
- 3.Weisberg SP, McCann D, Desai M, Rosenbaum M, Leibel RL, Ferrante AW., Jr Obesity is associated with macrophage accumulation in adipose tissue. J Clin Invest. 2003;112:1796–808. doi: 10.1172/JCI19246. [DOI] [PMC free article] [PubMed] [Google Scholar]
- 4.Xu H, Barnes GT, Yang Q, Tan G, Yang D, Chou CJ, Sole J, Nichols A, Ross JS, Tartaglia LA, Chen H. Chronic inflammation in fat plays a crucial role in the development of obesity-related insulin resistance. J Clin Invest. 2003;112:1821–30. doi: 10.1172/JCI19451. [DOI] [PMC free article] [PubMed] [Google Scholar]
- 5.Weisberg SP, Hunter D, Huber R, Lemieux J, Slaymaker S, Vaddi K, Charo I, Leibel RL, Ferrante AW., Jr CCR2 modulates inflammatory and metabolic effects of high-fat feeding. J Clin Invest. 2006;116:115–24. doi: 10.1172/JCI24335. [DOI] [PMC free article] [PubMed] [Google Scholar]
- 6.Kamei N, Tobe K, Suzuki R, Ohsugi M, Watanabe T, Kubota N, Ohtsuka-Kowatari N, Kumagai K, Sakamoto K, Kobayashi M, Yamauchi T, Ueki K, Oishi Y, Nishimura S, Manabe I, Hashimoto H, Ohnishi Y, Ogata H, Tokuyama K, Tsunoda M, Ide T, Murakami K, Nagai R, Kadowaki T. Overexpression of monocyte chemoattractant protein-1 in adipose tissues causes macrophage recruitment and insulin resistance. J Biol Chem. 2006;281:26602–14. doi: 10.1074/jbc.M601284200. [DOI] [PubMed] [Google Scholar]
- 7.Kanda H, Tateya S, Tamori Y, Kotani K, Hiasa K, Kitazawa R, Kitazawa S, Miyachi H, Maeda S, Egashira K, Kasuga M. MCP-1 contributes to macrophage infiltration into adipose tissue, insulin resistance, and hepatic steatosis in obesity. J Clin Invest. 2006;116:1494–505. doi: 10.1172/JCI26498. [DOI] [PMC free article] [PubMed] [Google Scholar]
- 8.Tuncman G, Hirosumi J, Solinas G, Chang L, Karin M, Hotamisligil GS. Functional in vivo interactions between JNK1 and JNK2 isoforms in obesity and insulin resistance. Proc Natl Acad Sci U S A. 2006;103:10741–6. doi: 10.1073/pnas.0603509103. [DOI] [PMC free article] [PubMed] [Google Scholar]
- 9.Yuan M, Konstantopoulos N, Lee J, Hansen L, Li ZW, Karin M, Shoelson SE. Reversal of obesity- and diet-induced insulin resistance with salicylates or targeted disruption of Ikkbeta. Science. 2001;293:1673–7. doi: 10.1126/science.1061620. [DOI] [PubMed] [Google Scholar]
- 10.Arkan MC, Hevener AL, Greten FR, Maeda S, Li ZW, Long JM, Wynshaw-Boris A, Poli G, Olefsky J, Karin M. IKK-beta links inflammation to obesity-induced insulin resistance. Nat Med. 2005;11:191–8. doi: 10.1038/nm1185. [DOI] [PubMed] [Google Scholar]
- 11.Davis JE, Gabler NK, Walker-Daniels J, Spurlock ME. Tlr-4 deficiency selectively protects against obesity induced by diets high in saturated fat. Obesity (Silver Spring) 2008;16:1248–55. doi: 10.1038/oby.2008.210. [DOI] [PubMed] [Google Scholar]
- 12.Guri AJ, Hontecillas R, Ferrer G, Casagran O, Wankhade U, Noble AM, Eizirik DL, Ortis F, Cnop M, Liu D, Si H, Bassaganya-Riera J. Loss of PPAR gamma in immune cells impairs the ability of abscisic acid to improve insulin sensitivity by suppressing monocyte chemoattractant protein-1 expression and macrophage infiltration into white adipose tissue. J Nutr Biochem. 2008;19:216–28. doi: 10.1016/j.jnutbio.2007.02.010. [DOI] [PubMed] [Google Scholar]
- 13.Bassaganya-Riera J, Ferrer G, Casagran O, Sanchez S, De Horna A, Duran E, Orpi M, Guri AJ, Hontecillas R. F4/80hiCCR2hi macrophage infiltration into the intra-abdominal fat worsens the severity of experimental IBD in obese mice with DSS colitis. e-SPEN The European e-Journal of Clinical Nutrition and Metabolism. 2009 doi: 10.1016/j.eclnm.2008.11.005. [DOI] [Google Scholar]
- 14.Odegaard JI, Ricardo-Gonzalez RR, Goforth MH, Morel CR, Subramanian V, Mukundan L, Eagle AR, Vats D, Brombacher F, Ferrante AW, Chawla A. Macrophage-specific PPARgamma controls alternative activation and improves insulin resistance. Nature. 2007;447:1116–20. doi: 10.1038/nature05894. [DOI] [PMC free article] [PubMed] [Google Scholar]
- 15.Stienstra R, Duval C, Keshtkar S, van der Laak J, Kersten S, Muller M. Peroxisome proliferator-activated receptor gamma activation promotes infiltration of alternatively activated macrophages into adipose tissue. J Biol Chem. 2008;283:22620–7. doi: 10.1074/jbc.M710314200. [DOI] [PubMed] [Google Scholar]
- 16.Kang K, Reilly SM, Karabacak V, Gangl MR, Fitzgerald K, Hatano B, Lee CH. Adipocyte-derived Th2 cytokines and myeloid PPARdelta regulate macrophage polarization and insulin sensitivity. Cell Metab. 2008;7:485–95. doi: 10.1016/j.cmet.2008.04.002. [DOI] [PMC free article] [PubMed] [Google Scholar]
- 17.Odegaard JI, Ricardo-Gonzalez RR, Red Eagle A, Vats D, Morel CR, Goforth MH, Subramanian V, Mukundan L, Ferrante AW, Chawla A. Alternative M2 activation of Kupffer cells by PPARdelta ameliorates obesity-induced insulin resistance. Cell Metab. 2008;7:496–507. doi: 10.1016/j.cmet.2008.04.003. [DOI] [PMC free article] [PubMed] [Google Scholar]
- 18.Bassaganya-Riera J, Reynolds K, Martino-Catt S, Cui Y, Hennighausen L, Gonzalez F, Rohrer J, Benninghoff AU, Hontecillas R. Activation of PPAR gamma and delta by conjugated linoleic acid mediates protection from experimental inflammatory bowel disease. Gastroenterology. 2004;127:777–91. doi: 10.1053/j.gastro.2004.06.049. [DOI] [PubMed] [Google Scholar]
- 19.Guri AJ, Hontecillas R, Si H, Liu D, Bassaganya-Riera J. Dietary abscisic acid ameliorates glucose tolerance and obesity-related inflammation in db/db mice fed high-fat diets. Clin Nutr. 2007;26:107–16. doi: 10.1016/j.clnu.2006.07.008. [DOI] [PubMed] [Google Scholar]
- 20.Zhou HR, Kim EK, Kim H, Claycombe KJ. Obesity-associated mouse adipose stem cell secretion of monocyte chemotactic protein-1. Am J Physiol Endocrinol Metab. 2007;293:E1153–8. doi: 10.1152/ajpendo.00186.2007. [DOI] [PubMed] [Google Scholar]
- 21.Brake DK, Smith EO, Mersmann H, Smith CW, Robker RL. ICAM-1 expression in adipose tissue: effects of diet-induced obesity in mice. Am J Physiol Cell Physiol. 2006;291:C1232–9. doi: 10.1152/ajpcell.00008.2006. [DOI] [PubMed] [Google Scholar]
- 22.Lumeng CN, Bodzin JL, Saltiel AR. Obesity induces a phenotypic switch in adipose tissue macrophage polarization. J Clin Invest. 2007;117:175–84. doi: 10.1172/JCI29881. [DOI] [PMC free article] [PubMed] [Google Scholar]
- 23.Swirski FK, Libby P, Aikawa E, Alcaide P, Luscinskas FW, Weissleder R, Pittet MJ. Ly-6Chi monocytes dominate hypercholesterolemia-associated monocytosis and give rise to macrophages in atheromata. J Clin Invest. 2007;117:195–205. doi: 10.1172/JCI29950. [DOI] [PMC free article] [PubMed] [Google Scholar]
- 24.Yona S, Gordon S. Inflammation: Glucocorticoids turn the monocyte switch. Immunol Cell Biol. 2007;85:81–2. doi: 10.1038/sj.icb.7100034. [DOI] [PubMed] [Google Scholar]
- 25.Khoo KK, Mackaness GB. Macrophage Proliferation in Relation to Acquired Cellular Resistance. Aust J Exp Biol Med Sci. 1964;42:707–16. doi: 10.1038/icb.1964.67. [DOI] [PubMed] [Google Scholar]
- 26.Mackaness GB. The Immunological Basis of Acquired Cellular Resistance. J Exp Med. 1964;120:105–20. doi: 10.1084/jem.120.1.105. [DOI] [PMC free article] [PubMed] [Google Scholar]
- 27.Miki K, Mackaness GB. The Passive Transfer of Acquired Resistance to Listeria Monocytogenes. J Exp Med. 1964;120:93–103. doi: 10.1084/jem.120.1.93. [DOI] [PMC free article] [PubMed] [Google Scholar]
- 28.Mosser DM, Edwards JP. Exploring the full spectrum of macrophage activation. Nat Rev Immunol. 2008;8:958–69. doi: 10.1038/nri2448. [DOI] [PMC free article] [PubMed] [Google Scholar]
- 29.Benoit M, Desnues B, Mege JL. Macrophage polarization in bacterial infections. J Immunol. 2008;181:3733–9. doi: 10.4049/jimmunol.181.6.3733. [DOI] [PubMed] [Google Scholar]
- 30.Martinez FO, Helming L, Gordon S. Alternative Activation of Macrophages: An Immunologic Functional Perspective. Annu Rev Immunol. 2008 doi: 10.1146/annurev.immunol.021908.132532. [DOI] [PubMed] [Google Scholar]
- 31.Bourlier V, Zakaroff-Girard A, Miranville A, De Barros S, Maumus M, Sengenes C, Galitzky J, Lafontan M, Karpe F, Frayn KN, Bouloumie A. Remodeling phenotype of human subcutaneous adipose tissue macrophages. Circulation. 2008;117:806–15. doi: 10.1161/CIRCULATIONAHA.107.724096. [DOI] [PubMed] [Google Scholar]
- 32.Lin HH, Faunce DE, Stacey M, Terajewicz A, Nakamura T, Zhang-Hoover J, Kerley M, Mucenski ML, Gordon S, Stein-Streilein J. The macrophage F4/80 receptor is required for the induction of antigen-specific efferent regulatory T cells in peripheral tolerance. J Exp Med. 2005;201:1615–25. doi: 10.1084/jem.20042307. [DOI] [PMC free article] [PubMed] [Google Scholar]
- 33.Mazzone A, Ricevuti G. Leukocyte CD11/CD18 integrins: biological and clinical relevance. Haematologica. 1995;80:161–75. [PubMed] [Google Scholar]
- 34.Zeyda M, Farmer D, Todoric J, Aszmann O, Speiser M, Gyori G, Zlabinger GJ, Stulnig TM. Human adipose tissue macrophages are of an anti-inflammatory phenotype but capable of excessive pro-inflammatory mediator production. Int J Obes (Lond) 2007;31:1420–8. doi: 10.1038/sj.ijo.0803632. [DOI] [PubMed] [Google Scholar]
- 35.Lumeng CN, Deyoung SM, Bodzin JL, Saltiel AR. Increased inflammatory properties of adipose tissue macrophages recruited during diet-induced obesity. Diabetes. 2007;56:16–23. doi: 10.2337/db06-1076. [DOI] [PubMed] [Google Scholar]
- 36.Gordon S. Macrophage heterogeneity and tissue lipids. J Clin Invest. 2007;117:89–93. doi: 10.1172/JCI30992. [DOI] [PMC free article] [PubMed] [Google Scholar]
- 37.Kostidou E, Koliakos G, Paletas K, Kaloyianni M. Monocyte attachment and migration through collagen IV in diabetes mellitus. Mol Cells. 2008;25:452–6. [PubMed] [Google Scholar]
- 38.Maeno T, Koyama H, Tahara H, Komatsu M, Emoto M, Shoji T, Inaba M, Miki T, Okuno Y, Nishizawa Y. The 807T allele in alpha2 integrin is protective against atherosclerotic arterial wall thickening and the occurrence of plaque in patients with type 2 diabetes. Diabetes. 2002;51:1523–8. doi: 10.2337/diabetes.51.5.1523. [DOI] [PubMed] [Google Scholar]
- 39.Gordon S, Taylor PR. Monocyte and macrophage heterogeneity. Nat Rev Immunol. 2005;5:953–64. doi: 10.1038/nri1733. [DOI] [PubMed] [Google Scholar]
- 40.Serbina NV, Jia T, Hohl TM, Pamer EG. Monocyte-mediated defense against microbial pathogens. Annu Rev Immunol. 2008;26:421–52. doi: 10.1146/annurev.immunol.26.021607.090326. [DOI] [PMC free article] [PubMed] [Google Scholar]
- 41.Geissmann F, Jung S, Littman DR. Blood monocytes consist of two principal subsets with distinct migratory properties. Immunity. 2003;19:71–82. doi: 10.1016/s1074-7613(03)00174-2. [DOI] [PubMed] [Google Scholar]
- 42.Ricote M, Li AC, Willson TM, Kelly CJ, Glass CK. The peroxisome proliferator-activated receptor-gamma is a negative regulator of macrophage activation. Nature. 1998;391:79–82. doi: 10.1038/34178. [DOI] [PubMed] [Google Scholar]
- 43.Hontecillas R, Bassaganya-Riera J. Peroxisome proliferator-activated receptor gamma is required for regulatory CD4+ T cell-mediated protection against colitis. J Immunol. 2007;178:2940–9. doi: 10.4049/jimmunol.178.5.2940. [DOI] [PubMed] [Google Scholar]
- 44.Curat CA, Miranville A, Sengenes C, Diehl M, Tonus C, Busse R, Bouloumie A. From blood monocytes to adipose tissue-resident macrophages: induction of diapedesis by human mature adipocytes. Diabetes. 2004;53:1285–92. doi: 10.2337/diabetes.53.5.1285. [DOI] [PubMed] [Google Scholar]