

Abstract
Background
Peroxynitrite (PN) is formed from superoxide and nitric oxide, both of which are increased during hepatic ethanol metabolism. Peroxynitrite forms adducts with proteins, causing structural and functional alterations. Here, we investigated PN-induced alterations in lysozyme structure and function, and whether they altered the protein’s susceptibility to proteasome-catalyzed degradation.
Methods
Hen egg lysozyme was nitrated using varying amounts of either PN or the PN donor, 3-morpholinosynonimine (SIN-1). The activity, nitration status and the susceptibility of lysozyme to proteasome-catalyzed degradation were assessed.
Results
Lysozyme nitration by PN or SIN-1 caused dose-dependent formation of 3-nitrotyrosine-lysozyme adducts, causing decreased catalytic activity, and enhanced susceptibility to degradation by the 20S proteasome. Kinetic analyses revealed an increased affinity by the 20S proteasome toward nitrated lysozyme compared with the native protein.
Conclusion
Lysozyme nitration enhances the affinity of the modified enzyme for degradation by the proteasome, thereby increasing its susceptibility to proteolysis.
General Significance
Increased levels of peroxynitrite have been detected in tissues of ethanol-fed animals. The damaging effects from excessive peroxynitrite in the cell increase hepatotoxicity and cellular death by protein modification due to nitration. Cellular defenses against such changes include enhanced proteolysis by the proteasome in order to maintain protein quality control.
Keywords: Peroxynitrite, Lysozyme, 20S Proteasome, Kinetics, Ethanol, Oxidative Stress
Introduction
Over eighty percent of the metabolism and detoxification of ethyl alcohol occurs in the liver [1]. Ethanol metabolism results in the formation of the highly reactive oxidation product, acetaldehyde as well as increased levels of reactive oxygen species [1]. Ethanol oxidation also causes an increase in the NADH:NAD+ ratio, which contributes to enhanced lipogenesis, and decreased fatty acid oxidation, ultimately resulting in fatty liver (steatosis) [2]. Alcohol-induced oxidative stress in the liver can lead to reversible (steatosis) which can eventually result in irreversible (cirrhosis) liver damage. Ethanol, if consumed excessively, causes liver injury through oxidative stress, increasing the production of reactive oxygen species and decreasing the liver’s ability to detoxify reactive intermediates or repair resulting damage. This happens in part because ethanol increases overall mitochondrial respiration, which is partially blocked due to inhibition of respiratory enzymes [1]. The latter results in a leakage of superoxide (O2−) from these organelles. Superoxide can subsequently react with nitric oxide (•NO), to produce the highly reactive radical, peroxynitrite [3, 4].
Peroxynitrite formation has been demonstrated in vivo in liver endothelial cells, Kupffer cells, hepatocytes, neutrophils, neurons, macrophages, and other cellular systems [5-9]. Peroxynitrite reacts with cysteine, tyrosine, methionine, and tryptophan residues of proteins and such interactions generally inhibit their catalytic activities [4], [10-12]. By reacting with tyrosyl residues, peroxynitrite forms the stable adduct, 3-nitrotyrosine (3-NT) [4], which can modify the activities of enzymes. Examples include matrix metalloproteinase-1 inhibitor, alcohol dehydrogenase, cytosolic glyceraldehyde-3-phosphate dehydrogenase, glutamine synthetase, aconitase, xanthine oxidase, creatine kinase, glutathione peroxidase, and succinate dehydrogenase, whose enzymatic activities are all decreased by peroxynitrite [13-20]. Other work has also demonstrated that peroxynitrite causes inactivation of key antioxidant enzymes, including glutathione peroxidase, glutathione reductase, and the manganese-dependent superoxide dismutase [21-23].
Based upon these previous studies, we hypothesized that nitration of proteins not only inactivates them but also alters their susceptibility to degradation by proteases. In the work described here, we explored the effects of the alcohol-induced secondary metabolite, peroxynitrite, to examine the modification of the protein, lysozyme and how this modification affects lysozyme’s vulnerability to proteolysis. Similar experiments were also conducted with proteins obtained from hepatoma cells, to determine whether an enhancement of proteolysis would be achieved in an environment that mimics that found in vivo. Lysozyme was used as our model protein because; 1) it is commercially available in highly purified form, 2) it has been thoroughly characterized [24, 25], containing three potentially reactive tyrosine residues, and 3) it has been extensively employed as a proteasome substrate [26-29]. The 20S proteasome, which was purified from rat liver or obtained commercially, was employed in assays because this form of the enzyme degrades about 25% of the damaged cellular proteins without their prior ubiquitylation [30]. Because the 20S proteasome is involved in the degradation of damaged intracellular proteins, and because protein nitration represents a significant form of protein damage, these in vitro studies were designed to determine the effect of nitration not only on proteolytic susceptibility, but also to examine how nitration affects proteasome-substrate interactions.
Materials and Methods
Materials
Chicken egg lysozyme, and peroxynitrite (PN; stored under nitrogen at −70°C) were both purchased from Calbiochem (San Diego, CA). 3-Morpholinosydnonimine, hydrochloride (SIN-1) was purchased from Invitrogen Corporation (Carlsbad, CA). The proteasome fluorogenic peptide substrate, N-succinyl-leucyl-leucyl-valyl-tyrosyl-7-amido-4-methycoumarin (suc-LLVY-AMC) and Sephadex G-100 were purchased from Sigma (St. Louis MO). Anti 3- nitrotyrosine was purchased from either Upstate (Billerica, MA) or Calbiochem (San Diego, CA). Anti-lysozyme, from Chemicon® International, (Temecula, CA) and ECL reagent from Pierce (Rockford, Il) were used for Western blot analyses. Tritiated-leucine (60 Ci/mmole), for metabolic labeling, was from GE Healthcare Bio-Sciences Corp. (Piscataway, NJ). HepG2 cells were obtained from the American Type Culture Collection (Manassas, VA).
Methods
Lysozyme Purification
Chicken egg lysozyme was further purified by gel filtration over Sephadex G-100. Fractions containing the purified protein were detected spectrophotometrically at 280 nm and by measuring lysozyme catalytic activity [31]. Briefly, lysozyme activity in column-purified fractions was determined by incubation of a portion of each fraction with suspensions of Micrococcus lysodeikticus at 37°C followed by measuring the time-dependent increase in absorbance at 450 nm [31-34]. Active enzyme fractions were pooled and stored at −70°C.
Nitration of Lysozyme by Peroxynitrite
A 0.25M potassium phosphate buffer (pH 7.0) [35] was used to dilute lysozyme to a working concentration of 2.25 mg/ml (158 μM). Peroxynitrite (PN; in 4.7% NaOH) was added to lysozyme at zero (no addition), approximately equimolar, and at 2-, 4-, 8-, 16-, 32-, 36- and 72-fold molar excesses with respect to the moles of lysozyme in the reaction mixture. Appropriate volumes of 4.7% NaOH were added to each reaction mix to equalize their final volume (1-2 ml), and final pH. Following a 10-minute incubation at room temperature, excess PN was separated from lysozyme by applying each mixture to a Sephadex G-25 (PD-10) column with a 5000 Mr exclusion limit (Amersham), equilibrated in 0.1M potassium phosphate (pH 7.0). The degree of lysozyme nitration was determined immunochemically after SDS-PAGE followed by Western blot analysis, using antibody against 3-nitrotyrosine. Three-nitrotyrosine adduct formation in lysozyme was also detected spectrophotometrically at 245 nm (determined empirically by wavelength scanning) and at 412 nm [36-38]. An equal amount of lysozyme that was incubated without peroxynitrite was used as a blank at each wavelength [39].
Nitration of N-succinyl-leucyl-leucyl-valyl-tyrosyl-7-amido-4-methycoumarin (suc-LLVY-AMC)
suc-LLVY-AMC was diluted in a 0.1M potassium phosphate buffer (pH 7.0) to a final concentration of 158 μM (Mr = 763.88). PN was added to LLVY-AMC at zero, approximately equimolar, and at 2-, 8-, and 32- fold molar excesses under the same conditions as described for lysozyme, except that samples were incubated at room temperature for one hr, after which each reaction mixture was neutralized to pH 7.0 with 8 μl of 10N HCl, to enhance destruction of residual peroxynitrite. All samples were stored at 4°C overnight. A series of blank solutions, identical to the above-described solutions, except that suc-LLVY-AMC, was excluded from each, was prepared to ensure that the PN was destroyed and would not affect proteasome activity, as has been described elsewhere [40]. Nitration of LLVY-AMC was confirmed spectrophotometrically by the increase in absorbance as a function of peroxynitrite concentration at 245 nm and 412 nm.
Nitration of Lysozyme by 3-morpholinosydnonimine (SIN-1)
Using a 0.25M potassium phosphate buffer (pH 7.0) lysozyme was diluted to a working concentration of 2.25 mg/ml (158 μM). SIN-1 was dissolved in water to a concentration of 48.4mM and was added to lysozyme at zero (no addition), equimolar, and at 2-, 4-, 8-, 16-, 32-, and 64- fold molar excesses with respect to the moles of lysozyme in the reaction mixture. Appropriate volumes of water were added to each reaction mix to equalize their final volume to 1 ml. Following a 20-hour incubation at 37°C, excess SIN-1 was separated from lysozyme by applying each mixture onto a Sephadex G-25 column equilibrated in 0.1M potassium phosphate (pH 7.0). The degree of lysozyme nitration was determined using the same analyses as lysozyme nitrated with peroxynitrite.
Nitration of Radiolabeled Cellular Proteins
HepG2 cells were grown in Dulbecco’s Modified Eagle’s Medium (DMEM), 10% fetal bovine serum, and penicillin/streptomycin (100 units/ml/100 ug/ml, respectively) and were placed in a 5% CO2 atmosphere until the cells reached a density of 1×10⁶ to 1.5×10⁶ per 25 cm2 flask. Cells were radiolabeled 12-14 hr in serum-free, leucine-free DMEM containing [3H]leucine (2 μCi/ml). Cells were twice rinsed with phosphate-buffered saline (PBS), scraped into 2 ml of PBS, and centrifuged at 110 × g for 3 minutes. The cell pellet was resuspended in 0.5 ml PBS and sonicated (output of 3.5; duty cycle of 35). The cell lysates were centrifuged at 7,000 × g for 10 min, and supernatants were stored at -70°C. Lysate protein concentration was determined using the Bradford protein assay as modified by the manufacturer (Bio-Rad Laboratories) [41]. Peroxynitrite (PN) was added to radiolabeled cellular proteins in the same manner in which it was added to lysozyme, except that an average cellular protein molecular weight of 50 kDa was assumed [42]. Nitration of the proteins was verified by slot blot analysis using anti-3-nitrotyrosine.
SIN-1 Treatment of HepG2 cells: HepG2 cells were grown in Dulbecco’s Modified Eagle’s Medium (DMEM), as previously mentioned. Before SIN-1 treatment, cells were twice rinsed with PBS, and treated with various concentrations of SIN-1 (from zero to 200 uM) in 4 mls of serum-free DMEM for 24 hours. Cells were twice rinsed with PBS, scraped into 2 ml of PBS, and centrifuged at 110 × g for 3 minutes. The cell pellet was resuspended in 0.5 ml PBS and sonicated (output of 3.5; duty cycle of 35). The cell lysates were centrifuged at 7,000 × g for 10 min, and supernatants were assayed for protein degradation, and 20S proteasome activity. Lysate protein concentration was determined as before. Toxicity of SIN-1 was measured by leakage of lactate dehydrogenase into the extracellular medium, using a previously published procedure [43].
Proteasome Purification
Livers from chow fed rats (frozen or fresh) were homogenized in 100mM Tris-HCl pH 7.5 containing 0.25M sucrose, using a blender. The 20S proteasome was purified according to Beyette et al. [44]. The purity of the final product (20S proteasome) was determined by Coomassie Blue staining following electrophoresis of the purified enzyme under reducing conditions in the presence of SDS (SDS-PAGE) [45]. Prominent bands located between 20-33 kDa (Mr range of 20S proteasome subunits) with few to no other visible protein bands indicated that the purified enzyme was 91 to 98% homogeneous as determined by densitometry and calculated as a percent of the total purified product (Fig 1). Western Blot analysis using anti-subunit Rtp3 (S6b) a component of the 19S particle of the 26S proteasome (Affiniti Research Products, Mamhead, United Kingdom), was used to determine the amount of 26S proteasome in this preparation. Based on densitometric analysis, the 26S form of the enzyme was less than 10%, of the final 20S purified proteasome. The same analysis of commercially prepared 20S proteasome (Boston Biochem) revealed no visible signs of contamination by the 26S form.
Figure 1.
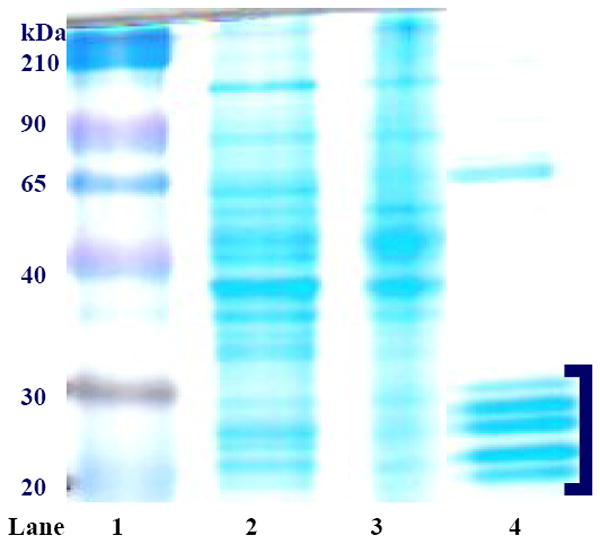
Coomassie Blue-stained liver proteins after SDS-PAGE from various stages of proteasome purification. Lane 1 is molecular weight standard, lane 2 is crude cytosol, lane 3 is the resolublized proteasome pellet, and lane 4 is pooled HIC column-purified sample. 20S proteasome subunits are identified as bands that migrate between 20-33 kDa, as indicated by the bracket.
Measurement of Proteasome Peptidase Activity
Chymotrypsin-like proteasome peptidase activity was determined at 37°C, using a final concentration of 13 μM N-succinyl-leu-leu-val-tyr-7-amido-4-methycoumarin (suc-LLVY-AMC) in the standard assay in a reaction mixture containing 0.1 M Tris-HCl, pH 7.5. The enzyme was incubated at 37°C with suc-LLVY-AMC in 96-well black plates (Optiplates, Perkin Elmer, Waltham, MA). Fluorescence of released AMC, the hydrolysis product of the reaction, was measured at an excitation wavelength of 355 nm and an emission wavelength of 460 nm at 15-minute intervals during incubation for up to one hr. One unit of proteasome activity catalyzes the formation of one nmole AMC per hr. Specific activity was units per mg protein. In kinetic experiments, we used increasing amounts (zero to 100 μM) of suc-LLVY-AMC in the presence and absence of native and nitrated lysozyme.
SDS-PAGE and Immunoblotting
Three to ten μg samples of both untreated and nitrated lysozyme were individually subjected to SDS-PAGE in 12% polyacrylamide gels. Proteins were electrophoretically transferred from the gels to 2 μm nitrocellulose membranes (BioRad, Hercules, CA) and the membranes were incubated with anti-3 nitrotyrosine antibody followed by washing and incubation with horseradish peroxidase (HRP)-conjugated goat anti-mouse IgG (Pierce, Rockford, IL) and then exposed to x-ray film following reaction with ECL reagent. After stripping the membranes in buffer containing 0.07M Tris-HCl (pH 6.7), 0.07M SDS, and 80mM β-mercaptoethanol) at 50°C, followed by washing and re-blocking, immunoreactive lysozyme was detected on the same membrane using anti-lysozyme in the same manner as described above for anti-3NT. Primary antibody was incubated with membranes at 4°C overnight, followed by three 10-minute washes in 1 mM Tris-HCl-buffered saline (pH 7.4) containing 0.05% (v/v) Tween 20 (TBST). Secondary antibody was incubated for 30 minutes at room temperature followed by two washes in TBST and one wash in TBS for 10 minutes each. All blots were developed as described above, using ECL reagent. Intensity of all immunoreactive protein bands was quantified by densitometry using the Quantity One program from BioRad (Hercules, CA).
Fluorescamine Assay for Quantification of Protein Degradation
Sixty μg of native and nitrated lysozyme samples were incubated with 0.5 μg proteasome in 0.05 M Hepes buffer (pH 7.5) in a final volume of 0.5 ml at 37° C. At different time points (3, 6, 12, and 24 hours), aliquots were removed from the reaction mixture. Protein was precipitated using 1/10 volume of 100 percent (w/v) trichloroacetic acid (TCA). After centrifugation at 1,000 × g for 15 minutes; the pH of a 500 μl aliquot of supernatant was adjusted to approximately 9 using 10N NaOH. Borate buffer (50mM, 1.5ml) (pH 9) was added followed by 1 ml of fluorescamine (0.3 mg/ml, dissolved in acetone), which was added to detect primary amines as an indicator of protein degradation. Samples were quantified against a glycine standard, and fluorescence was measured at an excitation wavelength of 390nm and an emission wavelength of 480nm [46]. Data are expressed as nanomoles of glycine equivalents.
Radiolabeled Cellular Protein Degradation Assay
After incubation alone (no enzyme) or with the rat liver proteasome preparation for 14-16 hrs in PBS, radiolabeled cellular protein degradation was determined by TCA precipitation, followed by centrifugation of undegraded proteins. A portion of the supernatant was removed to determine acid-soluble radioactivity, to quantify the products of degradation. The insoluble protein pellet was dissolved in 1N NaOH and counted to quantify radioactivity in the undegraded fraction. Radioactivity was quantified as counts per minute (cpm) by liquid scintillation spectroscopy. Percent degradation was calculated as:
Data Expression and Analysis
Data are expressed as mean values ± S.D or SE Statistical analyses between individual groups were performed using Student’s t test. For multiple comparisons, the one-way analysis of variance (ANOVA) and Newman-Keuls post hoc analysis were utilized. A probability (P) value of 0.05 or less was considered statistically significant.
Results
Alteration of Lysozyme by Peroxynitrite
Using the model protein, lysozyme, we investigated the alterations to this protein after nitration by PN at various doses. Compared with untreated enzyme (without PN), we observed a significant decrease in lysozyme catalytic activity at 4, 8, and 16-fold molar excesses of PN to lysozyme, at which there were two to three fold decreases in the lysozyme specific activity, compared with untreated enzyme (Fig 2A). Spectrophotometric analyses, performed at 412 nm, revealed that, as peroxynitrite concentration increased, absorbance at 412 nm increased in a dose-dependent manner, compared with that of untreated lysozyme (Fig 2B). Further verification of lysozyme nitration was revealed by Western blot analysis on un-nitrated and nitrated lysozyme, using an antibody to 3-nitrotyrosine, and normalized to the amount of immunoreactive (14.2 kDa) lysozyme, loaded onto the gel. There was a dose-dependent rise in 3-nitrotyrosine adduct formation on lysozyme with increasing molar ratios of peroxynitrite to lysozyme (Fig 2C). A band that migrated at about 25 kDa and was detectable with both anti-3-NT and with anti-lysozyme became increasingly visible (indicated by arrow) as the molar ratio of peroxynitrite to lysozyme increased. The appearance of this protein “dimer” may be due, in part, to protein aggregation caused by PN nitration.
Figure 2.


Panel A: Catalytic activity of native and nitrated lysozyme after treatment with PN. Data are from 6 separate treatments of lysozyme and are mean values ± standard deviation. Asterisk (*) indicates a significant (p ≤ 0.05) difference in activity between un-nitrated sample and PN-treated samples. Panel B: Spectrophotometric measurement at 412 nm of lysozyme following treatment with increasing molar ratios of peroxynitrite to lysozyme. Assays were performed each time after lysozyme was nitrated. Two representative experiments were combined. Blank was un-nitrated lysozyme. Panel C: Representative Western blot of purified lysozyme following reaction with increasing molar ratios of peroxynitrite to lysozyme as indicated under each lane. Arrow indicates lysozyme aggregate at 25kDa.
Enhancement by Nitration of Susceptibility to Degradation by 20S Proteasome
We determined whether PN-altered lysozyme exhibited changes in susceptibility to degradation by the 20S proteasome. Degradation experiments were performed on native and nitrated lysozyme, using rabbit 20S proteasome from Boston Biochem or 20S rat liver proteasome (Fig 3). Compared with unmodified lysozyme, nitrated lysozyme incubated with proteasome showed about a 2-fold increase in the rate of degradation at a 4-fold molar excess of PN to lysozyme. This rate increased to 3.6-fold at 16-fold molar excess of PN to lysozyme (Fig 3). To confirm that lysozyme was degraded by 20S proteasome, we incubated native lysozyme with the proteasome in the presence and absence of the enzyme inhibitor, MG-132 (10 μM) and observed little to no generation of fluorescamine reactive material (data not shown), which correlated with a 90% inhibition of proteasome chymotrypsin-like activity using suc-LLVY-AMC as the substrate (see Fig 5A).
Figure 3.
Fluorometric analysis of lysozyme degradation by proteasome. Data show the time course of lysozyme degradation after treatment of the enzyme with the indicated molar ratios of peroxynitrite to lysozyme. Asterisk indicates significance of p ≤ 0.05 between untreated and PN-treated samples. Experiments were performed in triplicate. Asterisk (*) indicates significant difference from 0x (untreated).
Figure 5.


Panel A: Effect of nitrated lysozyme on proteasome peptidase activity. Molar ratio of PN:Lysozyme is identified on the X-axis. Error bars indicate standard deviation. Asterisk (*) is significantly different from untreated enzyme; number sign (#) is significantly different from equimolar PN/lysozyme. Data are mean values of 4 experiments with 2 replicates per experiment. Panel B: 20S proteasome peptidolytic activities with untreated and indicated molar excesses of PN/lysozyme in the presence of various concentrations of suc-LLVY-AMC. Vmax and KM values for the samples are provided in the table below the figure. Data are a compilation of 4 experiments.
Next, we measured whether nitration affected the degradation of cellular proteins in a manner similar to lysozyme. We examined degradation by the 20S proteasome of radiolabeled proteins from HepG2 cells, to determine the proteolytic susceptibility of a cellular protein mixture (Fig 4A). These analyses revealed that, as their levels of nitration increased, metabolically labeled cellular proteins exhibited a general increase (up to 50 percent) in susceptibility to degradation. Degradation of radiolabeled cellular proteins by the proteasome generally increased with the extent of nitration, except when the molar ratio of PN to protein reached 16 fold, at which the rate of degradation dropped to control levels. We also examined degradation of SIN-1 modified HepG2 cell lysate proteins using fluorescamine assay and found that degradation was significantly increased over untreated cells by all SIN-1 treatments (Fig 4B). However, SIN-1 treatment at nearly all doses resulted in up to a 40% increase over control in the endogenous activity of the proteasome (Fig 4C). SIN-1 toxicity was found to be mild, causing only 4% leakage of LDH from the cells to the extracellular medium at 200 μM SIN-1 compared with untreated cells (data not shown).
Figure 4.


Panel A: Degradation of radiolabeled cellular proteins by 20S proteasome. Radiolabeled proteins from HepG2 cells were nitrated with increasing molar ratios of peroxynitrite to cell lysates (as indicated assuming an average protein molecular weight of 50,000). Samples were assayed for susceptibility to degradation by proteasome as described in Methods. Data are mean values (± SD) of 3 experiments with 2 replicates per experiment. Asterisk (*) shows significance of p ≤ 0.05 between untreated and PN-treated samples. Panel B: Protein degradation in cell lysates measured by fluorescamine assay following SIN-1 treatment of HepG2 cells. Data are mean values (± SD) of 2 experiments with 4replicates per experiment. Asterisk (*) shows significance of p ≤ 0.05 between untreated and SIN-1-treated samples. Panel C: Suc-LLVY-AMC hydrolysis by endogenous 20S proteasome in HepG2 cell lysates after treated with SIN-1 Data are mean values (± SD) of 3 experiments with 4 replicates per experiment. Asterisk (*) shows significance of p ≤ 0.05 between untreated and PN-treated samples.
Because the rate of lysozyme degradation and hepatic proteins was accelerated by exposure to PN, we examined whether the presence of native or nitrated lysozyme altered the chymotrypsin-like peptidase activity of proteasome. The latter was measured in the presence and absence of native and nitrated lysozyme, using suc-LLVY-AMC as the peptide substrate. A fixed concentration (3.6 μM) of native lysozyme or lysozyme previously exposed to increasing molar ratios of peroxynitrite, was added to each reaction mixture and suc-LLVY-AMC hydrolysis was measured (Fig 5A). Compared with proteasome incubated with 3.6μM native lysozyme, suc-LLVY-AMC hydrolysis by the proteasome decreased by 10% with 3.6μM lysozyme previously exposed to an equimolar level of PN. Further, proteasome peptidase activity was decreased by 40% after incubation with 3.6μM lysozyme exposed to a 4-fold molar excess of PN. Incubation with lysozyme exposed to a 16-fold excess if PN caused a 65% decrease in peptidase activity expression, but no further decreases in activity were achieved with lysozyme exposed to higher molar excesses of PN beyond 16-fold. These decreases in suc-LLVY hydrolysis by nitrated lysozyme compared with a 90% decline of chymotrypsin-like peptidase activity by 10μM MG-132, a specific proteasome inhibitor (Fig 5A).
To determine whether lysozyme nitration altered its interaction with the 20S proteasome, the chymotrypsin-like peptidase activity of the proteasome was assayed in the presence of increasing concentrations of suc-LLVY-AMC in the presence or absence of 3.6 μM of the variously nitrated forms of lysozyme to ascertain the manner in which lysozyme altered the kinetic parameters (Km and/or Vmax) of the peptidase reaction. These analyses revealed that lower levels of lysozyme nitration (i.e. between equimolar and 4-fold molar excess) caused a dose-dependent decline in proteasome activity. However, further nitration at 16-fold molar excess or more of PN caused only minor changes in suc-LLVY-AMC hydrolysis. Calculation of the Michaelis constant revealed that the Km for suc-LLVY-AMC increased 2-fold over control with a 4-fold excess of PN to lysozyme and 2.3-fold with lysozyme exposed to a 8-fold molar excess of PN. Higher levels of nitration did not appreciably alter suc-LLVY-AMC affinity for the proteasome (Fig 5B). Because the Km for suc-LLVY increased due to inclusion of nitrated lysozyme in the reaction mixture, the nitrated protein effectively competed with suc-LLVY-AMC as a substrate for the proteasome and, with increasing nitration, became a “preferred” substrate for the enzyme, as evidenced by the decline in AMC release.
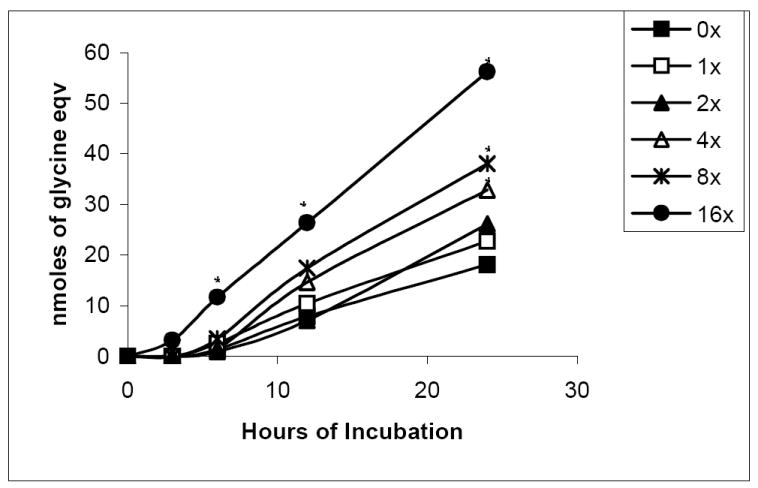
The data lead us to suggest that nitrated lysozyme is a preferred substrate compared with the fluorogenic peptide substrate. We further tested this by examining proteasome-catalyzed peptide hydrolysis, using nitrated suc-LLVY-AMC, which contains a single reactive tyrosine. We confirmed that nitration of suc-LLVY-AMC enhanced its hydrolysis by 20S proteasome. These measurements revealed a dose-dependent rise in the rate of suc-LLVY-AMC degradation as the molar ratio of peroxynitrite to suc-LLVY-AMC increased. The higher the level of PN nitrated suc-LLVY-AMC, the greater the initial rate of peptide hydrolysis, so that substrate depletion occurred more rapidly during the first 5-10 minutes of incubation (Fig 6).
Figure 6.

Time course of degradation of native and nitrated suc-LLVY-AMC peptide. 20S proteasome peptidolytic activities with untreated and nitrated suc-LLVY-AMC at a standard concentration of 13 μM. Data are representative of 3 experiments with 6 replicates per experiment.
By using SIN-1 to generate peroxynitrite more slowly, we examined lysozyme nitration that more closely resembles that which would occur in vivo thereby mimicking the metabolic generation of PN. After alcohol consumption, reactive oxygen species such as O2- increase in liver cells and combine with nitric oxide to produce PN [2]. SIN-1 generates •NO and O2- to produce peroxynitrite continually over time. Lysozyme catalytic activity was 30 percent lower than controls after treatment with a 64-fold molar excess of SIN-1. Spectrophotometric analysis of the untreated and SIN-1 treated lysozyme at 245 nm again showed a dose-dependent rise in absorbance (Fig 7A). This was consistent with a rise in the level of immunoreactive 3-NT protein. However, when we compared the anti-3NT immunoreactive proteins after SIN-1 treatment to that of PN treated enzyme, we found no detectable immunoreactive aggregates at 25 kDa after SIN-1 treatment even though the relative intensities of the immunoreactive protein at the highest doses of SIN-1 and PN differed by only 23%. Furthermore, the degree of lysozyme nitration was less with SIN-1 than it was with bolus doses of PN (Fig 7B).
Figure 7.
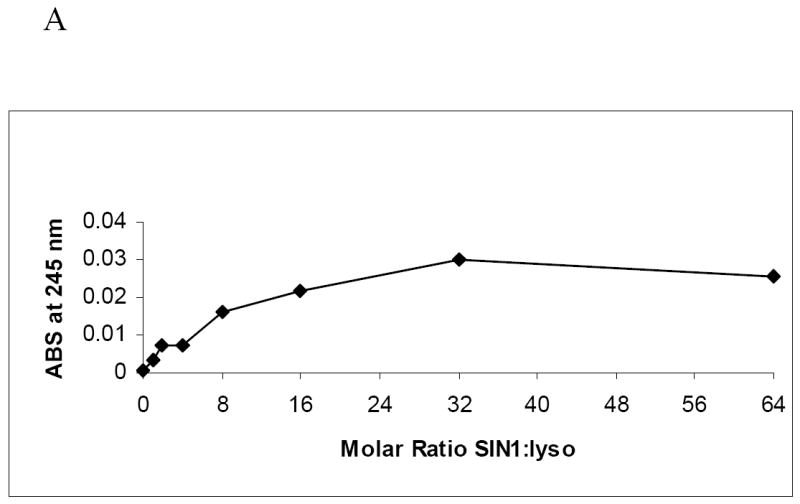


Panel A: Spectrophotometric measurement at 245 nm of lysozyme following treatment with increasing molar ratios of SIN-1 to lysozyme. Assays were performed each time after lysozyme was nitrated. Two representative experiments were combined. Blank was un-nitrated lysozyme. Panel B: Representative Western blot of purified lysozyme nitrated with SIN-1. Reactions with increasing molar ratios of SIN-1 to lysozyme as indicated under each lane. Arrows indicate lysozyme aggregate at 25kDa. Lysozyme nitrated with PN at 36 fold excess molar ratio was used for comparison (sample label on right end of gel separated by solid vertical line. Panel C: 20 S proteasome peptidolytic activities in the presence of SIN-1 untreated and treated lysozyme, and the indicated concentrations of suc-LLVY-AMC. Experiment was performed four times with 2 replicates each. Vmax and KM values for the samples are provided in the table below. The data are a compilation of 4 experiments.
Kinetic assays of peptidase activity in the presence of SIN-1 treated lysozyme (Fig 7C) showed a 1.4 to 2-fold decrease in the Vmax and a 2 to 3-fold increase in the Km between untreated lysozyme and all other treatments of lysozyme with SIN-1. This contrasted with the kinetic studies with bolus doses of peroxynitrite, which showed a more gradual decline (Fig 5B), beginning at a 4-fold molar excess PN to enzyme. SIN-1 treated lysozyme show no significant difference in kinetics among individual treatment groups, suggesting that the SIN-1 treated enzyme is a highly effective competitor to suc-LLVY-AMC for hydrolysis by the 20S proteasome.
Discussion
Changes in protein structure due to nitration have, in most cases, resulted in changes in protein function, often causing partial or complete loss of biological activity [12, 13, 47, 48]. Other investigators have demonstrated that glutathione peroxidase, manganese superoxide dismutase (SOD), and glutathione reductase are partially inactivated by peroxynitrite [21-23]. Consistent with these previous findings, we observed that, as the molar ratio of peroxynitrite to lysozyme increased, lysozyme catalytic activity significantly decreased (Fig 2A). Lee et al., published similar results, to show such a dose-dependent effect of PN on nitration of isocitrate dehydrogenase (ICDH). They also examined the activity of ICDH in vivo following ethanol administration and found that ICDH activity was significantly lower in livers of ethanol-fed rats than their pair-fed controls. This decrease was attributed to ethanol-elicited nitration of ICDH [49]. Grune et al reported that when mitochondrial aconitase was exposed to peroxynitrite at moderate levels (1.5 mM), its rate of degradation was increased by 50% compared with unexposed enzyme [30]. However, at higher PN levels, aconitase degradation declined [30]. Our studies with nitrated lysozyme, nitrated cellular proteins, and even nitrated peptide substrate (suc-LLVY-AMC) showed that there is generally increased susceptibility to proteasome-catalyzed degradation and that this was associated with the degree of nitration (Fig 3, 4A). Our findings with nitrated cellular proteins, however, did not consistently exhibit a dose-dependent rise in susceptibility to degradation (Fig 4A, 4B), as was observed with nitrated lysozyme. These latter results would be anticipated in view of the heterogeneity of protein targets modified by the oxidant, particularly a mixture of cellular proteins that have multiple targets on their primary structures. In addition, these latter measurements did not exclude the possibility that endogenous 20S proteasome in the cellular milieu may have contributed to degradation and that its activity may have been altered by peroxynitrite exposure, as reported previously by our laboratory [40].
Proteasome chymotrypsin-like peptidase activity, measured by cleavage of suc-LLVY-AMC, was significantly decreased in the presence of nitrated lysozyme (Fig 5A). These data, when combined with those showing enhanced degradation of nitrated lysozyme (Fig 3) lead us to suggest that the hydrolysis of suc-LLVY-AMC was negatively affected due to an increased affinity of the 20S proteasome for nitrated (damaged) lysozyme. When two substrates (nitrated lysozyme and suc-LLVY-AMC substrate) were simultaneously exposed to 20S proteasome, nitrated lysozyme was preferentially degraded, thereby preventing the hydrolysis of fluorogenic peptide, as demonstrated by the reduction in Vmax. The latter finding is rather remarkable, in view of the large difference in molecular weight between the two substrates. Data in Fig 5B show kinetic analysis to indicate competition between suc-LLVY-AMC and the modified lysozyme, and that the 20S proteosme preferentially associates with the damaged protein, as the amount of suc-LLVY-AMC required to obtain ½ Vmax increased, confirming that 20S proteasome had a greater affinity for PN-treated lysozyme than suc-LLVY-AMC. Additionally, the data (Fig 5A and 5B) also indicate that modification of lysozyme above a 16-fold molar excess of PN to lysozyme, proteasome peptidolytic activity was inhibited no further, to suggest that cleavage of nitrated lysozyme, had reached a maximum. The increased affinity of 20S proteasome for nitrated substrate is further demonstrated in Fig 6, showing a steady rise in peptidolytic activity as the PN to suc-LLVY-AMC molar excess increased, with a 4-fold increase in the rate of reaction between untreated substrate and that exposed to 32-fold molar excess of PN.
Along with protein nitration with bolus treatment with PN, we used the PN donor, SIN-1, which continuously generates PN in vitro, creating a model of “chronic exposure” to the nitrating agent. Lysozyme nitration with SIN-1 also increased lysozyme interaction with the 20S proteasome, compared with un-nitrated protein. However, we observed a difference in the decrease of suc-LLVY-AMC hydrolysis compared with bolus treatments with PN. In addition, SIN-1-mediated nitration caused little-to-no apparent dimerization of nitrated lysozyme as much as that, which occurred after PN treatment. The difference in proteolytic susceptibility of the substrate protein nitrated with either PN or SIN-1 to the 20S proteasome is reflected in the differential kinetics of protein nitration as a result of acute and chronic exposure to PN. It is conceivable that the lysozyme dimer at 25 kDa gives the 20S proteasome an additional substrate to degrade in the reaction mixture and it may account for the differential kinetics observed with the two sources of PN (compare Fig 5B and 7C).
Here, we have used an isolated system where we observed the effects of nitration to a single protein. We obtained results similar to Pucciarelli et al. who also found that tyrosine nitration in dihydrofolate reductase (DHFR) increases in response to peroxynitrite dose. However, they examined DHFR nitration in both the presence and absence of bicarbonate and showed that bicarbonate selectively enhances formation of 3-nitrotyrosine adducts in this protein [50]. As stated by Pucciarelli et al., during normal cellular respiration (CO2/O2 exchange) PN reacts with carbon dioxide to form the short-lived and highly reactive intermediate, nitrosoperoxycarbonate. They demonstrated that the reduction of DHFR activity by PN could be partially prevented by an increase in bicarbonate concentration [50]. It is likely that PN generated from SIN-1-treatments in HepG2 cells may have caused a similar increase in the formation of nitrosoperoxycarbonate, which modified cellular proteins there by contributing to enhanced proteolysis as depicted in Fig 4B.
Similarly, nitration that occurs after ethanol metabolism likely involves multiple cellular proteins, including the proteasome. In fact, when cells are exposed to SIN-1, not only substrate proteins, but also 20S proteasome, itself undergoes nitration as shown here. Interestingly, our laboratory revealed that 20S proteasome activity is biphasically affected by nitration in vivo [40]. Osna et al., reported that 20S proteasome activity is activated by low doses (10 to 100 μM) of peroxynitrite, unlike lysozyme, which lost activity after exposure to comparable doses (158 and 316 μM) of PN. Our experiments with HepG2 cells confirmed these results and further showed enhanced proteolysis of nitrated proteins in lysates of treated cells (Fig 4A and 4C). However, at higher levels of PN (1000 μM), 20S proteasome is inactivated [4]. Reduction or loss of proteasome activity compromises cellular quality control, resulting in the accumulation of damaged proteins and defective nascent proteins that would otherwise be destroyed [51]. This decrease in proteasome function may lead to accumulation of nitrated substrate proteins, even if nitration makes them more susceptible to degradation.
Excessive proteasome nitration lowers the cell’s ability to clear damaged proteins, leading to a buildup of damaged proteins and aggregates, which can cause cell death [52]. Aberrant proteins have a tendency to aggregate and these can form cellular inclusions, characteristic of certain diseases. A relevant example includes the Mallory-Denk (M-D) bodies found in hepatocytes of patients with alcoholic as well as other types of liver disease. M-D bodies contain large amounts of keratin 8 and/or keratin18, ubiquitin, and aggresome proteins [53-55]. While the exact mechanism of M-D body formation is not completely understood, evidence indicates that M-D bodies arise because the proteasome fails to degrade cytokeratins. Recent evidence also indicates that in human hepatoma cells that over-express CYP2E1, ethanol-induced oxidative stress produces M-D body-like aggresomes. Formation of such aggregates correlates with an ethanol-elicited decline in proteasome activity [54]. Preliminary work from our laboratory indicates that such aggregates formed in cultured cells after ethanol exposure may be inhibitory to proteasome activity (Donohue, T.M. unpublished data). Others have shown that protein aggregates are indeed inhibitory to the peptidase activity of the proteasome [56, 57]. Persistence of proteasome malfunction and formation of protein aggregates may lead to cell death by apoptosis or necrosis [58, 59].
Increasingly high levels of oxidative stress caused by primary (e.g. acetaldehyde) and secondary metabolites of ethanol, the latter including peroxynitrite, may contribute to cell death [60]. The data presented here further demonstrate that protein modification by peroxynitrite alters protein function and susceptibility to degradation, indicating the significant influence of secondary metabolites in ethanol-induced oxidative stress. The data are also consistent with those reported in liver and hepatic cells after ethanol administration [42]
Acknowledgments
The authors are pleased to acknowledge support provided by fellowship number 1 F31 AA017045-01 and by grant number AA09384 from the National Institute of Alcohol Abuse and Alcoholism.
Abbreviations
- HIC
Hydrophobic Interaction Chromatography
- suc-LLVY-AMC
N-Succinyl-Leu-Leu-Val-Tyr-7 amido-4 methycoumarin
- TCA
trichloroacetic acid
- SDS-PAGE
sodium dodecyl sulfate polyacrylamide gel electrophoresis
- ECL
Enhanced ChemiLuminescent Western blotting substrate
- MG132
Z-Leu-Leu-Leu-al
- ICDH
Isocitrate dehydrogenase
- PBS
Phosphate Buffered Saline
- SIN-1
3-morpholinosydnonimine
Footnotes
Disclaimers: Not applicable
Publisher's Disclaimer: This is a PDF file of an unedited manuscript that has been accepted for publication. As a service to our customers we are providing this early version of the manuscript. The manuscript will undergo copyediting, typesetting, and review of the resulting proof before it is published in its final citable form. Please note that during the production process errors may be discovered which could affect the content, and all legal disclaimers that apply to the journal pertain.
References
- 1.Koop DR. Alcohol metabolism’s damaging effects on the cell: a focus on reactive oxygen generation by the enzyme cytochrome P450 2E1. Alcohol Res Health. 2006;29(4):274–80. [PMC free article] [PubMed] [Google Scholar]
- 2.Zakhari S. Overview: how is alcohol metabolized by the body? Alcohol Res Health. 2006;29(4):245–54. [PMC free article] [PubMed] [Google Scholar]
- 3.Dey A, Cederbaum AI. Alcohol and oxidative liver injury. Hepatology. 2006;43(2 Suppl 1):S63–74. doi: 10.1002/hep.20957. [DOI] [PubMed] [Google Scholar]
- 4.Osna NA, Haorah J, Krutik VM, Donohue TM., Jr Peroxynitrite alters the catalytic activity of rodent liver proteasome in vitro and in vivo. Hepatology. 2004;40(3):574–82. doi: 10.1002/hep.20352. [DOI] [PubMed] [Google Scholar]
- 5.Huhmer AF, Gerber NC, de Montellano PR, Schoneich C. Peroxynitrite reduction of calmodulin stimulation of neuronal nitric oxide synthase. Chem Res Toxicol. 1996;9(2):484–91. doi: 10.1021/tx950152l. [DOI] [PubMed] [Google Scholar]
- 6.Carreras MC, Pargament GA, Catz SD, Poderoso JJ, Boveris A. Kinetics of nitric oxide and hydrogen peroxide production and formation of peroxynitrite during the respiratory burst of human neutrophils. FEBS Lett. 1994;341(1):65–8. doi: 10.1016/0014-5793(94)80241-6. [DOI] [PubMed] [Google Scholar]
- 7.Ischiropoulos H, Zhu L, Beckman JS. Peroxynitrite formation from macrophage-derived nitric oxide. Arch Biochem Biophys. 1992;298(2):446–51. doi: 10.1016/0003-9861(92)90433-w. [DOI] [PubMed] [Google Scholar]
- 8.Kooy NW, Royall JA. Agonist-induced peroxynitrite production from endothelial cells. Arch Biochem Biophys. 1994;310(2):352–9. doi: 10.1006/abbi.1994.1178. [DOI] [PubMed] [Google Scholar]
- 9.Wang P, Zweier JL. Measurement of nitric oxide and peroxynitrite generation in the postischemic heart. Evidence for peroxynitrite-mediated reperfusion injury. J Biol Chem. 1996;271(46):29223–30. doi: 10.1074/jbc.271.46.29223. [DOI] [PubMed] [Google Scholar]
- 10.Beckman JS, Chen J, Ischiropoulos H, Crow JP. Oxidative chemistry of peroxynitrite. Methods Enzymol. 1994;233:229–40. doi: 10.1016/s0076-6879(94)33026-3. [DOI] [PubMed] [Google Scholar]
- 11.Beckman JS, Crow JP. Pathological implications of nitric oxide, superoxide and peroxynitrite formation. Biochem Soc Trans. 1993;21(2):330–4. doi: 10.1042/bst0210330. [DOI] [PubMed] [Google Scholar]
- 12.Radi R, Beckman JS, Bush KM, Freeman BA. Peroxynitrite oxidation of sulfhydryls. The cytotoxic potential of superoxide and nitric oxide. J Biol Chem. 1991;266(7):4244–50. [PubMed] [Google Scholar]
- 13.Rubbo H, Denicola A, Radi R. Peroxynitrite inactivates thiol-containing enzymes of Trypanosoma cruzi energetic metabolism and inhibits cell respiration. Arch Biochem Biophys. 1994;308(1):96–102. doi: 10.1006/abbi.1994.1014. [DOI] [PubMed] [Google Scholar]
- 14.Souza JM, Radi R. Glyceraldehyde-3-phosphate dehydrogenase inactivation by peroxynitrite. Arch Biochem Biophys. 1998;360(2):187–94. doi: 10.1006/abbi.1998.0932. [DOI] [PubMed] [Google Scholar]
- 15.Konorev EA, Hogg N, Kalyanaraman B. Rapid and irreversible inhibition of creatine kinase by peroxynitrite. FEBS Lett. 1998;427(2):171–4. doi: 10.1016/s0014-5793(98)00413-x. [DOI] [PubMed] [Google Scholar]
- 16.Berlett BS, Friguet B, Yim MB, Chock PB, Stadtman ER. Peroxynitrite-mediated nitration of tyrosine residues in Escherichia coli glutamine synthetase mimics adenylylation: relevance to signal transduction. Proc Natl Acad Sci U S A. 1996;93(5):1776–80. doi: 10.1073/pnas.93.5.1776. [DOI] [PMC free article] [PubMed] [Google Scholar]
- 17.Houston M, Chumley P, Radi R, Rubbo H, Freeman BA. Xanthine oxidase reaction with nitric oxide and peroxynitrite. Arch Biochem Biophys. 1998;355(1):1–8. doi: 10.1006/abbi.1998.0675. [DOI] [PubMed] [Google Scholar]
- 18.Hausladen A, Fridovich I. Superoxide and peroxynitrite inactivate aconitases, but nitric oxide does not. J Biol Chem. 1994;269(47):29405–8. [PubMed] [Google Scholar]
- 19.Frears ER, Zhang Z, Blake DR, O’Connell JP, Winyard PG. Inactivation of tissue inhibitor of metalloproteinase-1 by peroxynitrite. FEBS Lett. 1996;381(12):21–4. doi: 10.1016/0014-5793(96)00065-8. [DOI] [PubMed] [Google Scholar]
- 20.Crow JP, Beckman JS, McCord JM. Sensitivity of the essential zinc-thiolate moiety of yeast alcohol dehydrogenase to hypochlorite and peroxynitrite. Biochemistry. 1995;34(11):3544–52. doi: 10.1021/bi00011a008. [DOI] [PubMed] [Google Scholar]
- 21.MacMillan-Crow LA, Crow JP, Kerby JD, Beckman JS, Thompson JA. Nitration and inactivation of manganese superoxide dismutase in chronic rejection of human renal allografts. Proc Natl Acad Sci U S A. 1996;93(21):11853–8. doi: 10.1073/pnas.93.21.11853. [DOI] [PMC free article] [PubMed] [Google Scholar]
- 22.Padmaja S, Squadrito GL, Pryor WA. Inactivation of glutathione peroxidase by peroxynitrite. Arch Biochem Biophys. 1998;349(1):1–6. doi: 10.1006/abbi.1997.0407. [DOI] [PubMed] [Google Scholar]
- 23.Savvides SN, Scheiwein M, Bohme CC, Arteel GE, Karplus PA, Becker K, Schirmer RH. Crystal structure of the antioxidant enzyme glutathione reductase inactivated by peroxynitrite. J Biol Chem. 2002;277(4):2779–84. doi: 10.1074/jbc.M108190200. [DOI] [PubMed] [Google Scholar]
- 24.Ito Y, Yamada H, Nakamura M, Yoshikawa A, Ueda T, Imoto T. The primary structures and properties of non-stomach lysozymes of sheep and cow, and implication for functional divergence of lysozyme. Eur J Biochem. 1993;213(2):649–58. doi: 10.1111/j.1432-1033.1993.tb17805.x. [DOI] [PubMed] [Google Scholar]
- 25.Kam-Morgan LN, Smith-Gill SJ, Taylor MG, Zhang L, Wilson AC, Kirsch JF. High-resolution mapping of the HyHEL-10 epitope of chicken lysozyme by site-directed mutagenesis. Proc Natl Acad Sci U S A. 1993;90(9):3958–62. doi: 10.1073/pnas.90.9.3958. [DOI] [PMC free article] [PubMed] [Google Scholar]
- 26.Shringarpure R, Grune T, Mehlhase J, Davies KJ. Ubiquitin conjugation is not required for the degradation of oxidized proteins by proteasome. J Biol Chem. 2003;278(1):311–8. doi: 10.1074/jbc.M206279200. [DOI] [PubMed] [Google Scholar]
- 27.Sophianopoulos AJ, Rhodes CK, Holcomb DN, Van Holde KE. Physical studies of lysozyme. I. Characterization. J Biol Chem. 1962;237:1107–12. [PubMed] [Google Scholar]
- 28.Sophianopoulos AJ, Vanholde KE. Physical Studies of Muramidase (Lysozyme). Ii. PH-Dependent Dimerization. J Biol Chem. 1964;239:2516–24. [PubMed] [Google Scholar]
- 29.Wetter LR, Deutsch HF. Immunological studies on egg white proteins. IV. Immunochemical and physical studies of lysozyme. J Biol Chem. 1951;192(1):237–42. [PubMed] [Google Scholar]
- 30.Grune T, Blasig IE, Sitte N, Roloff B, Haseloff R, Davies KJ. Peroxynitrite increases the degradation of aconitase and other cellular proteins by proteasome. J Biol Chem. 1998;273(18):10857–62. doi: 10.1074/jbc.273.18.10857. [DOI] [PubMed] [Google Scholar]
- 31.Gallin JI, Fletcher MP, Seligmann BE, Hoffstein S, Cehrs K, Mounessa N. Human neutrophil-specific granule deficiency: a model to assess the role of neutrophil-specific granules in the evolution of the inflammatory response. Blood. 1982;59(6):1317–29. [PubMed] [Google Scholar]
- 32.Smolelis AN, Hartsell SE. The determination of lysozyme. J Bacteriol. 1949;58(6):731–6. doi: 10.1128/jb.58.6.731-736.1949. [DOI] [PMC free article] [PubMed] [Google Scholar]
- 33.Salton MR. The properties of lysozyme and its action on microorganisms. Bacteriol Rev. 1957;21(2):82–100. doi: 10.1128/br.21.2.82-100.1957. [DOI] [PMC free article] [PubMed] [Google Scholar]
- 34.Litwack G. Photometric determination of lysozyme activity. Proc Soc Exp Biol Med. 1955;89(3):401–3. doi: 10.3181/00379727-89-21824. [DOI] [PubMed] [Google Scholar]
- 35.Niwa T, Doi U, Kato Y, Osawa T. Inhibitory mechanism of sinapinic acid against peroxynitrite-mediated tyrosine nitration of protein in vitro. FEBS Lett. 1999;459(1):43–6. doi: 10.1016/s0014-5793(99)01216-8. [DOI] [PubMed] [Google Scholar]
- 36.Blanchard-Fillion B, Souza JM, Friel T, Jiang GC, Vrana K, Sharov V, Barron L, Schoneich C, Quijano C, Alvarez B, Radi R, Przedborski S, Fernando GS, Horwitz J, Ischiropoulos H. Nitration and inactivation of tyrosine hydroxylase by peroxynitrite. J Biol Chem. 2001;276(49):46017–23. doi: 10.1074/jbc.M105564200. [DOI] [PubMed] [Google Scholar]
- 37.Ischiropoulos H, Zhu L, Chen J, Tsai M, Martin JC, Smith CD, Beckman JS. Peroxynitrite-mediated tyrosine nitration catalyzed by superoxide dismutase. Arch Biochem Biophys. 1992;298(2):431–7. doi: 10.1016/0003-9861(92)90431-u. [DOI] [PubMed] [Google Scholar]
- 38.Souza JM, Choi I, Chen Q, Weisse M, Daikhin E, Yudkoff M, Obin M, Ara J, Horwitz J, Ischiropoulos H. Proteolytic degradation of tyrosine nitrated proteins. Arch Biochem Biophys. 2000;380(2):360–6. doi: 10.1006/abbi.2000.1940. [DOI] [PubMed] [Google Scholar]
- 39.Amici M, Lupidi G, Angeletti M, Fioretti E, Eleuteri AM. Peroxynitrite-induced oxidation and its effects on isolated proteasomal systems. Free Radic Biol Med. 2003;34(8):987–96. doi: 10.1016/s0891-5849(02)01369-2. [DOI] [PubMed] [Google Scholar]
- 40.Osna NA, Clemens DL, Donohue TM., Jr Ethanol metabolism alters interferon gamma signaling in recombinant HepG2 cells. Hepatology. 2005;42(5):1109–17. doi: 10.1002/hep.20909. [DOI] [PubMed] [Google Scholar]
- 41.Bradford MM. A rapid and sensitive method for the quantitation of microgram quantities of protein utilizing the principle of protein-dye binding. Anal Biochem. 1976;72:248–54. doi: 10.1006/abio.1976.9999. [DOI] [PubMed] [Google Scholar]
- 42.Epstein RJ. Human Molecular Biology: An Introduction to the Molecular Basis of Health and Disease. Cambridge University Press; New York: 2003. [Google Scholar]
- 43.Donohue TM, Osna NA, Clemens DL. Recombinant Hep G2 cells that express alcohol dehydrogenase and cytochrome P450 2E1 as a model of ethanol-elicited cytotoxicity. Int J Biochem Cell Biol. 2006;38(1):92–101. doi: 10.1016/j.biocel.2005.07.010. [DOI] [PubMed] [Google Scholar]
- 44.Beyette JR, Hubbell T, Monaco JJ. Purification of 20S proteasomes. Methods Mol Biol. 2001;156:1–16. doi: 10.1385/1-59259-062-4:1. [DOI] [PubMed] [Google Scholar]
- 45.Neuhoff V, Arold N, Taube D, Ehrhardt W. Improved staining of proteins in polyacrylamide gels including isoelectric focusing gels with clear background at nanogram sensitivity using Coomassie Brilliant Blue G-250 and R-250. Electrophoresis. 1988;9(6):255–62. doi: 10.1002/elps.1150090603. [DOI] [PubMed] [Google Scholar]
- 46.Groskreutz JL, Bronk SF, Gores GJ. Ruthenium red delays the onset of cell death during oxidative stress of rat hepatocytes. Gastroenterology. 1992;102(3):1030–8. doi: 10.1016/0016-5085(92)90193-3. [DOI] [PubMed] [Google Scholar]
- 47.Radi R, Beckman JS, Bush KM, Freeman BA. Peroxynitrite-induced membrane lipid peroxidation: the cytotoxic potential of superoxide and nitric oxide. Arch Biochem Biophys. 1991;288(2):481–7. doi: 10.1016/0003-9861(91)90224-7. [DOI] [PubMed] [Google Scholar]
- 48.Rubbo H, Radi R, Trujillo M, Telleri R, Kalyanaraman B, Barnes S, Kirk M, Freeman BA. Nitric oxide regulation of superoxide and peroxynitrite-dependent lipid peroxidation. Formation of novel nitrogen-containing oxidized lipid derivatives. J Biol Chem. 1994;269(42):26066–75. [PubMed] [Google Scholar]
- 49.Lee JH, Yang ES, Park JW. Inactivation of NADP+-dependent isocitrate dehydrogenase by peroxynitrite. Implications for cytotoxicity and alcohol-induced liver injury. J Biol Chem. 2003;278(51):51360–71. doi: 10.1074/jbc.M302332200. [DOI] [PubMed] [Google Scholar]
- 50.Pucciarelli S, Spina M, Montecchia F, Lupidi G, Eleuteri AM, Fioretti E, Angeletti M. Peroxynitrite-mediated oxidation of the C85S/C152E mutant of dihydrofolate reductase from Escherichia coli: functional and structural effects. Arch Biochem Biophys. 2005;434(2):221–31. doi: 10.1016/j.abb.2004.11.008. [DOI] [PubMed] [Google Scholar]
- 51.Schubert U, Ott DE, Chertova EN, Welker R, Tessmer U, Princiotta MF, Bennink JR, Krausslich HG, Yewdell JW. Proteasome inhibition interferes with gag polyprotein processing, release, and maturation of HIV-1 and HIV-2. Proc Natl Acad Sci U S A. 2000;97(24):13057–62. doi: 10.1073/pnas.97.24.13057. [DOI] [PMC free article] [PubMed] [Google Scholar]
- 52.Hinson JA, Michael SL, Ault SG, Pumford NR. Western blot analysis for nitrotyrosine protein adducts in livers of saline-treated and acetaminophen-treated mice. Toxicol Sci. 2000;53(2):467–73. doi: 10.1093/toxsci/53.2.467. [DOI] [PubMed] [Google Scholar]
- 53.Bjorkoy G, Lamark T, Brech A, Outzen H, Perander M, Overvatn A, Stenmark H, Johansen T. p62/SQSTM1 forms protein aggregates degraded by autophagy and has a protective effect on huntingtin-induced cell death. J Cell Biol. 2005;171(4):603–14. doi: 10.1083/jcb.200507002. [DOI] [PMC free article] [PubMed] [Google Scholar]
- 54.Bardag-Gorce F, French BA, Nan L, Song H, Nguyen SK, Yong H, Dede J, French SW. CYP2E1 induced by ethanol causes oxidative stress, proteasome inhibition and cytokeratin aggresome (Mallory body-like) formation. Exp Mol Pathol. 2006;81(3):191–201. doi: 10.1016/j.yexmp.2006.07.007. [DOI] [PubMed] [Google Scholar]
- 55.Harada M, Hanada S, Toivola DM, Ghori N, Omary MB. Autophagy activation by rapamycin eliminates mouse Mallory-Denk bodies and blocks their proteasome inhibitor-mediated formation. Hepatology. 2008;47(6):2026–35. doi: 10.1002/hep.22294. [DOI] [PubMed] [Google Scholar]
- 56.Lam YA, Pickart CM, Alban A, Landon M, Jamieson C, Ramage R, Mayer RJ, Layfield R. Inhibition of the ubiquitin-proteasome system in Alzheimer’s disease. Proc Natl Acad Sci U S A. 2000;97(18):9902–6. doi: 10.1073/pnas.170173897. [DOI] [PMC free article] [PubMed] [Google Scholar]
- 57.Bence NF, Sampat RM, Kopito RR. Impairment of the ubiquitin-proteasome system by protein aggregation. Science. 2001;292(5521):1552–5. doi: 10.1126/science.292.5521.1552. [DOI] [PubMed] [Google Scholar]
- 58.Kim S, Choi K, Kwon D, Benveniste EN, Choi C. Ubiquitin-proteasome pathway as a primary defender against TRAIL-mediated cell death. Cell Mol Life Sci. 2004;61(9):1075–81. doi: 10.1007/s00018-004-3477-5. [DOI] [PMC free article] [PubMed] [Google Scholar]
- 59.de Moissac D, Mustapha S, Greenberg AH, Kirshenbaum LA. Bcl-2 activates the transcription factor NFkappaB through the degradation of the cytoplasmic inhibitor IkappaBalpha. J Biol Chem. 1998;273(37):23946–51. doi: 10.1074/jbc.273.37.23946. [DOI] [PubMed] [Google Scholar]
- 60.Nanji AA, Hiller-Sturmhofel S. Apoptosis and necrosis: two types of cell death in alcoholic liver disease. Alcohol Health Res World. 1997;21(4):325–30. [PMC free article] [PubMed] [Google Scholar]