Abstract
Objectives
Canine intranasal neoplasia is commonly evaluated using computed tomography to indicate the diagnosis, to determine disease extent, to guide histological sampling location and to plan treatment. With the expanding use of magnetic resonance imaging in veterinary medicine, this modality has been recently applied for the same purpose. The aim of this study was to compare the features of canine intranasal neoplasia using computed tomography and magnetic resonance imaging.
Methods
Twenty-one dogs with confirmed intranasal neoplasia underwent both computed tomography and magnetic resonance imaging. The images were reviewed retrospectively for the bony and soft tissue features of intranasal neoplasia.
Results
Overall computed tomography and magnetic resonance imaging performed very similarly. However, lysis of bones bordering the nasal cavity and mucosal thickening was found on computed tomography images more often than on magnetic resonance images. Small amounts of fluid in the nasal cavity were more often seen on magnetic resonance images. However, fluid in the frontal sinuses was seen equally well with both modalities.
Clinical Significance
We conclude that computed tomography is satisfactory for evaluation of canine intranasal neoplasia, and no clinically relevant benefit is gained using magnetic resonance imaging for intranasal neoplasia without extent into the cranial cavity.
Introduction
The goals of cross-sectional imaging in dogs with a suspected nasal tumour are definition of extent of disease, guidance for appropriate biopsy sampling and treatment planning. The computed tomography (CT) features of canine nasal tumours are well established and include soft-tissue-attenuating material in the nasal cavity, which may extend into the ipsilateral frontal sinus, pterygopalatine fossa and possibly the cranial vault. Additionally, there may be destruction of turbinates, nasal septum and bone surrounding the nasal cavity including the cribriform plate (Thrall and others 1989, Burk 1992, Codner and others 1993, Saunders and others 2003, Saunders and others 2004, Lefebvre and others 2005). Intertumoral and intratumoral perfusion heterogeneity has been noted on postcontrast examinations of adenocarcinoma, carcinoma and sarcomas (Moore and others 1991, Van Camp and others 2000). Non-contrast-enhancing soft tissue in the nasal cavity or frontal sinus caudal to the enhancing soft-tissue-attenuating mass is thought to correspond to secondary obstructive rhinitis or frontal sinusitis (Lefebvre and others 2005).
With the emerging availability of magnetic resonance imaging (MRI) for veterinary patients, this modality has been recently applied for the diagnosis of canine and feline nasal neoplasia. MRI facilitated accurate tumour localisation and permitted identification of the extent of the soft tissue mass both within and external to the nasal cavity. Tumours had increased signal intensity on T2-weighted images and enhancement on T1-weighted postcontrast images (Voges and Ackerman 1995, Petite and Dennis 2006, Avner and others 2008, Miles and others 2008). High signal intensity in peritumoral brain tissue on T2-weighted images is consistent with peritumoral oedema (Moore and others 1991).
Comparing both modalities, MRI has been said to be superior for evaluation of the extent of nasal tumours and to allow identification of more cerebral abnormalities (Moore and others 1991, Voges and Ackerman 1995). CT has been said to be superior for detection of cribriform plate involvement and to provide better anatomic detail of the tumour and secondary changes (Moore and others 1991). Yet, there has not been a direct comparison of the two modalities in a larger group of patients (Avner and others 2008).
Because of its inherent physical properties, MRI is generally accepted as the modality of choice for many applications of cross-sectional soft tissue imaging, such as the brain, whereas CT not only is preferred for cross-sectional bone imaging but also enables soft tissue visualisation. Both MRI and CT imaging have potential for evaluation of the nasal cavity in patients with nasal tumours because both soft tissue and bony structures are equally important. It remains unclear, however, if the superior contrast resolution of MRI justifies its use when the evaluation of bony structures, such as the cribriform plate, remains critical for establishing the prognosis and treatment approach for a specific patient.
We hypothesised that CT is equal to if not better than MRI for staging nasal tumours because of presumed better visualisation of bone lesions and is therefore satisfactory for the diagnostic work up of canine nasal neoplasia.
The aim of this study was to compare the ability of CT versus MRI to visualise the features of intranasal tumours (bony and soft tissue changes) for each patient.
Materials and Methods
The patients were participants in a phase II helical tomotherapy treatment trial of conformal avoidance of ocular structures (Forrest and others 2004). Exclusion criteria for this study were extension of the disease into the cranial vault based on initial CT evaluation or previous treatment for the nasal neoplasia. If no intracranial extent was detected, patients were admitted to the study and underwent subsequent MRI examination. Animal use was approved by the Responsible Animal Care and Use Committee (protocol number V00954).
Twenty-one dogs with a confirmed intranasal tumour that had both CT and MRI of the skull and nasal passages form the basis of this report. CT and MRI were performed within three to 19 days (mean 11 days) of each other.
Tumour types included undifferentiated carcinoma (eight dogs), adenocarcinoma (eight dogs), chondrosarcoma (four dogs) and squamous cell carcinoma (one dog), and breeds were typically members of working dog and terrier categories. Dogs were under inhalation anaesthesia for CT and MRI. CT imaging was performed using a single detector row unit (GE HiLight advantage) with the dogs in sternal recumbency. Contiguous transverse images were acquired from the caudal aspect of the frontal sinuses to the nares. Additional 1 to 3 mm transverse images were acquired through the cribriform plate area using a high-frequency reconstruction algorithm if bony erosion was suspected. Images were obtained before and immediately after administration of 2 ml/kg intravenous contrast medium (740 mgI/kg, Hypaque-76; Amersham Health Inc.).
MRI was performed with the dogs in dorsal recumbency at 1.0 T (GE Signa Advantage) with a transmitting and receiving quadrature extremity or head coil. Protocols included T2-weighted and T1-weighted precontrast and postcontrast spin echo images in transverse plane and T1-weighted sagittal and dorsal plane spin echo images postcontrast. T1-weighted images were obtained with TR of 400 to 550 milliseconds and TE of approximately 12 to 15 milliseconds, and T2-weighted images were obtained with TR of 3000 to 4000 milliseconds and TE of approximately 100 milliseconds. Postcontrast images were obtained immediately after intravenous injection of 0.2 ml/kg contrast medium (57.4 mg gadodiamide/kg, Omniscan; Amersham Health Inc.). Slice thickness and interslice gap were chosen dependent on anatomy and patient size (3, 4 or 5 mm thickness and 0.5 or 1 mm interslice gap).
Images were reviewed using a DICOM viewer (eFilm; Merge eFilm) on a PC-based workstation. Window and level settings were constant for all studies (CT: soft tissue window at W 350/L 90 and bone window at W 2500/L 480; magnetic resonance [MR]: W 1180/L 590). Image evaluation was performed initially by a radiology resident; this was followed by a consensus review with a board-certified radiologist. Five regions were evaluated separately for the left and right side as displayed in Fig 1 (1, nasal cavity rostral to maxillary recess; 2, nasal cavity at the level of the maxillary recess; 3, nasal cavity at the level of the ethmoid turbinates; 4, frontal sinus and 5, cribriform plate). CT and MR images for each dog were reviewed independently and without knowledge of patient identification. Initial image analysis for both modalities was based on the transverse images. Following this, CT images reconstructed in sagittal and dorsal planes and MRI images obtained in dorsal and sagittal planes were reviewed. Any additional information found during evaluation of the dorsal and sagittal planes that was not evident on the transverse plane images was recorded.
FIG 1.
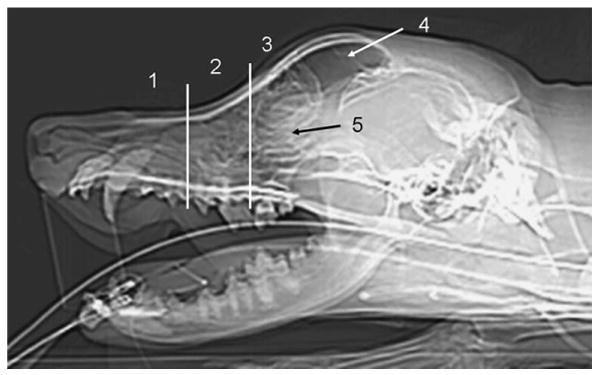
Evaluated areas displayed on a lateral computed tomography scout image: nasal cavity (1) rostral to maxillary recess, (2) at the level of the maxillary recess, (3) at the level of the ethmoid turbinated caudal to the maxillary recess, (4) frontal sinus, (5) cribriform plate. The transverse lines indicate the rostral and caudal borders of the maxillary recess
Parameters evaluated included: (a) lysis of turbinates, lysis of nasal septum and bordering bones and lysis of the cribriform plate. A score was given for each area evaluated: 0=normal, 1=less than one-third destroyed, 2=one to two-thirds destroyed and 3=greater than two-thirds destroyed. (b) Classification of soft-tissue-attenuating structures (regions 1 to 4): normal, mass (soft tissue mass with subjective enhancement on postcontrast images), fluid (no enhancement on postcontrast images) or mucosal thickening (with subjective enhancement on postcontrast images). Then, a score was given to estimate the amount of previously classified soft-tissue-attenuating structure present in each evaluated area: 0=none, 1=taking up less than one third of the respective region, 2=taking up one third to two thirds of the respective region and 3=taking up greater than two thirds of the respective region. Additionally, if the abnormal soft tissue in the frontal sinus (region 4) was interpreted as fluid, Hounsfield units (HU) were measured by manual placement of a region of interest on precontrast and postcontrast CT images to confirm lack of enhancement.
For each region, the assigned scores for bone (regions 1 to 5) and soft tissue (regions 1 to 4) were added and compared for each modality. For data with multiple outcomes, paired Student's t tests and Spearman's rank correlations were performed. McNemar's test was used for the data with paired binary outcomes. HU values generated from measurements in the frontal sinus were compared using Student's t test, and correlation was evaluated with Pearson's statistic. Statistical significance for all analysis was set at P≤0.05.
Results
Characteristics of nasal neoplasia were observed in all dogs. On CT and MR images of this group of dogs, bony lysis was seen overall with similar regularity (Table 1). Most of the information was obtained from turbinate lysis in regions 1 to 3. Regions 4 and 5 were affected to a lesser extent than regions 1 to 3, resulting in low numbers available for statistical evaluation. MRI and CT scores for turbinate and septum lysis in regions 1 to 3 had similar magnitudes and high correlation (r=0.89 and 0.93, respectively). A greater magnitude of lysis of the bones bordering the nasal cavity was present on CT images (P=0.031; Fig 2). A greater magnitude of lysis of the cribriform plate was observed with CT (Fig 3); however, this difference was not statistically significant (P=0.073), and there was a low correlation between CT and MRI (r=0.14) for this parameter.
Table 1. Statistical evaluation of the scores for bony lysis of 21 dogs with CT and MRI examination.
| Anatomical region | Bony structure affected | Modality | Mean score | P value | Correlation coefficient |
|---|---|---|---|---|---|
| Regions 1 to 3 | Turbinates | MRI | 7.864 | 0.93 | 0.89 |
| CT | 8.407 | ||||
| Septum | MRI | 2.455 | 0.38 | 0.93 | |
| CT | 2.815 | ||||
| Bordering bone | MRI | 0.5909 | 0.031 | 0.77 | |
| CT | 1.481 | ||||
| Total scores | MRI | 10.91 | 0.2 | 0.92 | |
| CT | 12.700 | ||||
| Region 4 | Septum | MRI | 0.000 | 0.33 | 0 |
| CT | 0.074 | ||||
| Bordering bone | MRI | 0.318 | 0.54 | 0.51 | |
| CT | 0.222 | ||||
| Total scores | MRI | 0.318 | 0.77 | 0.45 | |
| CT | 0.296 | ||||
| Region 5 | Cribriform plate | MRI | 0.045 | 0.073 | 0.14 |
| CT | 0.405 |
CT computed tomography, MRI magnetic resonance imaging
FIG 2.
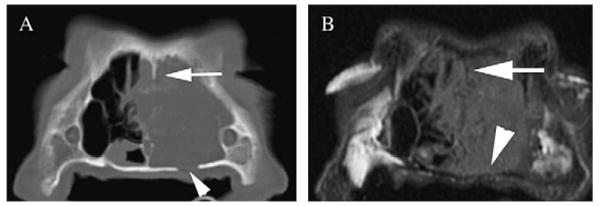
Comparison of conspicuity of the lysis of the bones bordering the nasal cavity: note partial lysis of the left palatine bone (arrowhead) on computed tomography (CT) image displayed in bone window (A). On the magnetic resonance imaging (MRI) precontrast image (B), thinning of the hypointense bone is seen (arrowhead); however, the lysis is not clearly depicted. The remnants of the lytic bony nasal septum (arrow) are also better depicted on CT compared with MRI image
FIG 3.
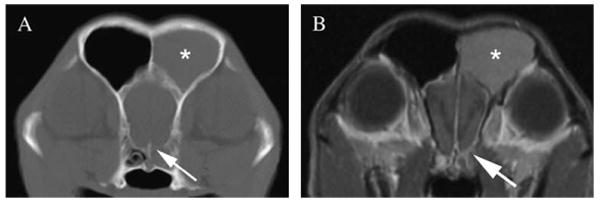
Comparison of the conspicuity of lysis of the cribriform plate on computed tomography (CT) image displayed in bone window (A) and magnetic resonance imaging (MRI) T1-weighted postcontrast image (B). Note the defect in the left ventral aspect of the cribriform plate seen on CT image (arrow), whereas the MRI image displays thinning of the hypointense bone structure (arrow), but actual lysis is not depicted. Note fluid in the left frontal sinus (asterisk), consistent with obstructive sinusitis. Additionally meningeal enhancement is seen along the olfactory bulb on the affected side
CT and MRI performed differently with respect to visualisation of soft tissue involvement in regions 1 to 3 (Table 2). More fluid was seen with MRI (P=0.0022; Fig 4), whereas thickened mucosa was present more often on CT (P=0.0047). CT and MRI performed similarly for the presence of soft tissue masses (r=0.63; Fig 4) and for the presence of normal soft tissue structures (r=0.69).
Table 2. Statistical evaluation of the scores for soft tissue in the nasal cavity (region 1 to 3) of 21 dogs.
| Modality | Mean score | P value | Correlation coefficient | |
|---|---|---|---|---|
| Mass | MRI | 2.318 | 0.33 | 0.63 |
| CT | 2.519 | |||
| Fluid | MRI | 1.773 | 0.0022 | 0.35 |
| CT | 0.8148 | |||
| Thickened mucosa | MRI | 0.6818 | 0.0047 | 0.3 |
| CT | 1.444 | |||
| Normal | MRI | 0.43 | 0.057 | 0.69 |
| CT | 0.19 |
MRI magnetic resonance imaging, CT computed tomography
FIG 4.
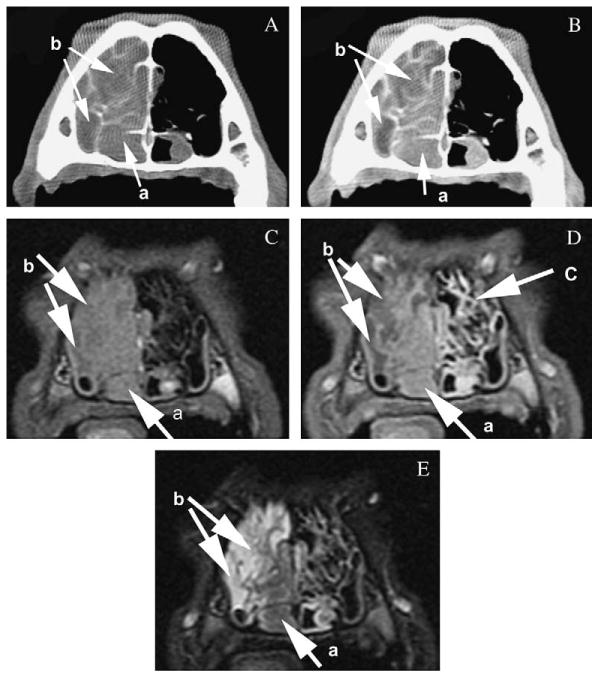
Comparison of the conspicuity of the features of canine nasal neoplasia on computed tomography precontrast (A) and postcontrast (B) images displayed in a soft tissue window and magnetic resonance imaging (MRI) T1-weighted precontrast (C), postcontrast (D) and T2-weighted (E) images at the level of the maxillary recess. Note the similar visibility of the neoplasia (a) based on enhancement on the postcontrast images and the depiction of fluid (b) based on non-enhancement or hyperintensity on T2-weighted images. The mucosal lining of the turbinates (c) is seen on T1-weighted postcontrast MRI images because of increased enhancement; however, the bony structure of the turbinates is not clearly identified
In the frontal sinus (region 4), results were similar between MRI and CT (P=1.0 for tests of differences in rates of all criteria) and fluid was the most commonly seen soft tissue abnormality with both modalities (Table 3, Fig 3). Measurement of HU in abnormal soft tissue classified as fluid on CT images in the frontal sinuses had a mean HU of 60.7 (HU 32.1 to 81.4) precontrast and a mean HU of 59.7 (HU 31.8 to 78.9) postcontrast. Despite the small difference between mean precontrast and postcontrast HU values, this difference was significant (P=0.029).
Table 3. Statistical evaluation for soft tissue in the frontal sinus (region 4) of 20 dogs: rate of occurrence between MRI and CT.
| Modality | Rate (%) | P value | |
|---|---|---|---|
| Mass | MRI | 20 | 1 |
| CT | 15 | ||
| Fluid | MRI | 55 | 1 |
| CT | 60 | ||
| Thickened mucosa | MRI | 10 | 1 |
| CT | 5 | ||
| Normal | MRI | 30 | 1 |
| CT | 35 |
MRI magnetic resonance imaging, CT computed tomography
P values calculated with McNemar's test with application of continuity corrections
Evaluation of the reconstructed dorsal and sagittal plane CT images did not include additional information to the evaluation of the transverse images in any dog. Evaluation of dorsal plane MRI images subjectively helped to delineate the border of the olfactory bulbs in 18 of 21 dogs, and evaluation of sagittal plane MRI images subjectively helped to delineate the border of the olfactory bulbs in six of 21 dogs (Fig 5). No different information regarding the already assigned scores from the transverse images for bony and soft tissue changes was found on dorsal and sagittal plane CT and MRI images.
FIG 5.
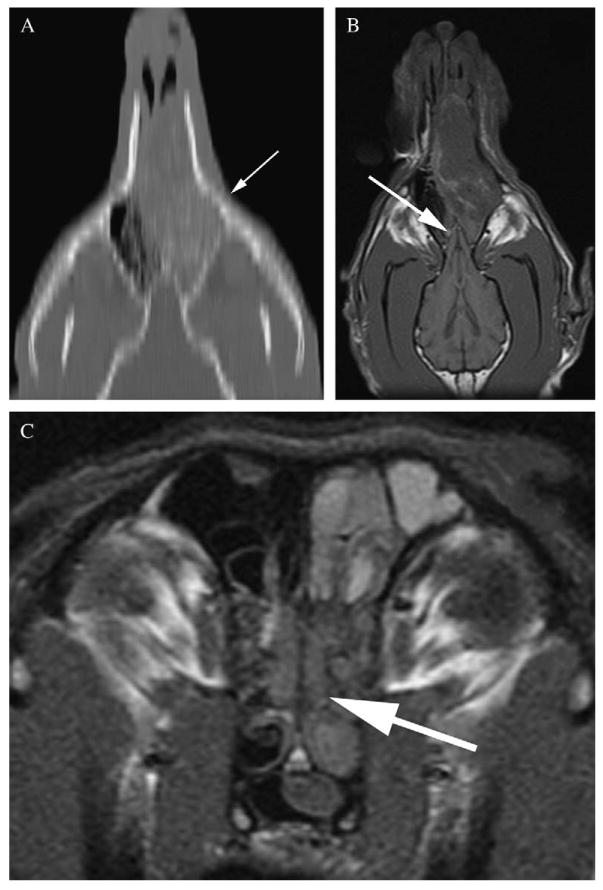
Dorsal plane reconstruction computed tomography image (A) of the nasal cavity at the level of the cribriform plate. Volume averaging leads to stair-step artefact (arrow) with jagged and indistinct appearance of the small and curvilinear bony structures on the reconstructed image. Magnetic resonance imaging dorsal plane T1-weighted image (B) of the same dog facilitates better outline of the olfactory bulb (arrow), which remedies lower conspicuity of the cribriform plate (arrow) on transverse images (C)
During the consensus review, no disagreement was found between the results generated by the radiology resident and the evaluation by the board-certified radiologist.
Discussion
In the study reported herein, the data indicate that CT and MRI overall provide similar information for the evaluation of canine intranasal neoplasia when confined to the nasal cavity with no apparent intracranial extension.
All transverse imaging studies showed typical characteristics of nasal neoplasia, as described previously (Thrall and others 1989, Moore and others 1991, Burk 1992, Voges and Ackerman 1995, Saunders and others 2003, Lefebvre and others 2005, Sako and others 2005, Petite and Dennis 2006, Tromblee and others 2006, Avner and others 2008, Miles and others 2008).
Most information was gained from the lysis of the turbinates in the nasal cavity, which corresponded to the origin, stage and aggressive nature of the disease encountered in this study. Subjectively, turbinate lysis and lysis of the thin bony part of the nasal septum were easier to recognise on CT images than on MR images; however, the results for both modalities correlated well. As the cribriform plate acts as barrier between nasal and calvarial cavities, evaluation of this structure is critical for determination of intracranial extent of disease. Subjectively, on CT images, especially on the images with narrower collimation, this structure was more clearly identified when compared with MRI. In this study, we found that CT subjectively visualised more lysis of the cribriform plate; however, this was not found to be statistically significant. We speculate that a more significant result might have been encountered if patients with intracranial involvement were part of the study population. However, an exclusion criterion for patients enrolled in the therapeutic trial included extension of the disease into the cranial vault. Brain involvement was therefore not observed, and bony erosion of the cribriform plate and frontal sinus was seen with low incidence. This reflects a study population with early and intranasal disease stage still confined to the nasal cavity. Previously described meningeal T2 hyperintensity adjacent to the cribriform plate, which is thought to be associated with nasal pathology, was observed in a single patient (Avner and others 2008).
A previous study rated MR superior to CT for diagnosis of cribriform plate lysis, but this was described because of better visualisation of cerebral abnormalities and not necessarily the bony lysis itself (Moore and others 1991). The four cases described in that study had extensive disease compared with our study cohort. Additionally, CT images acquired were 5 mm thick, and the use of a high-frequency algorithm to accentuate bony changes was not mentioned, indicating that the imaging was not optimised for visualisation of bone. It was also stated that the use of a more advanced CT scanner may have provided more information. Hence, rating of MRI superior to CT by these authors has to be viewed in the light of the above limitations.
We found that erosion of the bones bordering the nasal cavity was observed significantly more often on CT images compared with MRI, which supports our hypothesis that CT enables better visualisation of bony lysis.
The significant difference between the modalities for the presence of fluid and thickened mucosa in the nasal cavity is most likely because of the increased conspicuity of small amounts of fluid on the T2-weighted MR images, whereas small amounts of fluid might not be differentiated from the mucosal lining in all CT images and therefore may have been incorrectly classified as mucosal thickening compared with fluid. CT and MRI performed similarly for the presence of soft-tissue-attenuating structures classified either as mass or normal nasal soft tissues, which indicated similar diagnostic ability of both modalities for this morphological feature of the disease or identification of normality.
More soft tissue than bony abnormalities were found in the frontal sinus (region 4) with both imaging modalities. This is consistent with the relatively early disease stage of the dogs enrolled in this study. Fluid was the most commonly observed soft tissue abnormality in the frontal sinus with both modalities. High correlation between both modalities for this feature supports the accurate diagnosis of obstructive frontal sinusitis with both MRI and CT, which is important for radiotherapy treatment planning. Accumulation of fluid caudal to a nasal mass is consistent with obstructive rhinitis and frontal sinusitis. If obstructive sinusitis is identified with imaging, the gross tumour volume will exclude the frontal sinuses and thus decrease the overall radiotherapy treatment volume. Measurement of the HU was performed only in the frontal sinus. Because of the anatomy, it was possible to place the ROI in a single tissue in the frontal sinus, whereas in the nasal cavity, a mixture of tissues will almost always be included. In the frontal sinus, the interpretation of abnormal soft tissue was confirmed objectively as proteinaceous fluid attenuation (mean HU 60.7, range HU 32.1 to 81.4). However, the postcontrast values were, even if only by 1 HU, significantly lower than the precontrast CT images. This is probably because of increased beam attenuation in the surrounding tissues after administration of contrast medium.
Evaluation of the reconstructed dorsal and sagittal plane CT images and the dorsal and sagittal plane MR images did not include additional information that would have changed the scores gained from the transverse images. For the reconstructed CT images, this may, in part, be explained by partial volume artefact (Bushberg and others 2002), which is unavoidable using a slice thickness of 5 mm, and leads to decreased conspicuity of small and curvilinear bony structures by giving an indistinct and jagged-like or stair-step-like appearance (Fig 5). These images may, however, be helpful to communicate disease localisation and extent to other clinicians and owners as the images do increase spatial understanding of the disease process. Occurrence of the stair-step artefact can be reduced by acquiring thinner or overlapping slices. The scan protocol for this study was, however, designed to simulate a routinely clinically applied protocol, which may not be optimised in all aspects but sufficient for diagnosis. The MRI dorsal and sagittal plane images, on the other hand, are obtained in that specific plane and display the anatomy without this artefact. With MRI, olfactory bulbs of the forebrain were better outlined on the dorsal and sagittal plane in several dogs compared with the transverse plane. In cases with intracranial involvement, this might aid the diagnosis and substitute for the lesser conspicuity of the bony cribriform plate on MRI images.
The statistical evaluation of these data was based on a consensus review between a radiology resident and a board-certified radiologist. No disagreement was found during the consensus review. Ideally, inter-observer statistics may have been calculated. However, the straightforward grading system applied in this study did not leave room for personal interpretation or much variability on the grading itself, hence we felt that no additional information was to be gained from further interobserver evaluation.
Despite the fact that precontrast and postcontrast CT and MRI have been used for radiologic diagnosis of the features of nasal neoplasia, objective comparison of the two modalities in dogs had not yet been reported. Hence, the ideal modality for imaging canine nasal tumours was yet to be determined. Ideally, transverse pathological sections of the nasal cavity, cribriform plate and frontal sinus after scan aligned with the MRI and CT scan planes would have served as the gold standard in this study. However, as the patients were enrolled in a therapeutic study, necropsies were only available at a later time point, which precluded comparison to the disease state at the time of imaging. Nevertheless, good correlation between MRI and CT in evaluation of the features of intranasal tumours provides a reasonable estimation of the comparative worth of the two modalities. Comparison of the features of extent of nasal neoplasia into the cranial cavity on CT and MR images, and the relative sensitivity of the two modalities of this, may be addressed in a separate study design.
Conclusions
Based on our study population, we conclude that the features of canine intranasal neoplasia without extent into the cranial cavity are similarly evaluated using both CT and MRI. MRI is preferable for the observation of small quantities of fluid in the nasal cavity, whereas CT images were superior for evaluation of bordering bone lysis. Both modalities equally identified soft tissue abnormalities in the frontal sinuses, which have implications for radiotherapy treatment planning and tumour staging. From a standpoint of clinical relevance for radiographic diagnosis, this study supports our hypothesis that the use of CT imaging for diagnosing and staging of canine intranasal neoplasia without extent into the cranial cavity is satisfactory, and no relevant benefit is gained by the use of MRI.
Acknowledgments
This work was supported by National Cancer Institute grant number 1PO1 CA88960.
Contributor Information
R. Drees, Radiology, Department of Surgical Sciences, VMTH, University of Wisconsin-Madison
L. J. Forrest, Radiology, Department of Surgical Sciences, VMTH, University of Wisconsin-Madison
R. Chappell, Department of Statistics, Biostatistics and Medical Informatics, Medical School, University of Wisconsin-Madison
References
- Avner A, Dobson JM, Sales JI, Herrtage ME. Retrospective review of 50 canine nasal tumours evaluated by low-field magnetic resonance imaging. Journal of Small Animal Practice. 2008;49:233–239. doi: 10.1111/j.1748-5827.2007.00512.x. [DOI] [PubMed] [Google Scholar]
- Burk RL. Computed tomographic imaging of nasal disease in 100 dogs. Veterinary Radiology & Ultrasound. 1992;33:177–180. [Google Scholar]
- Bushberg JT, Seibert JA, Lediholdt EM, Jr, Boone JM. Computed tomography. In: Bushberg JT, editor. The Essential Physics of Medical Imaging. 2nd. Lippincott Williams & Wilkins; Philadelphia, PA, USA: 2002. [Google Scholar]
- Codner EC, Lurus AG, Miller JB, Gavin PR, Gallina A, Barbee DD. Comparison of computed tomography with radiography as a noninvasive diagnostic technique for chronic nasal disease in dogs. Journal of the American Veterinary Medical Association. 1993;202:1106–1110. [PubMed] [Google Scholar]
- Forrest LJ, Mackie TR, Ruchala K, Turek M, Kapatoes J, Jaradat H, Hui S, Balog J, Vail DM, Mehta MP. The utility of mega-voltage computed tomography images from a helical tomotherapy system for setup verification purposes. International Journal of Radiation Oncology, Biology, Physics. 2004;60:1639–1644. doi: 10.1016/j.ijrobp.2004.08.016. [DOI] [PubMed] [Google Scholar]
- Lefebvre J, Kuehn NF, Wortinger A. Computed tomography as an aid in the diagnosis of chronic nasal disease in dogs. Journal of Small Animal Practice. 2005;46:280–285. doi: 10.1111/j.1748-5827.2005.tb00321.x. [DOI] [PubMed] [Google Scholar]
- Miles MS, Dhaliwal RS, Moore MP, Reed AL. Association of magnetic resonance imaging findings and histologic diagnosis in dogs with nasal disease: 78 cases (2001-2004) Journal of the American Veterinary Medical Association. 2008;232:1844–1849. doi: 10.2460/javma.232.12.1844. [DOI] [PubMed] [Google Scholar]
- Moore MP, Gavin RG, Kraft SL, DeHaan CE, Leathers CW, Dorn RV., III MR, CT and clinical features from four dogs with nasal tumours involving the rostral cerebrum. Veterinary Radiology & Ultrasound. 1991;32:19–25. [Google Scholar]
- Petite AF, Dennis R. Comparison of radiography and magnetic resonance imaging for evaluating the extent of nasal neoplasia in dogs. Journal of Small Animal Practice. 2006;47:529–536. doi: 10.1111/j.1748-5827.2006.00109.x. [DOI] [PubMed] [Google Scholar]
- Sako T, Shimoyama Y, Akihara Y, Ohmachi T, Yamashita K, Kadosawa T, Nakade T, Uchida E, Okamoto M, Hirayama K, Taniyama H. Neuroendocrine carcinoma in the nasal cavity of ten dogs. Journal of Comparative Pathology. 2005;133:155–163. doi: 10.1016/j.jcpa.2005.04.002. [DOI] [PubMed] [Google Scholar]
- Saunders JH, van Bree H, Gielen I, De Rooster H. Diagnostic value of computed tomography in dogs with chronic nasal disease. Veterinary Radiology & Ultrasound. 2003;44:409–413. doi: 10.1111/j.1740-8261.2003.tb00477.x. [DOI] [PubMed] [Google Scholar]
- Saunders JH, Clercx C, Snaps FR, Sullivan M, Duchateau L, Van Bree HJ, Dondelinger RE. Radiographic, magnetic resonance imaging, computed tomographic, and rhinoscopic features of nasal aspergillosis in dogs. Journal of the American Veterinary Medical Association. 2004;225:1703–1712. doi: 10.2460/javma.2004.225.1703. [DOI] [PubMed] [Google Scholar]
- Thrall DE, Tobertson ID, McLeod DA, Heidner GL, Hoopes PJ, Page RL. A comparison of radiographic and computed tomographic findings in 31 dogs with malignant nasal cavity tumors. Veterinary Radiology & Ultrasound. 1989;30:59–66. [Google Scholar]
- Tromblee TC, Jones JC, Etue AE, Forrester SD. Association between clinical characteristics, computed tomography characteristics, and histologic diagnosis for cats with sinonasal disease. Veterinary Radiology & Ultrasound. 2006;47:241–248. doi: 10.1111/j.1740-8261.2006.00134.x. [DOI] [PubMed] [Google Scholar]
- Van Camp S, Fisher P, Thrall DE. Dynamic CT measurement of contrast medium washin kinetics in canine nasal tumors. Veterinary Radiology & Ultrasound. 2000;41:403–408. doi: 10.1111/j.1740-8261.2000.tb01861.x. [DOI] [PubMed] [Google Scholar]
- Voges AK, Ackerman N. MR evaluation of intra and extracranial extension of nasal adenocarcinoma in a dog and cat. Veterinary Radiology & Ultrasound. 1995;36:196–200. [Google Scholar]


