Abstract
Regular three-dimensional periodic structures have been observed in the scales of over half a dozen butterfly species. We compare several of these structures: we calculate their photonic bandgap properties; measure the angular variation of the reflection spectra; and relate the observed iridescence (or its suppression) to the structures. We compare the mechanisms for iridescence suppression in different species and conclude with some speculations about form, function, development and evolution.
Keywords: optics, colour, butterfly, photonic crystal
1. Introduction
Structural colour results when light interacts with physical structures that have variations on a spatial scale comparable with the wavelength of light. Iridescence is usually said to be the change of hue with the angle of observation. Iridescence may also occur over any range of wavelengths (and is not necessarily restricted to the range visible to humans). Although iridescence requires structural colour, the converse is, of course, not true. Related phenomena include change of intensity and change of polarization with the angle of observation.
Structural colour occurs in a variety of species, but perhaps the most diverse range of structures is exhibited by the wing scales of butterflies. To date, the most complex scale architectures known are the regular three-dimensional periodic lattices that occur within the lumen of some scales. Observation of these structures in butterflies dates back at least three decades (Morris 1975; Allyn & Downey 1976; Ghiradella & Radigan 1976). Similar three-dimensional geometries have also become of interest to physicists (who have dubbed them photonic crystals) in the last two decades. These photonic crystals are of technological importance since some (but not all) of them can be the basis of devices that block the propagation of certain frequencies in all possible directions (the so-called complete photonic bandgap devices). The photonics community has explored an extremely large variety of geometries with names or descriptions such as inverse opal (Wijnhoven & Vos 1998), woodpile (Ho et al. 1994), diamond network (Ho et al. 1990) and Yablonovite (Yablonovitch et al. 1991). Thus, many of these names and the corresponding models have also been variously proposed for the structures observed in butterfly scales.
The earliest proposal for a geometry was a simple cubic (SC) arrangement of spherical air holes in a chitin background for the species Callophrys rubi (Morris 1975). Later authors (Ghiradella & Radigan 1976) proposed instead a face-centred cubic (FCC) arrangement of air holes (this is also called the inverse opal structure). This same structure has also been proposed by various authors for Cyanophrys remus, Parides sesostris, Callophrys dumetorum and Mitoura gryneus (Vukusic & Sambles 2003; Kertész et al. 2006; Prum et al. 2006). Another extremely similar model that shares the same FCC lattice and has the same local topology is the woodpile structure proposed for species of the genus Polyommatus (Biró et al. 2003). A tetrahedrally coordinated network of struts was previously proposed for Teinopalpus imperialis, although the measured lattice was different from FCC (Argyros et al. 2002). Wickham (2006) used transmission electron tomography to compare the lattice structures of three species (P. sesostris, C. rubi and M. gryneus), and concluded that they mostly share similar tetrahedral structures but that the lattices differed slightly in their degree of symmetry. For example, the lycaenid C. rubi had the most symmetric structure with equal length lattice vectors and angles close to those of a body-centred cubic (BCC) lattice; M. gryneus was similar but with one lattice vector significantly longer than the other two and angles that did not correspond to any of the common lattices; finally, although the angles in P. sesostris were all equal to each other, they were different from that expected in either the BCC or the FCC. It was also noted there that M. gryneus had a combination of fourfold- and threefold-coordinated nodes. Most recently, it has been proposed that structures in most of these species might instead be modelled by a gyroid (Michielsen & Stavenga 2008). The gyroid also has a BCC lattice, but it has a locally threefold-coordinated topology.
Certainly, it still appears difficult to determine a unique or unambiguous geometry for these structures. The spectral response of these structures is, of course, primarily determined by the lattice periodicity, index contrast, filling fraction and the geometry within the unit cell. However, the spectral response may also be complicated by a number of other factors such as the number of unit cells in the crystal structure, the size of crystal domains and the presence of other structures that may also interact with the incident or reflected light. In this paper, we hope to clarify the quantitative and qualitative differences between different models and focus attention on those aspects relevant to the biological context. We compare structural features, spectral measurements and calculations highlighting both generic and distinguishing properties.
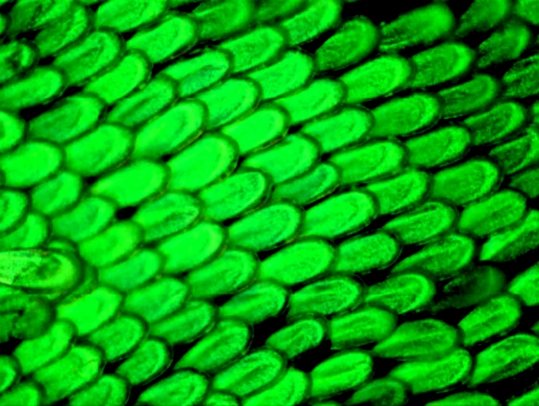
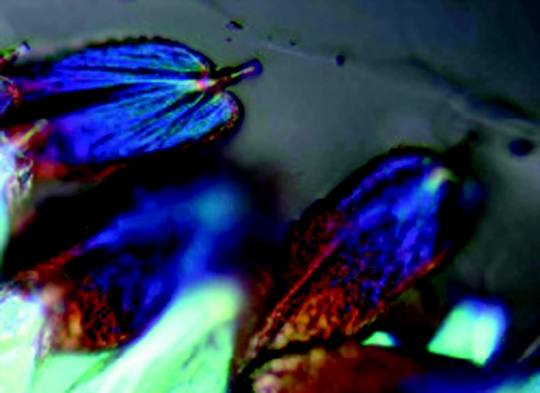
An optical image of a section of the wing of P. sesostris is shown in figure 1. Despite being produced by a regular lattice, the green coloration is thought to be largely non-iridescent (Ghiradella 1989; Prum et al. 2006). Calculations based on any of the proposed models for the periodic lattice would predict that the scales should be much more iridescent than they actually appear. The mechanism usually invoked to explain this discrepancy is that the crystal is made up of many randomly oriented small domains (Ingram & Parker 2008). We show later that this explanation can only be true for some species. Indeed, when the scales from P. sesostris are removed and viewed from below, they exhibit a striking iridescence (figure 2), suggesting that some other mechanism rather than polycrystalline averaging is responsible. The relevant mechanisms are elucidated by comparing different species.
Figure 1.
Optical image of a section of the dorsal wing from P. sesostris. From this side, the scales do not exhibit much iridescence.
Figure 2.
Optical image of the underside of individual scales from P. sesostris. From this side, the scales exhibit strong iridescence.
In §2, we give a detailed but not too mathematical explanation of photonic bandgap theory concentrating on those visualizations and tools that help us understand the nature of the iridescence produced by periodic lattice structures. We then investigate the importance of the specific lattice structure in §3 by comparing the bandgap properties of different periodic structures. We include each of the major crystal types (SC, FCC and BCC) that have been variously proposed for the geometry and discuss what features are common and what features can be used as a signature to optically distinguish these different structures. In §4, we present and compare the microstructures of the scales from four butterflies: two of them, P. sesostris and T. imperialis, are papilionids and two of them, C. rubi and M. gryneus, are lycaenids. They have similar periodic lattices but differ in that the papilionids have a honeycomb structure above the photonic crystal. While the periodic lattices are similar, the four species differ in other aspects such as domain size. We then explain how variation in these additional features of the scale modifies the intrinsic iridescence of the periodic lattice. The arguments are further supported in §5 by quantitative measurements and comparisons of the variation of reflection spectra with angle.
We conclude this paper with a discussion of the role of polarization and then present some speculations and suggestions for fruitful areas for future activity.
2. Background optics
When waves interact with a periodic structure, waves with some frequencies can propagate through the structure while waves with other frequencies are blocked. The observed effect is that light having such blocked frequencies will be strongly reflected by the structure. The range of blocked frequencies is called a bandgap or reflection band. The bandgaps are determined by the Fourier properties of the structure and vary with the direction of propagation and polarization. Since bandgaps can vary with the direction of propagation, such structures are usually iridescent. For those readers without a theoretical optics background, we give a very brief recapitulation of photonic band theory attempting to use a minimum of mathematics.
The natural description of a periodic structure uses Fourier analysis. Solid-state physics has developed powerful geometric visualizations to capture the most important aspects of such a Fourier analysis for regular crystal structures. There are a variety of different three-dimensional crystal structures (e.g. trigonal, rhombohedral, FCC) that differ in the arrangement of the crystal planes also called Bragg planes. The Brillouin zones (BZs) are a geometric construction that help reveal many important properties of the periodic structure. For example, the first BZs for the three simplest lattices are shown in figure 3. Note that the BZ for the SC lattice has six identical square faces, the BZ for the BCC lattice has 12 identical rhombus-shaped faces and the BZ for the FCC lattice has eight hexagonal faces and six square faces.
Figure 3.
The first BZ for different lattice structures. (a) Simple cubic, (b) BCC and (c) FCC.
The details on how to construct these shapes can be found in any standard text on solid-state physics (Kittel 1996). However, the most important thing to know is that the faces of a BZ correspond to different crystal planes. If one were to perform a Fourier series analysis of a periodic structure, each face or crystal plane would correspond to a different term in that series. For those with more mathematical background, the directions perpendicular to each face correspond to what are known as reciprocal lattice vectors. These vectors contain information about the spatial periodicities of the structure. The shortest vectors correspond to leading terms in the Fourier expansion, and the longer vectors correspond to higher harmonics. Technically, the first BZ is the smallest geometric figure formed by planes that perpendicularly bisect these reciprocal lattice vectors. Thus, each face of the first BZ corresponds to one of the leading terms in the Fourier series expansion of the periodic structure. The BZ can be used as the basis for both a quick qualitative estimate of the reflected colours and a complete detailed numerical calculation of bandgaps.
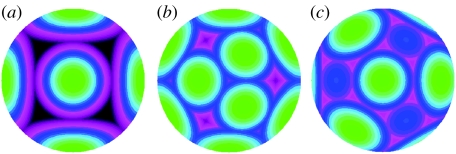
The reflected colours can be estimated from the BZ without detailed calculation as follows. The distance of each point on the surface of the BZ from the centre of the BZ is directly proportional to the frequency in the centre of the bandgap (i.e. the reflected colour). Thus, the vertices (which are the points furthest out) represent higher frequencies (shorter wavelengths) and the centres of faces (which are closer in) represent lower frequencies (longer wavelengths). This variation is the ultimate origin of the iridescence. Figure 4 shows the iridescence for the structures in figure 3 by presenting the hue as a function of angle over a complete hemisphere. For the sake of making comparisons, the longest wavelength in each case was chosen to be in the green. Wavelengths ranging into the UV are represented visually by progressively darker shades of violet.
Figure 4.
Estimated variation of reflected colour with angle for different lattice structures. (a) Simple cubic, (b) BCC and (c) FCC.
We predict that for a SC structure, which has a BZ in the shape of a cube (figure 3a), the highest and lowest reflected frequencies should differ by . In figure 4a, note that the faces reflect in the green and the vertices reflect in the UV. The closer the BZ is to approximating a sphere, the less iridescent the reflected colours will be. The BCC structure (figure 3b) has a smaller ratio of . Likewise, in figure 4b, the faces reflect in the green but the vertices now reflect in the violet. Finally, the FCC structure (figure 3c) has the smallest ratio of only . In figure 4c, the hexagonal faces reflect in the green, the square faces reflect in the blue and the vertices reflect in the violet.
The indicated hues correspond to the centre frequency in each gap. The width of each gap is related to the magnitude of the corresponding Fourier component. The magnitudes of the Fourier components depend on the local structure but also, more importantly, on the index contrast (i.e. the ratio of the highest and lowest refractive indices occurring in the structure). As this contrast increases, these individual bandgaps become wider. If the gaps are sufficiently wide, then they will overlap. If all the gaps overlap, then we have what is called a complete bandgap; that is, a common range of frequencies or wavelengths that are reflected from any direction and any polarization. Structures with complete bandgaps will appear to be non-iridescent (or at least much less iridescent). In fact, a minimum index contrast is required to produce gaps wide enough to overlap: for FCC structures, this ratio is at least 2. There are no known biological materials with a high enough index and thus no biophotonic crystals can have complete bandgaps. We hope that this clarifies a common misconception that all photonic crystals must have complete bandgaps, and emphasizes that the degree of iridescence can vary significantly with the symmetry of the crystal structure (in addition to the more obvious factors such as index contrast and filling fraction).
A variety of programs exist that can calculate the bandgaps exactly. In §3, we use the MIT photonic bands program (Johnson & Joannopoulos 2002), which most easily models the structures by an assemblage of simple geometric objects such as spheres and interconnecting cylinders.
3. Comparing band structures
In this section, we calculate and compare band structures for different periodic structures. Two different types of models have appeared in the literature: those that model the lattices by skeletons of interconnecting struts and those that use smooth surfaces (such as the minimal surfaces formed by lipid–water mixtures; Hyde et al. 1997). Different models that share the same leading terms in their Fourier series will exhibit very similar optical properties; in particular, skeletal and minimal surface models differ only in their higher order Fourier harmonics. The MIT photonic bands program does allow both types of models but the strut models are slightly easier to implement.
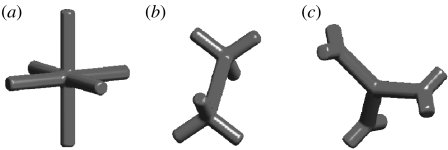
We have constructed skeletal strut models of three common periodic structures, and one primitive unit of each of these structures is shown in figure 5. Note that the outermost struts in each structure occur as three pairs of corresponding struts that point in the same direction; these pairs of struts join adjacent primitive units together to create a three-dimensional periodic structure.
Figure 5.
Strut or skeleton models of the simplest geometries associated with different lattice structures. (a) Sixfold-coordinated P-structure in the SC lattice, (b) fourfold-coordinated D-structure in the FCC lattice and (c) threefold-coordinated G-structure in the BCC lattice.
Note also that the P-structure has nodes where six struts connect at mutual angles of 90°; the D-structure has nodes where four struts connect at mutual angles of 109.47°; and the G-structure has nodes where three struts connect at mutual angles of 120°.
The topological connectivity and symmetry of these three structures also correspond to the three fundamental cubic minimal surfaces (Hyde et al. 1997). Minimal surfaces have also been proposed (Ghiradella 1989; Ingram & Parker 2008; Michielsen & Stavenga 2008) as possible candidates for the periodic lattices observed in butterfly wing scales since they are ubiquitous in nature and have interesting self-assembly properties. For some other visualizations of the minimal surfaces and corresponding skeletal models, we refer the reader to Hyde et al. (1997) and Michielsen & Stavenga (2008).
The Fourier series of the refractive indices all have the form
| (3.1) |
where is the average index of the structure; Δ is proportional to the index contrast; and F(x, y, z) represents the leading terms in the series. Both and Δ will vary with the volume fraction of chitin in butterfly wing scales. Chitin exhibits some absorption that could be modelled by allowing and Δn to have a small imaginary part. This small effect has been ignored since it does not alter any of the conclusions made in this paper.
The form of the function F for the three different structures is
| (3.2) |
| (3.3) |
| (3.4) |
Note that elsewhere in the literature these expressions may have been written in different but mathematically equivalent forms. These same trigonometric functions can also be used to approximate minimal surfaces. In such models, the boundary between chitin and air is defined by an equation of the form
| (3.5) |
or, in other words, a level set. For strut-based models, the volume fraction of chitin can be chosen by varying the thickness of the struts. For minimal surface models, the volume fraction can be chosen by varying the parameter c. For c=0, a 50 per cent volume fraction is obtained.
The mathematically inclined will note that the leading terms precisely capture the rotation and reflection symmetries of their respective structures. Importantly, FP and FD have inversion symmetry, whereas FG does not and thus corresponds to a chiral structure (i.e. it is not equivalent to its mirror image). Furthermore, we would like to point out how the Fourier series relate to the BZ. The three terms in FP correspond to the three pairs of opposite faces of the BZ in figure 3a. Likewise, the six terms in FG correspond to the six pairs of opposite faces of the BZ in figure 3b. Finally, the four terms in FD correspond to the four pairs of opposite hexagonal faces of the BZ in figure 3c. The smaller square faces on this BZ do not have any Fourier terms associated with this type of tetrahedral geometry (though there are more complicated higher connectivity minimal surfaces, such as the C(P) structure, that do contain such terms). This lack of leading terms in some directions is important; thus, in figure 4c, we expect to see wider bandgaps in the direction of the hexagonal faces (which reflect in the green) and much narrower gaps in the direction of the square faces (which reflect blue).
The band structure of these geometries has been investigated previously (Michielsen & Kole 2003) in a technological context, where large refractive index contrasts were assumed and the authors were interested in complete photonic bandgaps. Here, we focus on the iridescence and the polarization properties, which are more relevant for low-contrast structures.
For low index contrast systems (such as chitin–air), the location and width of the bandgaps are approximately proportional to the relevant Fourier coefficients. Thus, the qualitative structure of the bandgap diagram will change in a systematic way with volume fraction and index contrast: increasing the index contrast will increase the width of the bandgaps and increasing the average index (either by changing the contrast or changing the volume fraction) will systematically shift the mid-gap frequency of all the bandgaps. Thus, it is sufficient to compare different lattice types for just one typical combination of contrast and volume fraction to understand their qualitative behaviour.
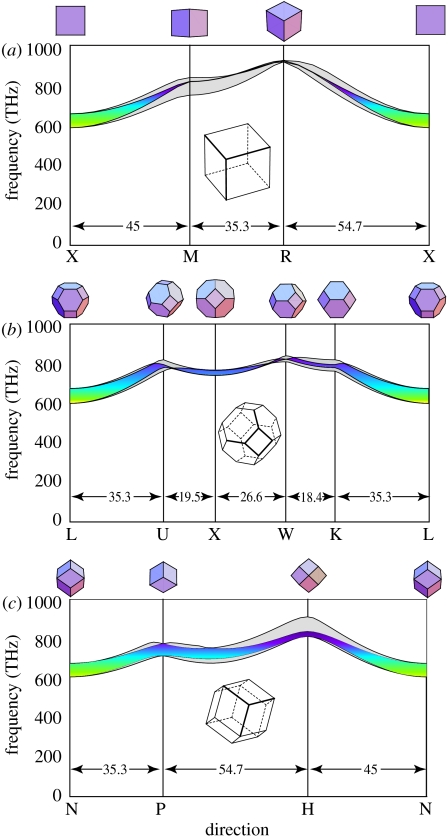
The photonic bandgaps were calculated for a volume fraction of 50 per cent and refractive index of 1.5 and are shown in figure 6. For the purpose of making comparisons between different lattices, the overall lattice scale sizes were chosen to yield the same lowest frequency bandgaps. The vertical scale on each chart is frequency and the bandgap (where no propagating solutions exist) has been coloured with the corresponding hue. Frequencies in the UV are shown by progressively darker shades of violet. In addition, there are polarization bandgaps: these are frequency ranges where only one polarization state can propagate and are shaded in grey. In such cases, one polarization state can propagate through the structure, but the other polarization state is reflected. The horizontal axis shows the conventional letters used in solid-state physics to denote special directions associated with each BZ. The corresponding orientations of the BZ are shown pictorially across the top for those unfamiliar with this notation. The angles between these directions (in degrees) are also indicated in figure 6. The slope of the bands can immediately reveal the degree of iridescence as can the variation of the depicted hues. Structures with steep bands are more iridescent than structures with flatter band diagrams.
Figure 6.
Comparison of the band diagrams for different crystal structures. The refractive index and volume fraction are 1.5 and 50%, respectively. (a) SC with P-type sixfold coordination. (b) FCC with D-type fourfold coordination. (c) BCC with G-type threefold coordination.
Let us first focus on generic properties. The relative width of the bandgap at its widest is approximately 10 per cent for all three structures. This width would vary with the volume fraction of chitin, but would vary in about the same way for all three structures. Also note that, in all cases, the colour changes from green to blue over a 30°–40° tilt. Although the amount of colour change depends on index contrast and volume fraction, the angular tilt is a fixed property of the lattice and does not change with volume fraction.
Note that for the D-structure (figure 6b), the width of the bandgap in the X-direction (square face) is much narrower than that in the L-direction (hexagon face), as expected from the presence and absence of leading terms in the Fourier series. Under white light illumination, a narrower bandgap will reflect less light than a wider gap. This effect will act to partially suppress iridescence since in directions which reflect blue/violet, there will not be as much reflected light as in the directions that reflect green/yellow. Also as expected, the P-structure (figure 6a) is most iridescent but, in addition, at the shorter wavelengths, this reflected light should be highly polarized. Likewise, the G-structure (figure 6c) shows strong polarization effects in the H-direction where it is reflecting in the violet and UV. Thus, while some iridescence features are common to all these structures and there are quantitative differences between the structures, the most striking difference is in the polarization properties (we return to this point later in this paper).
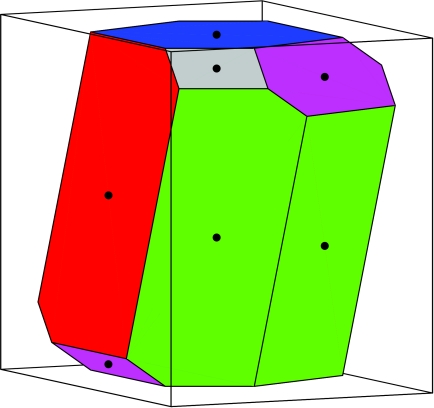
In addition to the three regular models in figure 5, the photonic crystal in T. imperialis was also reconstructed using electron tomography (Argyros et al. 2002). The crystal was measured to be a distorted version of the D-structure in figure 5b where the angles between struts are no longer equal and the struts are of different lengths. The corresponding distorted BZ is shown in figure 7. The approximate colours in figure 7 suggest that although the structure should look green from certain directions, it should also reflect reds, blues, violets and even UV from other directions.
Figure 7.
The first BZ corresponding to the distorted D-structure of T. imperialis measured in Argyros et al. (2002). The colours correspond to the wavelength of the waves reflected in the direction normal to that face. Grey indicates UV.
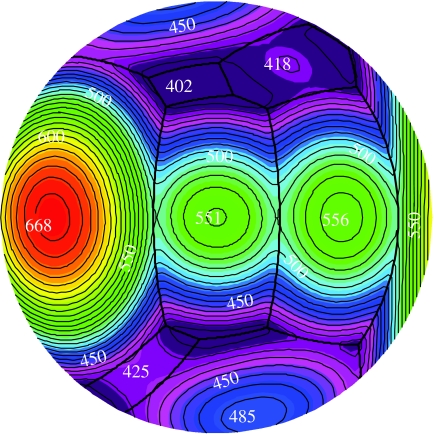
We calculated the bandgaps of the structure using the published data and description of the structure (Argyros et al. 2002). The dimensions and coordinates defining the structure and the various special points on the surface of the BZ are all available in a format compatible with the MIT photonic bandgaps program in the electronic supplementary material. The optical properties of the distorted D-structure closely resemble the regular D-structure. For example, the bandgaps in directions corresponding to the six-sided faces are large (relative widths of approx. 10%), whereas those in the directions corresponding to the four-sided faces are small. The results of a quantitative calculation of the central bandgap wavelength in all possible directions are shown in figure 8.
Figure 8.
Hemispherical map of hues corresponding to the calculated central bandgap wavelengths. Black lines denote the edges of the BZ shown in figure 7. The contours are labelled with the wavelength in nm.
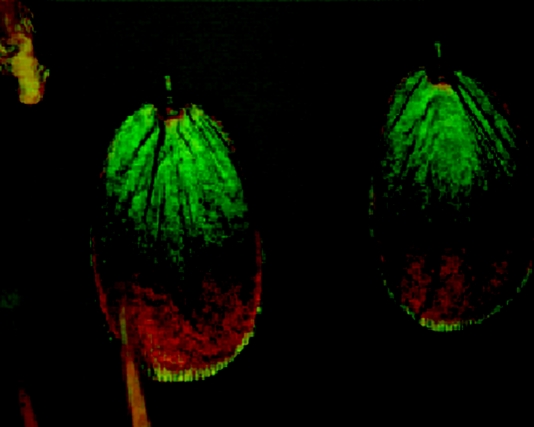
The most obvious difference between figure 8 and the iridescence maps in figure 4 is the presence of reflections in the longer wavelength (orange). We were able to see some visual evidence of this by looking at the underside of some scales from T. imperialis as shown in figure 9. The differences between figures 2 and 9 might be due to the periodic crystals in two butterflies having different structures, or possibly the same crystal aligned differently.
Figure 9.
Optical image of the underside of individual scales from T. imperialis.
4. Scale microstructures
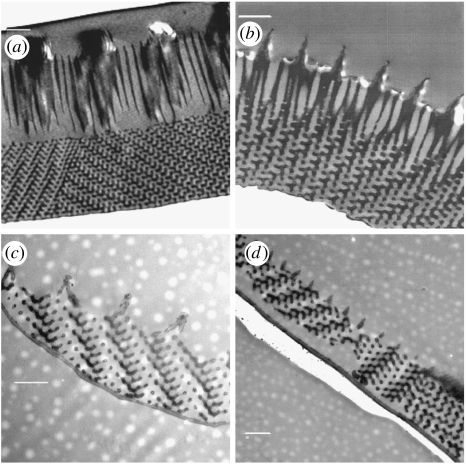
The transmission electron microscopy (TEM) sections of green scales from four different butterflies are shown in figure 10. They reveal the photonic crystal and other structures that occur in the scale. The bottom part of each scale shows a regular periodic structure, the top part shows a series of ridges. In figure 10a,b, there are also a series of vertical columns that run down from the ridges towards the crystal. We refer to these columns as the honeycomb structure.
Figure 10.
TEM images of green scales from four different butterflies. Scale bar, 1 μm. (a) Parides sesostris, (b) T. imperialis, (c) C. rubi and (d) M. gryneus.
Comparisons of various TEM sections taken through the crystals in a variety of directions reveal that not only are the crystals in all four species topologically similar, but they also have extremely similar dimensions. However, the measurements also reveal a number of features that vary from species to species: specifically, the typical domain size of the crystals; the depth of the crystal; and the depth of the honeycomb structure that might lie above the crystal. These differences are tabulated in table 1.
Table 1.
Comparison of feature sizes in four species having similar three-dimensional photonic crystals. (All dimensions are in μm.)
| domain size | crystal depth | honeycomb depth | |
|---|---|---|---|
| P. sesostris | 25±3 | 3.7±0.1 | 4.1±0.2 |
| T. imperialis | 6±3 | 3.3±0.1 | 0.9±0.2 |
| C. rubi | 3.6±0.9 | 1.5±0.4 | — |
| M. gryneus | 2.8±0.7 | 1.4±0.4 | — |
There is a clear systematic variation in feature sizes as one proceeds down table 1: P. sesostris has the largest domains, the deepest crystal and a honeycomb structure that is actually deeper than the underlying photonic crystal, whereas M. gryneus has the smallest domains, a crystal that is only a few periods deep and a non-existent honeycomb. Although the crystal is the same (or similar), these other differences will manifest as different modifications to the iridescence. Small, randomly oriented domains will tend to suppress iridescence, and crystals that are only a few periods deep have more smeared out (less well-defined) bandgaps. The different effects that these features have on the reflection spectra were quantified by measuring the iridescence in each species from both sides of the scales.
5. Spectral measurements for different species
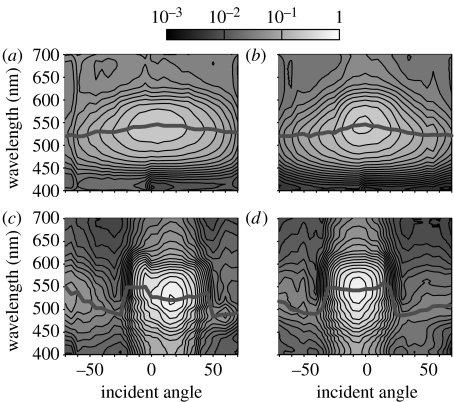
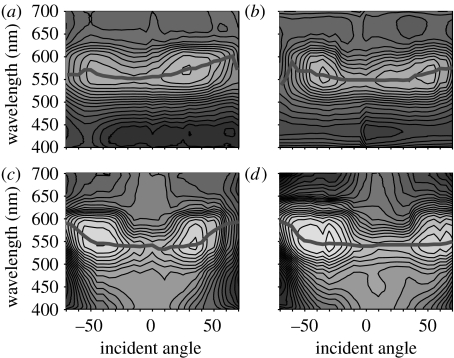
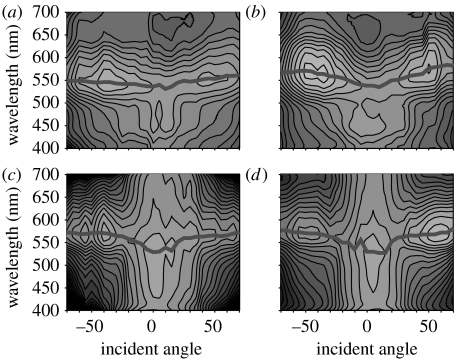
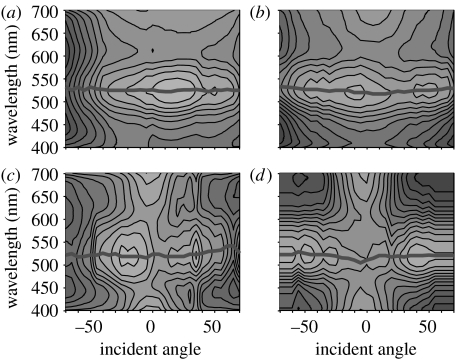
Single-scale spectral measurements were carried out using a Zeiss microspectrophotometer. This is a modified microscope, in which the illumination and detection use the same optics. This system is limited to visible wavelengths in the range of 400–700 nm, and the angles of incident and reflected light were restricted to ±33.3° owing to the numerical aperture of the lens (Zeiss Epiplan 50×, 0.55). The sample was mounted using black double-sided carbon tape onto a glass slide on a tilt stage with a range of ±70° (and an accuracy of ±2.5°). The samples were tilted along the transverse and longitudinal axes of the scales. Measurements were taken from both the top- and underside of scales. However, difficulties in manipulating single scales meant that the top- and underside measurements were not necessarily performed on the same individual scale. A number of scales were tested in both orientations to confirm that the scale-to-scale variation is smaller than the effects described below. The reflected intensity has been normalized to specular reflection from a standard Al reference (Palik 1991). The variation of reflected intensity with both angle and wavelength is shown in figures 11–14. Each figure shows four contour plots comprising combinations of measurements from above and below and tilting the scale in two different directions. The contour shading represents the logarithm of the intensity. All the reflection spectra show a peak near the centre of the visual spectrum; the variation of the position of this peak with angle is indicated by the thick grey curves. (Some of the spectra also show additional intensity peaks at the extreme ends of the visual spectrum.)
Figure 11.
Reflection spectra for P. sesostris. Variation of reflected intensity from scales (a,b) topside and (c,d) underside for tilts in both (a,c) longitudinal and (b,d) transverse directions. Contour shading is logarithmic from 0.1% (black) to 100% (white).
Figure 12.
Reflection spectra for T. imperialis. The other descriptions are the same as given in the legend of figure 11.
Figure 13.
Reflection spectra for C. rubi. The other descriptions are the same as given in the legend of figure 11.
Figure 14.
Reflection spectra for M. gryneus. The other descriptions are the same as given in the legend of figure 11.
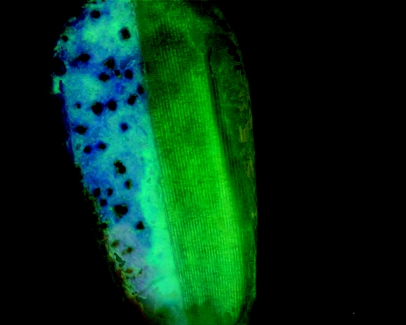
First, consider figure 11 for P. sesostris. There is a dramatic difference between the top and bottom measurements. From above, the reflection spectrum does not vary much with angle and the peak wavelength varies slowly between 550 and 525 nm. From below, the scale is strongly iridescent: the spectrum changes abruptly at certain angles and the peak wavelength shifts suddenly from approximately 550 to approximately 500 nm. The range of angles over which the peak is at longer wavelengths, and the tilt at which the shift to shorter wavelengths occurs, is consistent with the bandgap calculations in figure 6. (Unfortunately, this behaviour does not uniquely confirm any particular crystal lattice.) The intensity of the reflectance near normal incidence is also considerably higher than for the topside measurements, where the intensity is much more uniform across the range of viewing angles. Thus, the spectral measurements confirm the visual observations in figures 1 and 2 that the scale is only iridescent from below. We attribute this difference in iridescence to the presence of the honeycomb structure. To further confirm this idea, the honeycomb was removed from half the scale with double-sided tape and the optical image of such a scale is shown in figure 15. The exposed half clearly shows different colorations, suggesting that the honeycomb is indeed suppressing the shorter wavelengths. (Some speculations about how the honeycomb achieves this suppression are discussed later.) The dark spots are localized holes or defects in the structure that occur near domain boundaries.
Figure 15.
Optical image of the topside of a scale from P. sesostris with the honeycomb removed from the left half.
The difference between the top and bottom measurements for T. imperialis in figure 12 is not nearly as pronounced. This can mostly be attributed to the honeycomb structure being much shorter than in P. sesostris (table 1). The honeycomb structure in P. sesostris was actually deeper than the lattice structure, whereas in T. imperialis the honeycomb is less than one-third of the depth of the crystal lattice. Thus, as expected, the top and bottom of the T. imperialis scales have a more similar appearance. The domain size in T. imperialis is also approximately four times smaller than in P. sesostris, and this will also tend to suppress the iridescence; thus, the variation in peak wavelength is not as dramatic. Note that, at wide angles, the shift is towards longer wavelengths (shifting from 550 to approx. 600 nm), consistent with the visual observations in figure 9 which shows hues ranging from green at the top to orange near the bottom. This might indicate that the crystal lattice is different from that in P. sesostris or that it is the same crystal but seen from directions that (on average) reflect longer wavelengths (i.e. the regions of the BZ shown in the left of figure 8).
If we now compare T. imperialis with C. rubi, we expect that the complete absence of any honeycomb structure should imply that the degree of iridescence is similar from above and below, as is indeed indicated by the thick grey curves in figure 13. The absence of a honeycomb structure would normally imply more iridescence, but the smaller domain size compensates for this. Note that the variation in the peak wavelength is similar but the variation in intensity is less.
Finally, M. gryneus has the smallest domain size of all (table 1) and thus should show the least iridescence, as confirmed by the thick grey curves in figure 14. The argument that polycrystalline photonic structures should appear matter rather than iridescent has been made several times previously in the literature (see a recent review in Ingram & Parker 2008), but we see here that it is not the only mechanism that can suppress iridescence.
6. The role of polarization
Thus, we see that the properties of the crystal lattice alone do not determine the appearance of the scales, but that they must be considered in conjunction with other effects. Furthermore, the variation in hue does not uniquely determine or confirm the crystal lattice structure since many different periodic structures can produce similar effects.
Many of the qualitative features of the band structure can be obtained from group theoretical arguments (Altmann 1991) that exploit the symmetry of the structure and its BZ, and thus do not depend on detailed specifics of the models. In particular, these arguments predict such features as the complete closing of the bands in the direction denoted R for the P-structure as seen in figure 6a. They also predict the presence of directions that have strong polarization effects, such as the direction M for the P-structure or the direction H for the G-structure as in figure 6a,c. Light interacting with the horizontal and vertical struts of the P-structure will experience linear polarization effects, whereas light interacting with the chiral G-structure can experience circular polarization effects. The D-structure, on the other hand, exhibits only very small polarization effects since the BZ closely approximates a sphere and the tetrahedral structure never shows a strong difference between different directions.
In summary, the band diagrams lead us to expect P-structures to reflect linearly polarized light in certain directions, and we expect the polarized reflections to have shorter wavelengths than the unpolarized reflections in other directions. Similarly, we expect the chiral G-structures to reflect circularly polarized light in certain directions, and we expect the polarized reflections to be at much shorter wavelengths than for the unpolarized reflections in other directions. Thus, if the structure looks green in the visible from most directions, then from certain directions it will be circularly polarized in the UV. This last property (unpolarized green but polarized UV) should persist even for structures made from differently oriented domains. In fact, strong polarization effects have been observed (Vukusic & Sambles 2001) for reflections from P. sesostris. It was found that, under normal illumination, the scales appeared green, but that the different domains appeared to have various hues of blue, violet and black (interpreted as UV) when viewed through a crossed linear analyser. This suggests that the structure in P. sesostris is unlikely to be a D-structure and is consistent with a gyroid. These effects certainly make an appealing case for more detailed characterization of the polarization of low-contrast photonic crystals and might help unambiguously identify the geometry of the structures.
7. Discussion and speculations
In addition to factors such as the periodicity and filling fraction, we have seen that the appearance of the scales of the different species is modified by a combination of structural factors: including but probably not restricted to the type of photonic crystal, the domain size and the presence of other intervening structures such as the honeycomb. We have shown how calculations of the photonic properties of the crystal lattices are consistent with measurements of the spectral properties provided the effect of these other features is included. We have also tried to isolate features that are characteristic of particular crystal structures as opposed to features that are generic. Thus, surprisingly, quantitative features such as the location or width of the bandgap or even the amount of tilt required to change from green to blue may be the same for many different structures, whereas qualitative features such as reflection of polarized light may help characterize the symmetry of the lattice.
In addition, we have seen that there is more than one way to achieve iridescence suppression. We propose two possible mechanisms for iridescence suppression by the honeycomb. One possibility is that the honeycomb acts as a collimating structure (the honeycomb structure is reminiscent of an optical fibre bundle or the naturally occurring crystal ulexite), taking light that is incident at wide angles and refracting it into a narrower numerical aperture. This explanation would imply that the topside spectrum in species such as P. sesostris is simply a stretched version of the underside spectrum. One could try to confirm this by varying the numerical aperture of the detection optics, though it was difficult with our set-up to make measurements at angles of incidence beyond 70°. A different explanation is that the honeycomb may help to randomize the angles of the incident and reflected beams (acting similar to frosted glass or a translucent cover). Thus, at each angle, light is reflected from different regions of the BZ giving an average or uniform perceived colour that is therefore relatively constant over all viewing angles.
If different crystal lattices occur in different species, it raises the question: is it merely an accident of history or are the different band structures or polarization responses relevant to some function? On the other hand, if it turns out that all three-dimensional periodic lattices in butterflies have the same structure, then this raises equally interesting questions: is this structure developmentally constrained; is it optimal in some sense; or is it again an accident of history? For example, the reflection of non-iridescent green has often been cited as a mechanism of camouflage. That some structures can simultaneously be reflecting circularly polarized light in the UV raises tantalizing questions about cryptic signalling in regions of the spectrum unavailable to certain predators.
That some of these three-dimensional periodic structures can arise as minimal surfaces (such as soap films that minimize surface tension by forming shapes with mean constant curvature) has also led to speculation that the development of these structures may be in part based on self-assembly (Ghiradella 1989; Ingram & Parker 2008; Michielsen & Stavenga 2008). If so, what are the implications then for the developmental processes of adjacent structures such as the honeycomb? Indeed, one can also ask questions about the evolution and development of other features such as domain size or what controls the final depth of the crystal lattice or the depth of the honeycomb. A comparative study of many species may provide clues or uncover phylogenetic or environmental patterns within the diversity of features. Within the limited study of the four species here, we point out that the smaller butterflies have domain averaging while the larger butterflies have a honeycomb structure (perhaps there is a material/weight cost to have a honeycomb present).
Biomimetics is a fast growing field based on technology inspired by naturally occurring processes and structures. The evolution of biological structures can be a complicated combination of historical accidents, developmental constraints and environmental pressures, and thus may not necessarily represent the simplest or optimal approach to performing a particular function. Nevertheless, the diversity of structures observed may lead to new ideas or clues. For example, structural colour has certain technological advantages over pigments (lifetime, tunability, etc.). Having control over the degree of iridescence (to either enhance it or suppress it) is also important. For example, suppression of angle-dependent effects is important in permanent colour and display technologies. It has been often assumed that structures having complete photonic bandgaps are necessary to avoid angle dependence and thus one needs high index contrasts. Unfortunately, there seems to be a general trend that the more easily processed materials (such as polymers) tend to have lower refractive indices. The butterfly examples show, however, that it may be possible to produce some of the features of a complete photonic bandgap, notably colour that does not change with angle, with low index contrast systems.
By studying several species and comparing structure and spectral appearance, we have answered some questions about the cause and suppression of iridescence but, in doing so, have also raised some new and equally interesting questions for the future.
Acknowledgments
The authors thank the Australian Research Council for financial support and Lars Jermiin for interesting discussions.
Footnotes
One contribution of 13 to a Theme Supplement ‘Iridescence: more than meets the eye’.
Supplementary Material
MPB control file—defines structure
MPB control file—defines lattice vectors
MPB control file—run file
References
- Allyn A.C., Downey J.C. Diffraction structures in the wing scales of Callophrys siva siva Lycaenidae. Bull. Allyn Mus. 1976;40:1–6. [Google Scholar]
- Altmann S.L. Clarendon Press; Oxford, UK: 1991. Band theory of solids. An introduction from the point of view of symmetry. [Google Scholar]
- Argyros A., Manos S., Large M.C.J., McKenzie D.R., Cox G.C., Dwarte D.M. Electron tomography and computer visualisation of a three-dimensional photonic crystal in a butterfly wing-scale. Micron. 2002;33:483–487. doi: 10.1016/S0968-4328(01)00044-0. [DOI] [PubMed] [Google Scholar]
- Biró L.P., et al. Role of photonic-crystal-type structures in the thermal regulation of a Lycaenid butterfly sister species pair. Phys. Rev. E. 2003;67:021 907. doi: 10.1103/PhysRevE.67.021907. [DOI] [PubMed] [Google Scholar]
- Ghiradella H. Structure and development of iridescent butterfly scales—lattices and laminae. J. Morphol. 1989;202:69–88. doi: 10.1002/jmor.1052020106. [DOI] [PubMed] [Google Scholar]
- Ghiradella H., Radigan W. Development of butterfly scales: II. Struts, lattices and surface tension. J. Morphol. 1976;150:279–298. doi: 10.1002/jmor.1051500202. [DOI] [PubMed] [Google Scholar]
- Ho K.M., Chan C.T., Soukoulis C.M. Existence of a photonic gap in periodic dielectric structures. Phys. Rev. Lett. 1990;65:3152–3155. doi: 10.1103/PhysRevLett.65.3152. [DOI] [PubMed] [Google Scholar]
- Ho K., Chan C., Soukoulis C., Biswas R., Sigalas M. Photonic band gaps in three dimensions: new layer by layer periodic structures. Solid State Commun. 1994;89:413–416. doi: 10.1016/0038-1098(94)90202-X. [DOI] [Google Scholar]
- Hyde S., Andersson S., Larsson K., Blum Z., Landh T., Lidin S., Ninham B.W. Elsevier; Amsterdam, The Netherlands: 1997. The language of shape. The role of curvature in condensed matter: physics, chemistry, and biology. [Google Scholar]
- Ingram A.L., Parker A.R. A review of the diversity and evolution of photonic structures in butterflies, incorporating the work of John Huxley (The Natural History Museum, London from 1961 to 1990) Phil. Trans. R. Soc. B. 2008;363:2465–2480. doi: 10.1098/rstb.2007.2258. [DOI] [PMC free article] [PubMed] [Google Scholar]
- Johnson, S. G. & Joannopoulos, J. D. 2002 Photonic crystals: the road from theory to practice. Dordrecht, The Netherlands: Kluwer Academic Publishers.
- Kertész K., Bálint Z., Vertesy Z., Márk G.I., Lousse V., Vigneron J.-P., Rassart M., Biró L.P. Gleaming and dull surface structures from photonic-crystal-type nanostructures in the butterfly Cyanophrys remus. Phys. Rev. E. 2006;74:021 922. doi: 10.1103/PhysRevE.74.021922. [DOI] [PubMed] [Google Scholar]
- Kittel C. Wiley; New York, NY: 1996. Introduction to solid state physics. [Google Scholar]
- Michielsen K., Kole J.S. Photonic band gaps in materials with triply periodic surfaces and related tubular structures. Phys. Rev. B. 2003;68:115 107. doi: 10.1103/PhysRevB.68.115107. [DOI] [Google Scholar]
- Michielsen K., Stavenga D.G. Gyroid cuticular structures in butterfly wing scales: biological photonic crystals. J. R. Soc. Interface. 2008;5:85–94. doi: 10.1098/rsif.2007.1065. [DOI] [PMC free article] [PubMed] [Google Scholar]
- Morris R.B. Iridescence from diffraction structures in the wing scales of Callophrys rubi, the green hairstreak. J. Entomol. A. 1975;49:149–154. [Google Scholar]
- Palik E.D. Academic Press; Boston, MA: 1991. Handbook of optical constants of solids II. [Google Scholar]
- Prum R.O., Quinn T., Torres R.H. Anatomically diverse butterfly scales all produce structural colours by coherent scattering. J. Exp. Biol. 2006;209:748–765. doi: 10.1242/jeb.02051. [DOI] [PubMed] [Google Scholar]
- Vukusic P., Sambles J.R. Shedding light on butterfly wings. Proc. SPIE. 2001;4438:85–95. doi: 10.1117/12.451481. [DOI] [Google Scholar]
- Vukusic P., Sambles J.R. Photonic structures in biology. Nature. 2003;424:852–855. doi: 10.1038/nature01941. [DOI] [PubMed] [Google Scholar]
- Wickham, S. 2006 Three-dimensional butterfly photonic crystals: a structural and optical investigation. MSc thesis, The University of Sydney.
- Wijnhoven J.E.G.J., Vos W.L. Preparation of photonic crystals made of air. Spheres in titania. Science. 1998;281:802–804. doi: 10.1126/science.281.5378.802. [DOI] [PubMed] [Google Scholar]
- Yablonovitch E., Gmitter T.J., Leung K.M. Photonic band structure: the face-centered-cubic case employing nonspherical atoms. Phys. Rev. Lett. 1991;67:2295–2298. doi: 10.1103/PhysRevLett.67.2295. [DOI] [PubMed] [Google Scholar]
Associated Data
This section collects any data citations, data availability statements, or supplementary materials included in this article.
Supplementary Materials
MPB control file—defines structure
MPB control file—defines lattice vectors
MPB control file—run file


