Abstract
In this work, we demonstrate DNA separation and genotyping analysis in gel-free solutions using a nanocapillary under pressure-driven conditions without application of an external electric field. The nanocapillary is a ~50-cm-long and 500-nm-radius bare fused silica capillary. After a DNA sample is injected, the analytes are eluted out in a chromatographic separation format. The elution order of DNA molecules follows strictly with their sizes, with the longer DNA being eluted out faster than the shorter ones. High resolutions are obtained for both short (a few bases) and long (tens of thousands of base pairs) DNA fragments. Effects of key experimental parameters, such as eluent composition and elution pressure, on separation efficiency and resolution are investigated. We also apply this technique for DNA separations of real-world genotyping samples to demonstrate its feasibility in biological applications. PCR products (without any purification) amplified from Arabidopsis plant genomic DNA crude preparations are directly injected into the nanocapillary, and PCR-amplified DNA fragments are well resolved, allowing for unambiguous identification of samples from heterozygous and homozygous individuals. Since the capillaries used to conduct the separations are uncoated, column lifetime is virtually unlimited. The only material that is consumed in these assays is the eluent, and hence the operation cost is low.
New, more cost-effective DNA separation methods are being sought to meet the need for simple and inexpensive assays for research and diagnostic purposes. Traditionally, DNA separations have been performed using slab-gel electrophoresis. A shift to capillary gel electrophoresis (CGE)1 or capillary array electrophoresis (CAE)2–4 has resulted in improved resolution and increased throughput. Both CGE and CAE use viscous polymer solutions (e.g., entangled solutions of linear polyacrylamide) as sieving matrices for size-based DNA separations. In addition to their cost, high pressures (e.g. 1000 psi) are often needed5 to load and replenish these matrices after each run. Frequently, a coating is required on the inner wall of the capillary in order to obtain high quality separation results.
To overcome the problems associated with the viscous polymer matrices, one would wish to separate DNA in gel-free (or free) solutions.6–12 Unfortunately, DNA separations cannot normally be achieved by electrophoresis in gel-free solutions,13 because the electrophoretic mobilities of all DNA molecules are virtually identical. Although a long DNA molecule possesses greater negative charge than a shorter molecule does, providing stronger pull, its large size induces more friction that limits its migration. These two forces largely balance one another, resulting in a mobility that is independent of the DNA size. Credit should be given to Noolandi6 who suggested in 1992 that DNA could be electrophoretically separated in a gel-free solution if the molecules were attached to a monodisperse perturbing entity or a “drag-tag”. Because the drag-tag breaks the balance between the “pull” and the “drag”, the mobility of a DNA molecule becomes size-dependent. This approach, called end-labeled free-solution electrophoresis (ELFSE), has provided promising results.7–12 However, attaching drag-tags to DNA molecules adds cost to the assays.
Taking advantage of the radial migration of DNA molecules inside a capillary, Yeung’s group14–16 demonstrated both analytical and preparative separations of large DNA molecules in gel-free solutions. The radial migration of DNA was first reported by Zheng and Yeung in 2002.14 Briefly, in the presence of a parabolic flow, deformable DNA molecules are oriented with respect to the direction of the bulk flow. When an electric field is applied to induce an electrophoretic motion in the same direction as the bulk flow, the drag force in the opposite direction creates a lift force on the DNA molecules and focuses them toward the center of the capillary. Similarly, when the electrophoretic motion is in the direction opposite to the bulk flow, the DNA molecules are defocused and move toward the capillary walls.16 Because these motions are size-dependent, they can be and have been used for DNA separations, which is similar to the field-flow fractionation.17,18
Han et al.19–23 recently utilized an entropic trapping effect to separate long DNA molecules in gel-free solutions. On a microchip device, a fluidic channel was produced by joining a deep (µm-scale) channel and a shallow (nm-scale) channel repeatedly. As DNA molecules migrated inside such a channel with alternate depths under an electric field, smaller molecules tended to reside in the deeper regions (entropic traps) longer, and hence had longer retention times than larger molecules. DNA molecules were therefore separated according to their lengths. High-resolution separations of DNA in the range of 1–200 kbp were accomplished using a channel with a total length of 1.5 cm. Because the separations do not require a polymer sieving matrix, and utilize only short separation channels, this approach can be conveniently implemented on microfluidic devices.
Peterson et al.24 showed that DNA (100–1000 bp) could also be electrophoretically separated in a gel-free solution as long as the channel was sufficiently small (e.g. tens of nanometers), and postulated that steric effects determined the residence time of a DNA molecule. This work was extended recently by Santiago and co-workers25,26 for separations of an oligonucleotide mixture of 10–100 bp in channels with depths ranging from 40 to 1560 nm. It was suggested that DNA separation was a result of a combination of physics due to the polyelectrolyte nature of DNA molecules with electrical double layer (EDL) physics, as well as steric and hydrodynamic effects due to confinement.
In the above examples when a nanocapillary or nanochannel was used,19–26 an external electric field was applied to execute the separations. In this paper, we report the use of a bare nanocapillary to separate DNA in gel-free solutions under pressure-driven conditions without application of any external electric field. These condition changes enabled us to separate both short oligonucleotides and long DNA molecules with high resolutions in the same run. To demonstrate the use of this method in biological applications, we performed genotyping of two different Arabidopsis ecotypes showing simple sequence length polymporphism (SSLP) at DNA level. PCR products are directly injected into a nanocapillary without any purification, and the PCR-amplified fragments are baseline separated to allow for unambiguous genotype identifications.
Experimental Section
Materials and Reagents
Single-standed DNA (ssDNA) were fluorescent dye (FAM) labeled deoxythymidine (dT) oligonucleotides (dT5, dT10, dT15 and dT20, in which the subscripts denote the numbers of bases in the oligonucleotides) purchased from Integrated DNA Technologies (Coralville, IA). A 100 base-pair (bp) ladder was from Amersharm Biosciences (Piscataway, NJ), and a 1-kilobase pair (kbp) DNA ladder was obtained from New England Biolabs (Ipswich, MA). Tris(hydroxymethyl)aminomethane (Tris), ethylenediaminetetraacetic acid (EDTA) and sodium hydroxide were purchased from Fisher Scientific (Fisher, PA). TOTO-1 was obtained from Molecular Probes (Eugene, OR). Fused-silica capillaries (500-nmradius) were specially produced by Polymicro Technologies (Phoenix, AZ). In this experiment, the 500 mM TE buffer was composed of 500 mM Tris-HCl and 1.0 mM EDTA at pH 8.0. The 100 mM and the 10 mM TE buffers contained 100 mM and 10 mM Tris while the pH and EDTA concentration were the same as those in the 500 mM TE buffer. The 100 µM and 50 µM TE buffers were diluted directly from the 10 mM TE buffer with water. All solutions were prepared using ultrapure water (Nanopure ultrapure water system, Barnstead, Dubuque, IA) and filtered through a 0.22 µm filter (VWR, TX), vacuum-degassed before use.
Apparatus
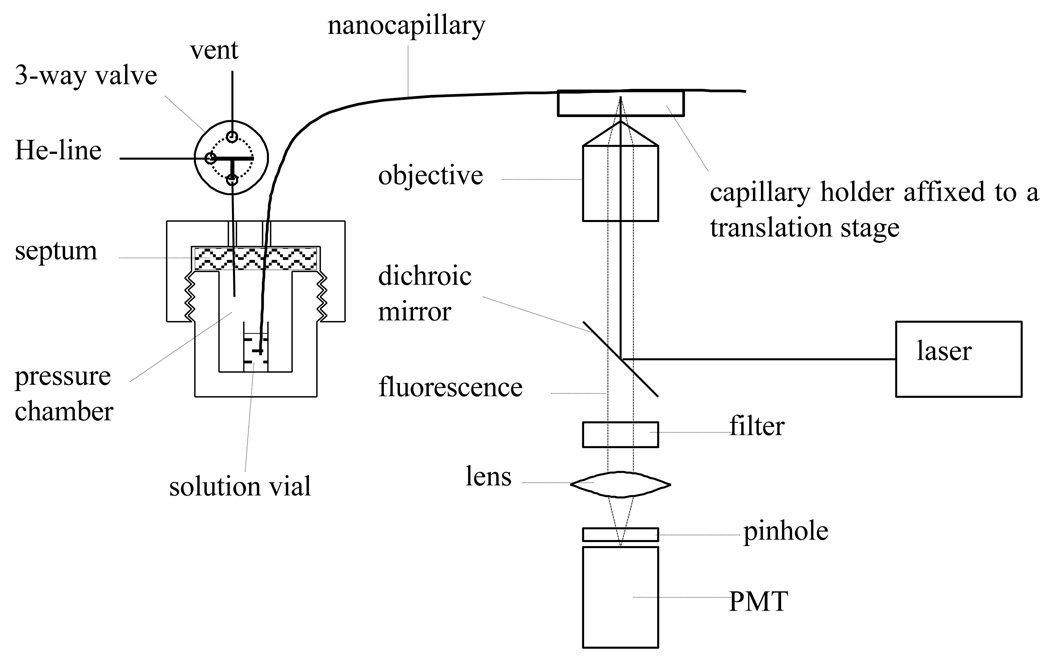
A representation of the experimental setup is schematically shown in Figure 1. The sampling end of the nanocapillary was inserted through a septum into a solution vial inside a pressure chamber. A pressure-regulated helium gas was introduced to the pressure chamber to drive the solution in the vial into the nanocapillary. At an appropriate location on the nanocapillary the polyimide coating was removed, forming a detection window. The detection end of the nanocapillary was affixed to a capillary holder which was attached to an x-y-z translation stage to align the detection window with the optical system to maximize the fluorescence output. The fluorescence measurement was carried out on a confocal laser-induced fluorescence (LIF) detector. The detector was a duplicate of the system as we described previously.27 Briefly, a 488 nm beam from an argon ion laser (LaserPhysics, Salt Lake City, UT) was reflected by a dichroic mirror (Q505LP, Chroma Technology, Rockingham, VT) and focused onto the nanocapillary through an objective lens (20x and 0.5 NA, Rolyn Optics, Covina, CA). Fluorescence from the nanocapillary was collimated by the same objective lens, and collected by a photosensor module (H5784-04, Hamamatsu, Japan) after passing through the dichroic mirror, an interference band-pass filter (532 nm, Carlsbad, CA), a focal lens and a 1-mm pinhole. The magnification of the photosensor was modulated by an external DC power supply (Model C7169, Hamamatsu, Japan) to 0.9 V, which was equivalent to ~900 on the photomultiplier tube of the photosensor. The output of the photosensor module was measured using a NI multifunctional card DAQCard-6062E (National Instruments, Austin, TX). The data was acquired and analyzed with program written in-laboratory with Labview (National Instruments).
Figure 1.
Schematic diagram of the experimental setup
Preparation of Standard DNA Samples
The single-stranded DNA (ssDNA) samples were prepared by mixing the oligonucleotides and diluting the mixture to desired concentrations with 1× TE buffer (10.0 mM Tris-HCl, pH 8.0, 1.0 mM EDTA). The double-stranded DNA (dsDNA) samples were obtained by mixing the DNA with TOTO-1 (a fluorescent intercalating dye) at a dye-to-base pair ratio of ~1:10 in 1× TE buffer. The final total DNA concentrations were 50 ng/µL for the 1-kbp ladder and 60 ng/µL for the 100-bp ladder. The dsDNA samples were freshly prepared right before use.
Extraction of Crude genomic DNA
Crude genomic DNA from Arabidopsis plants [ecotypes Columbia (Col-0) and Landsberg erecta (Ler-0)] was extracted according to the protocol described by Edwards et al.28 with modifications. Briefly, two to three small young leaves (2–3 mg) from three-week old Arabidopsis plants were crushed and homogenized using microfuge pellet pestle in 1.5 mL microfuge tube on ice. 800 µL of extraction buffer [200 mM Tris-HCl (pH 7.5), 250 mM NaCl, 25 mM EDTA, and 0.5% SDS] was added to the sample and mixed by vortexing. The sample was then centrifuged at 13 krpm for 5 minutes. 600 µL of the supernatant was mixed with equal volume of isopropanol by vortexing. The sample was incubated at −20 °C for 10 minutes, and centrifuged in a microfuge at 13 krpm for 10 minutes. Crude genomic DNA-containing pellets were washed with 70% ethanol and air dried for 10 minutes. The dried pellets were rehydrated in 100 µL sterile water overnight before used in PCR reactions.
PCR Amplification and Agarose Gel Separation
Arabidopsis SSLP markers used in this experiment were designed based on CEREON database.29 The primers used for PCR amplifications were CER461313-F-5'-CAGGACTAACAATATGTTAGATTTC-3' and CER461313-R-5'-CATATTGATTAATGGGTTCCA-3' for SSLP# 38 - (195 bp, 45/−45), and CER458055-F-5'-GCCCTTGCGGGTTGCTTAT-3' and CER458055-R-5'-ATCGCAAGTAAGAGACGATATAATGA-3' for SSLP# 47- (198 bp, 24/−24). These primers were not fluorescently labeled. PCR reactions were performed as follows. Three microliters of crude DNA was added to 20 µL of PCR mixture containing 1× Ex Taq Buffer (from Takara Bio Inc., Madison, WI), 2 mM Mg2+, 1 µM primers, 0.25 mM dNTPs, and 0.5 U Takara Ex Taq DNA Polymerase. The SSLP marker was amplified using the following thermal cycling conditions: 3 minutes at 94 °C, followed by 40 cycles of 15 seconds at 94 °C, 20 seconds at 56 °C, 30 seconds at 72 °C, and 10 minutes at 72 °C.
A 20 µL PCR product was separated on 3% Metaphor agarose gel containing 0.50µg/mL ethidium bromide using 1×TAE buffer at 130 V until two polymorphic bands were visible in heterozygote sample by using horizontal gel apparatus. Kodak gel document system was used to visualize the DNA fragments.
DNA Separations Using Nanocapillaries
Before a separation was performed, the detection window on the nanocapillary was aligned with the optical system. Refer to Figure 1, by applying a fixed pressure in the pressure chamber a fluorescein solution (10.0 µM) was flushed through the capillary at a constant flow rate (to avoid fluorescence intensity decay caused by photo-bleaching). The position of the detection window was adjusted via the x-y-z translation stage, and the fluorescence signal was monitored. Once the maximum signal was reached, the x, y and z positions of the translation stage were locked.
To prepare for sample injection (especially after capillary alignment), the capillary was thoroughly cleaned with an eluent solution until the fluorescence signal reached the background level. After a DNA sample vial was placed in the pressure chamber (made of transparent acrylic), the pressure chamber was capped and sealed with a septum. With the three-way valve set at vent, the sampling end of the nanocapillary was inserted into the sample solution. The three-way valve was switched to the position as shown in Figure 1 so that a pressure-regulated helium gas was introduced into the pressure chamber, and the sample was pressurized into the nanocapillary. Sample injection was stopped as the 3-way valve was switched to vent. A timer was used to control the volume of sample being injected. After the sample injection, the sample vial was replaced with an eluent vial, the sampling end of the nanocapillary was transferred to the eluent, and a desired pressure was applied to the pressure chamber to carry out the separation.
Results and discussion
When we just started working on nanocapillary chromatography (NC),30 we anticipated it to resolve some low charged anions (i.e. anions with less than 10 unit charges), but not highly charged anions. Therefore, we selected some fluorescently-labeled short single-stranded oligonucleotides. We did not use short double stranded DNA because they could de-hybridize at elevated temperatures. It was a surprise to us that NC resolved large DNAs so well that we shifted our effort from studies of the fundamentals of NC to the development of a separation technique as an alternative to pulsed-field gel electrophoresis. Therefore, a majority of the discussion was focused on large DNA separations.
Effect of Buffer Concentration in the Eluent on Resolution
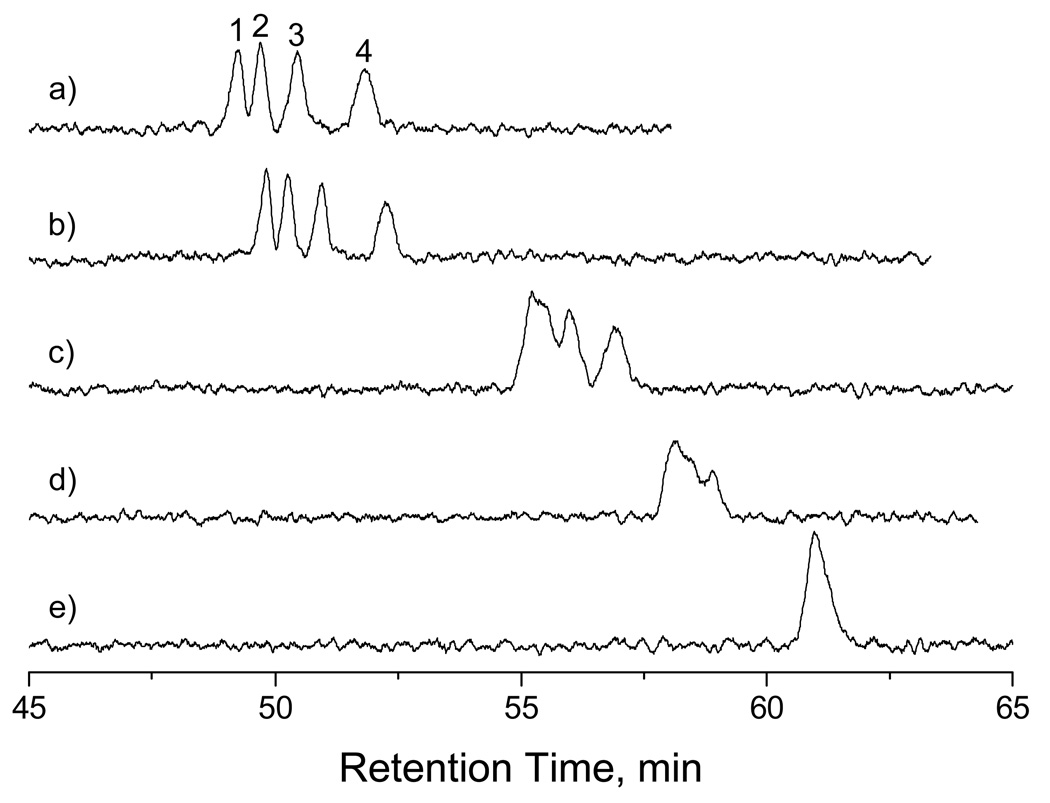
Figure 2 presents the separation results of dT5, dT10, dT15 and dT20 in gel-free solutions using a 46-cm-long (42-cm effective) and 500-nm-radius capillary. The sample was hydrodynamically injected under a pressure of 90 psi for 10 s, and the separation was executed under the same pressure for elution. When the eluent contained 50.0 µM TE buffer, four oligonucleotides were almost baseline-separated, with the smaller fragments being retained longer than the larger ones. Each peak was identified by spiking a known oligonucleotide into the sample mixture followed by a separation.
Figure 2. Separation results of short oligonucleotides.
The separation capillary had a radius of 500 nm, a total length of 46 cm (42 cm effective). The sample contained a mixture of four single-stranded oligonucleotides, each at a concentration of 0.1 µM. The sample was injected at 90 psi for 10 s. The separations were carried out by pressurizing an eluent through the capillary at a chamber pressure of 90 psi. The separation traces were obtained using eluents containing (a) 50 µM TE buffer, (b) 100 µM TE buffer, (c) 500 µM TE buffer, (d) 2 mM TE buffer, and (e) 10 mM TE buffer. All buffers had a pH of 8.0. Peak identifications: (1) poly t20; (2) poly t15; (3) poly t10; (4) poly t5.
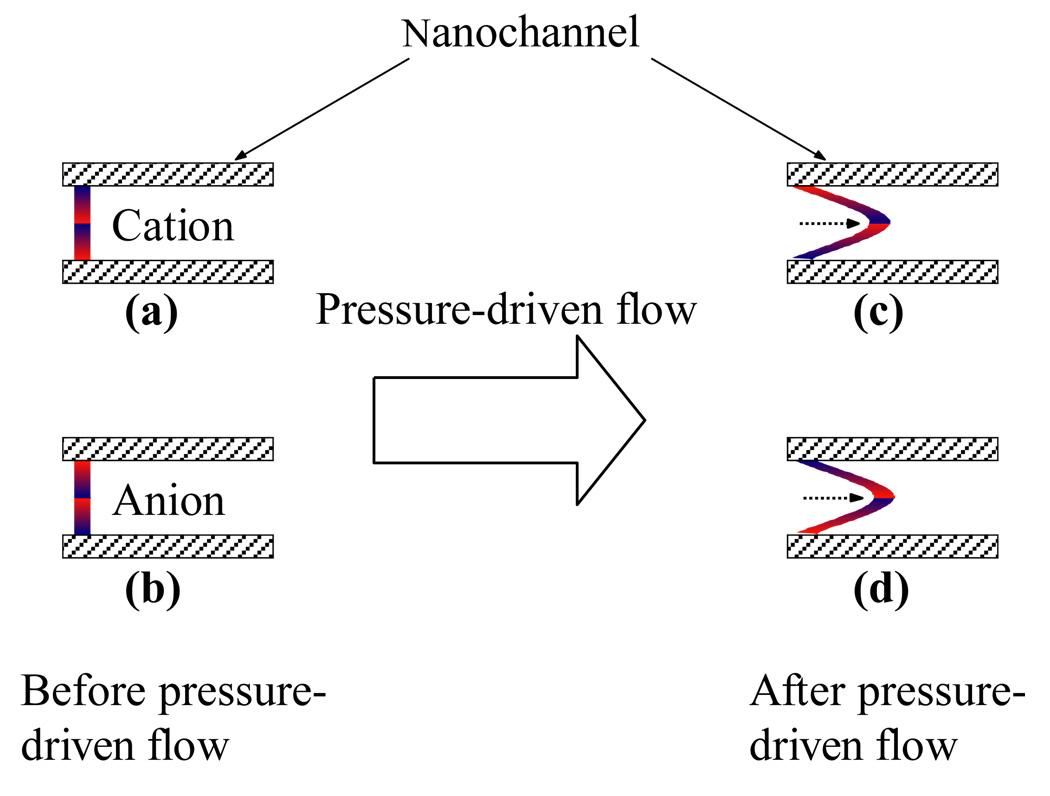
The elution order can be interpreted using a nanocapillary chromatography (NC) model.30 Briefly, in a nanocapillary with a negatively charged surface, cations are enriched near the wall (see Figure 3a), while anions are concentrated towards the center of the capillary (see Figure 3b) due to the electrostatic attractive/repulsive forces between the ions and the charged surface. When a pressure-driven flow is induced, the solution at the center of the nanocapillary will flow faster than the solution close to the wall, causing the anions to move faster than cations (compare Figures 3c and 3d). A separation is thus produced, and this separation technique is referred to as NC. For anions, the more charged ions will move faster than the less charged ions because the former is more concentrated toward the center of the nanocapillary. This explains why the larger DNA fragments that carried more negative charges were eluted out earlier than the smaller ones.
Figure 3.
A schematic illustration of NC separation
From the data shown in Figure 2, we see that the resolution declined with the increase of the TE buffer concentration. At 10.0 mM (see trace e), all oligonucleotides were eluted out unresolved. This effect can also be explained using the NC model. In a large capillary (e.g. 50-µm-radius capillary) where the EDL overlap is negligible, all fragments will be eluted out at the same time because they are evenly distributed across the capillary. To create the type of distributions as shown in Figures 3a and 3b and hence the separations as predicted in Figures 3c and 3d, EDL needs to occupy a significant portion of the nanocapillary. When the TE concentration in the eluent is changed from 50 µM to 10 mM, the EDL thickness decreased from ~45 nm to ~3 nm.31 The diminished EDL overlap results in the flatter distributions of the oligonucleotide across the capillary, and consequently the poorer resolutions.
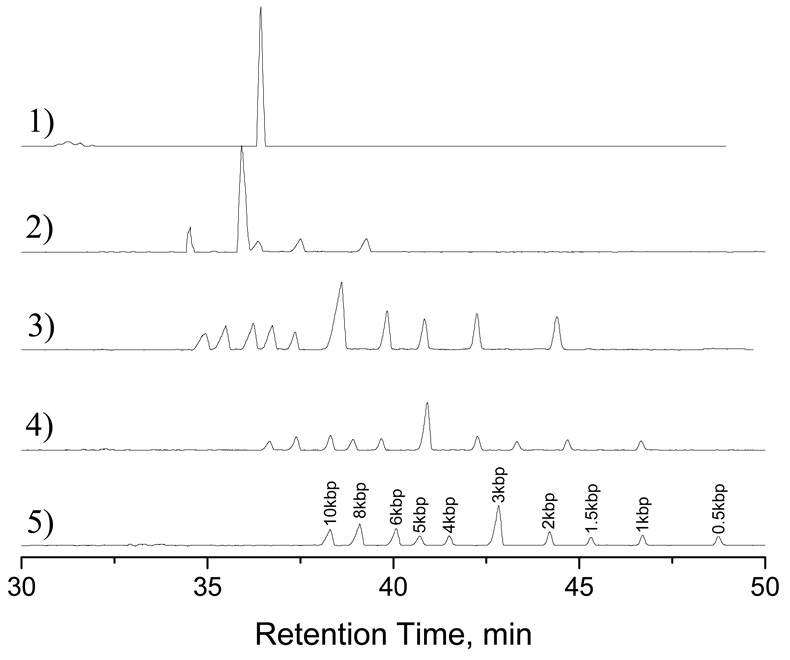
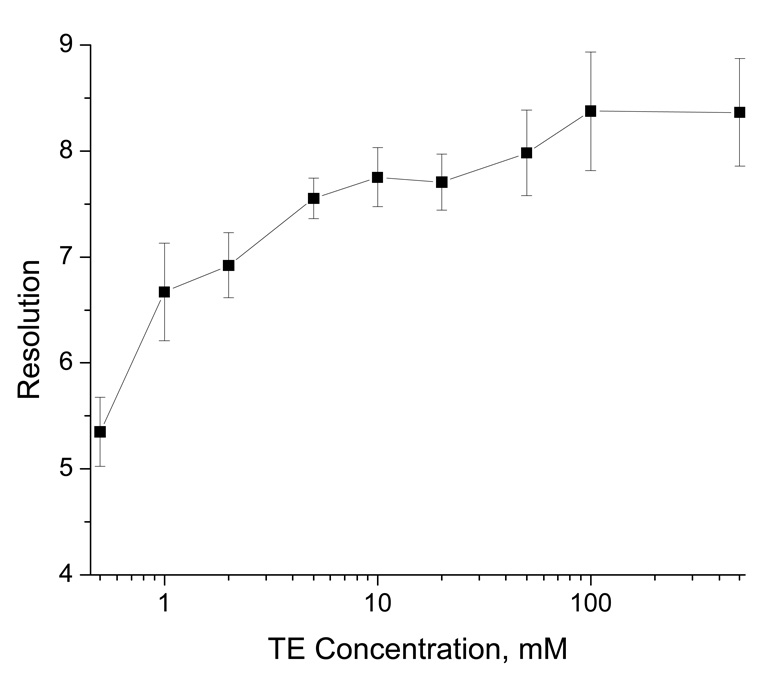
Figure 4 presents the separation results of a 1-kbp DNA ladder in gel-free solutions. The ladder contained ten double-stranded DNA fragments with various lengths (0.5, 1, 1.5, 2, 3, 4, 5, 6, 8, and 10 kbp). The elution order was the same as indicated for Figure 2, the shorter fragments retained longer inside the nanocapillary. However, the effect of TE concentration was reversed. That is, the resolution improved with the increase of TE concentration. To confirm this effect, we carried out these separations under a wide range of TE concentrations (from 0.50 mM to 500 mM), and performed these tests repetitively (5 times). As shown in Figure 5, the resolution clearly improved with TE concentration. We do not have a good explanation for these results at this time, but associations of more counterions (e.g. Na+) with DNA molecules at higher buffer concentrations could have played a role for the improved separations. Other separation mechanisms such as radial migration14–16 and hydrodynamic separation32 may have also contributed to the differential transport of these DNA fragments.
Figure 4. Separation results of a 1-kbp DNA ladder.
The sample contained 10 DNA fragments, and total DNA concentration was 50 ng/µL. The sample was injected at 100 psi for 10 s, and the separations were carried out at a chamber pressure of 100 psi. The separation traces were respectively obtained using an eluent containing (1) 50 µM TE buffer, (2) 100 µM TE buffer, (3) 10 mM TE buffer, (4) 100 mM TE buffer, and (5) 500 mM TE buffer. All other conditions were the same as indicated in Figure 2. (Note: The signals of traces 1 and 2 were multiplied by a factor of 0.25, and the signals of traces 3 and 4 were multiplied by a factor of 0.4 so that all five chromatograms could be arranged roughly evenly-spaced.)
Figure 5. Effect of TE concentration in eluent on resolution.
The resolution (R) values were calculated using R=2(tb−ta)/(wa+wb), where ta and tb are the retention times, and wa and wb are the peakwidths of 0.5 kbp and 1 kbp. All other conditions were the same as described in the legend for Figure 4.
Effect of Capillary Radius on Resolution
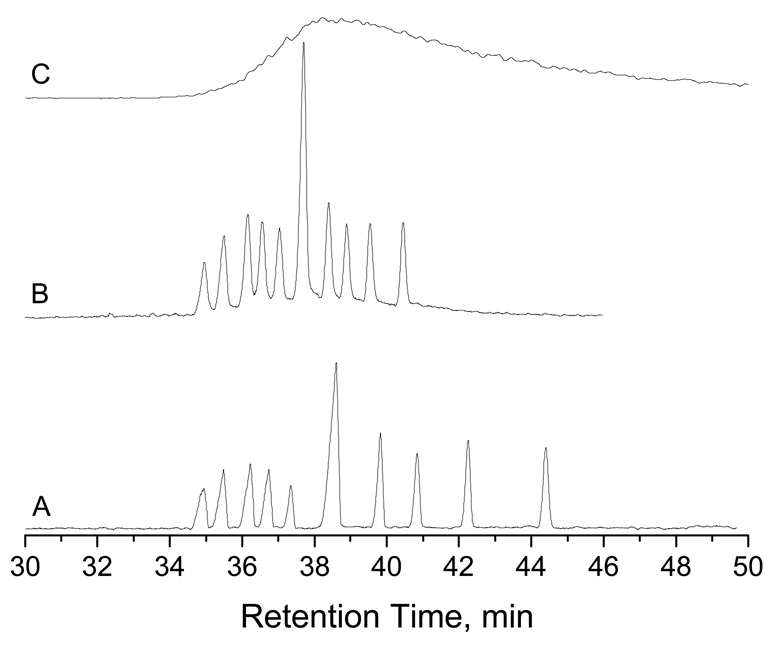
Capillary diameter is an important parameter for these separations. Figure 6 presents the separation results using capillaries of different radii. The test capillaries had the same length. At the same elution pressure, the DNAs were eluted out fast with poor resolution in larger capillaries. To compensate the retention times, we could either increase the capillary lengths or decrease the elution pressures. The separation traces shown in Figure 6 were obtained with decreased elution pressures (similar results were obtained with increased capillary lengths). In a 500-nm-radius capillary all DNA molecules were baseline-resolved (Figure 6A). In an 800-nm-radius capillary the DNAs were well- but not baseline-resolved. The resolution of the 0.5 kbp and the 1 kbp DNAs was decreased from 7.9 to 3.5 as the capillary radius changed from 500 nm to 800 nm. In a 3-µm-radius capillary the DNAs were eluted out as a single peak. 500-nm-radius capillaries were thus utilized in the rest of the tests.
Figure 6. Effect of capillary radius on resolution.
All separation capillaries had the same length (46 cm total and 42 cm effective) but different radii, (A) 500 nm, (B) 800 nm and (C) 3000 nm, respectively. Sample injection conditions: (A) 10 s at 100 psi, (B) 5 s at 55 psi and (C) 4 s at 30 psi. The separation pressures were 100 psi, 55 psi and 30 psi respectively. Eluent was 10 mM TE (pH = 8.0).
Effect of Elution Pressure on Resolution
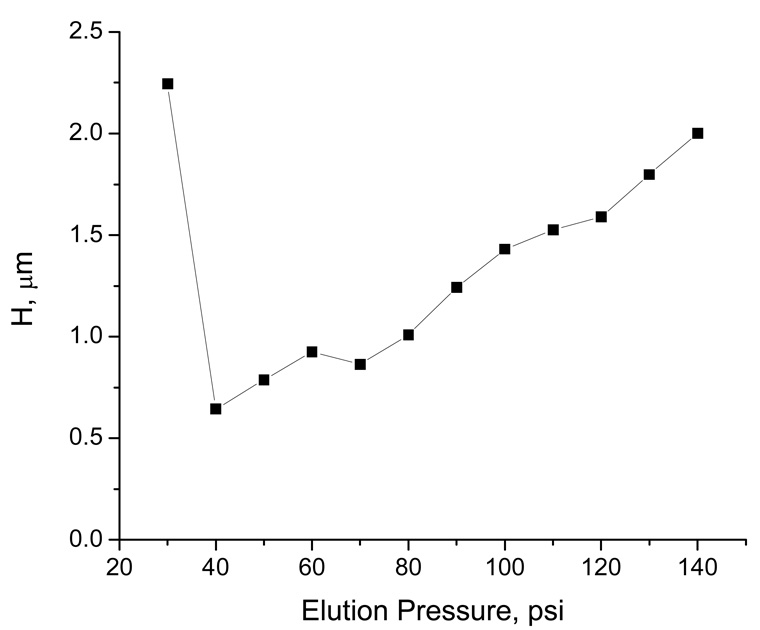
From the separation data shown in Figure 2 and Figure 4, the retention times are generally from tens of minutes to about an hour. Intuitively, one could increase the elution pressure (or eluent flow rate) to shorten the separation time. Just as in traditional chromatography, the plate height changed with the elution pressure, following a typical Van Deemter relationship (see Figure 7). It appeared that the longitudinal diffusion dominated the band broadening at low pressures (e.g. at 30 psi), and other dispersion factors governed the band broadening at high pressures (e.g. at 140 psi). We suspect that the separation mechanism might have changed as the elution pressure increased from 30 psi to 140 psi (e.g. the molecular shape of DNA molecules could have been stretched under the hydrodynamic stress at higher elution pressures). Detailed investigation is needed to confirm this suspension.
Figure 7. Effect of chamber pressure on plate height.
The eluent contained 10 mM TE. All other conditions were the same as described in the legend for Figure 4.
Based on the results presented in Figure 7, the lowest plate height was obtained at around 40 psi – the optimum pressure to achieve the highest separation efficiency. However, this optimum pressure will be a function of other experimental parameters, such as the composition of the eluent and the dimension of the nanocapillary. Owing to the long retention times (close to 2 hours) under 40 psi, we did not choose this condition for this experiment. Instead, we selected a pressure between 80 to 100 psi to conduct our separations because most separations could be completed within an hour under these pressures.
Comparison of Electrophoretic Separation with Chromatographic Separation
In the previous reports19–26 when DNA molecules were separated in nanocapillaries or nanocahnnels, an external electric field was always applied. These separations were basically nanometer-scale capillary electrophoresis (CE). In this experiment, we eliminated the external electric field and applied an external pressure to execute the separations. These separations were similar to a traditional chromatographic separation (e.g. open tubular chromatography). Taking this chromatographic approach, we improved the DNA resolutions considerably (see Figure 8). The different electric and hydrodynamic forces and the varied flow profiles under the two separation conditions could have contributed to the resolution changes.
Figure 8. Comparison of electrophoretic separation with chromatographic separation.
(A) Chromatographic separation of the 1 kbp DNA ladder under a pressure of 170 psi; (B) Electrophoretic separation of the 1 kbp DNA ladder under an electric field of 90 V/cm. The nanocapillary had a total length of 46 cm (42 cm effective), and a radius of 500 nm. 10 mM TE (pH 8.0) was used as the background electrolyte for (A) and the eluent for (B). The sample contained 50 ng/µL total DNA. A pressure injection scheme (at 100 psi for 10 s) was employed in both cases.
Another phenomenon we noticed was that the CE-format separations were irreproducible. The resolutions were better in some runs than in others. Nevertheless, the resolutions of the CE-format separations were never as high as those of the chromatographic-format separations, although the CE-format separations were faster.
Separation of 100 bp DNA Ladder
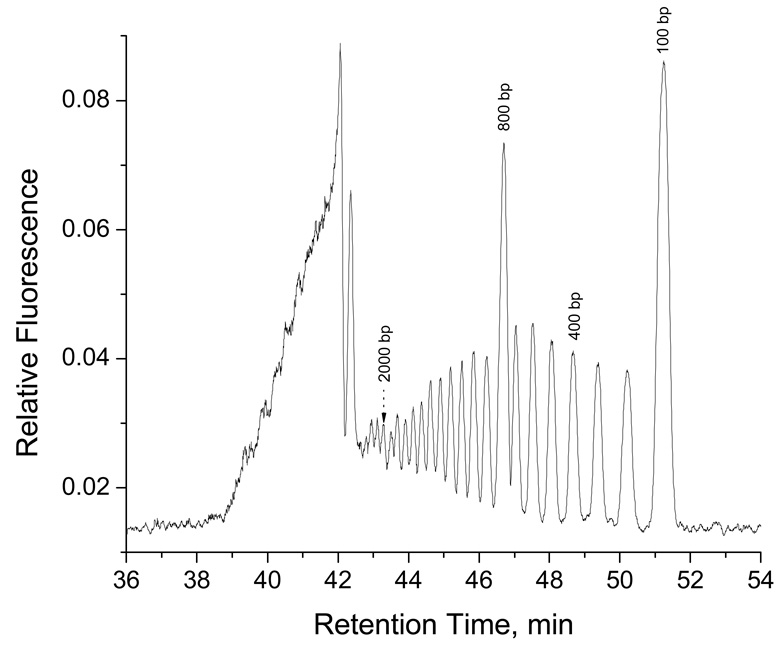
We separated short oligonuleotides (5 – 20 bases) in Figure 2, and large DNA molecules (0.5 – 10 kbp) in Figure 4 (also 75 bp – 20 kbp in Figure 10). There was a size gap between the two DNA samples. To fill this gap, we separated a 100-bp DNA ladder (100 bp – 2.4 kbp), and the results are exhibited in Figure 9. As can be seen, DNA fragments from 100 bp to 2.4 kbp were well-resolved. The resolutions are comparable to those achieved with CGE using wellcoated capillaries.27 With the data presented in Figure 2, Figure 4, Figure 9 and Figure 10, we can conclude that a bare nanocapillary is capable of separating DNA of a wide size range, from a few bases (see Figure 2) to tens of thousands of base-pairs (see Figure 4, Figure 9 and Figure 10).
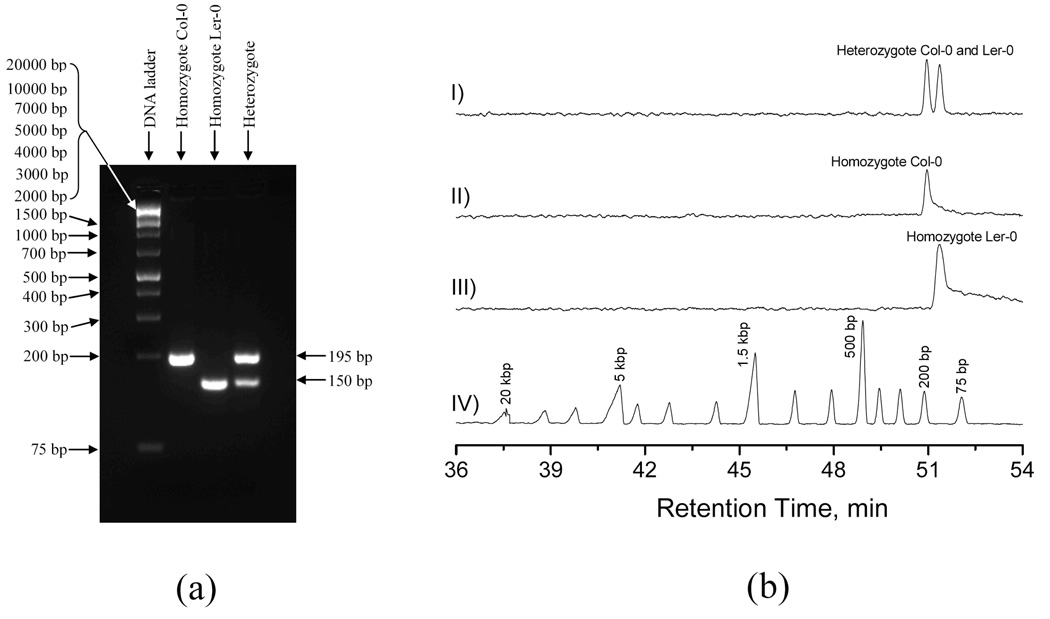
Figure 10. Separation results of Arabidopsis SSLP# 38 PCR products.
(a) Slab-gel separation results, and (b) NC separation results. For NC separations: The eluent contained 10 mM TE. The sample was injected at 100 psi for 5 s, and separation was performed at a chamber pressure of 90 psi. Trace I shows the results from a Heterozygote sample, trace II presents the results from Homozygote of Col-0, trace III exhibits the results from Homozygote of Ler-0, and trace IV displays the results from GeneRuler™ 1 kb DNA Ladder Plus. All other conditions were the same as described in the legend for Figure 4.
Figure 9. Separation results of a 100-bp DNA ladder.
The eluent contained 10 mM TE. The sample contained 60 ng total DNA per µL. The sample was injected at 100 psi for 10 s, and the separation was carried out at 90 psi. All other conditions were the same as described for Figure 4.
Genotyping Analysis
To demonstrate the practical applicability of this technique, we separated some real-world genotyping samples. Figure 10 and Figure 11 present typical results of two genotyping analyses. SSLP Samples (#38) from homozygous Col-0 and Ler-0 plants produced a 195 bp fragment and a 150 bp fragment respectively, while samples from heterozygous plants contained both fragments. Figure 10a shows agarose gel separation of PCR products, and Figure 10b shows the separation results obtained from a nanocapillary. Results from both the agarose gel and the nanocapillary were comparable for analysis of the genotyping fragments which demonstrated the feasibility of this method for genotyping analysis. Furthermore, comparison of the DNA ladder separations showed that the nanocapillary provided much improved resolutions for the large fragments (2 kbp to 20 kbp) compared to agarose gel electrophoresis.
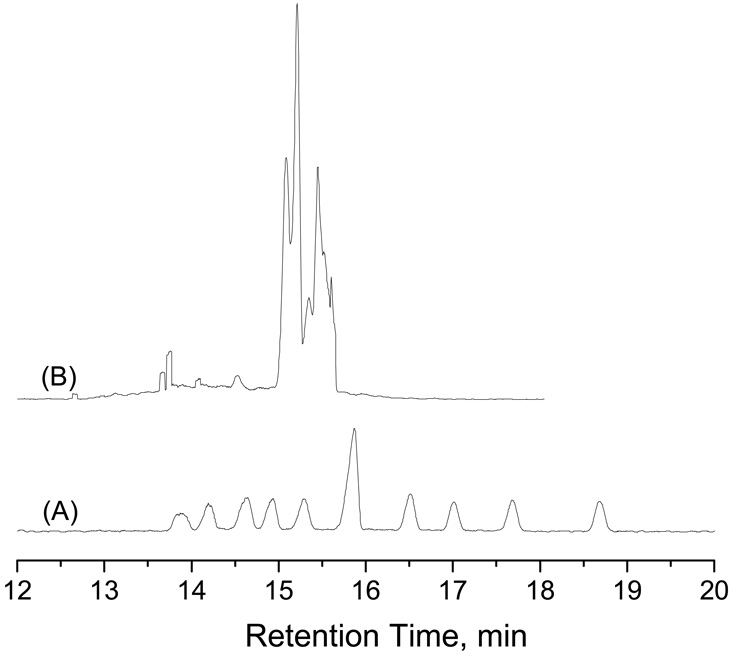
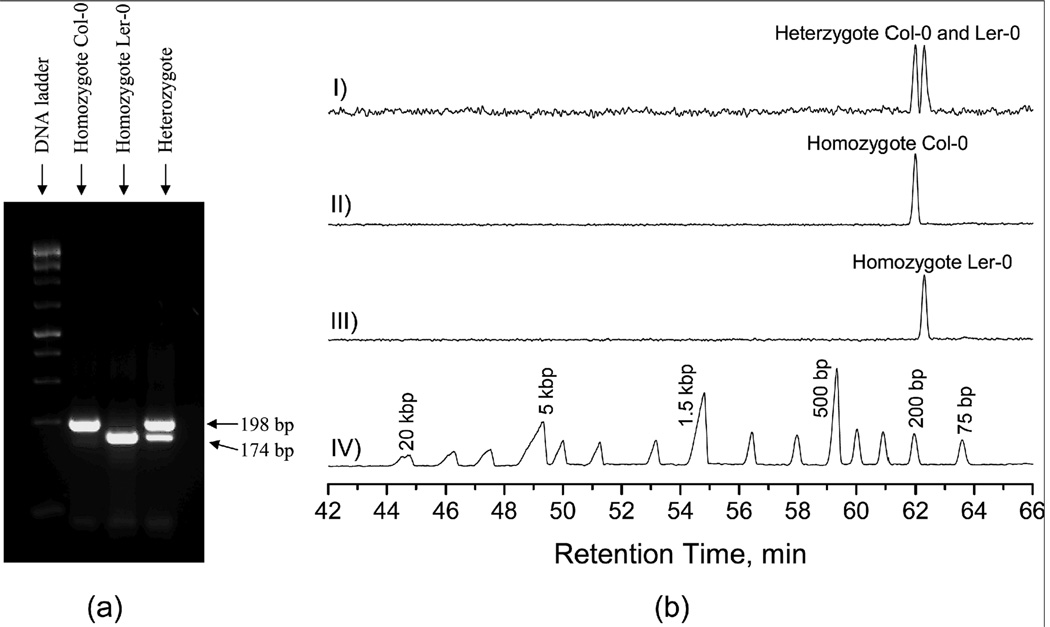
Figure 11. Separation results of Arabidopsis SSLP#47 PCR products.
(a) Slab-gel separation results, and (b) NC separation results. The nanocapillary had a length of 55 cm (51 cm effective). The sample was injected at 50 psi for 5 s, and separation was performed at a chamber pressure of 110 psi. All other conditions were the same as described in Figure 10.
In the above separations, PCR products were directly used for these separations without further purifications. Removal of the salt and other large biomolecules such as DNA templates and enzyme molecules from the PCR samples is often required in CGE, because the large biomolecules can block the “pores” of the sieving matrices and the salt can suppress the electrokinetic injection of DNA. This method permitted us using the crude PCR products, because we avoided the “pores” and employed a hydrodynamic sample injection scheme, which could be implemented only after we eliminated the polymer sieving matrices.
In the above sample, the two genotype fragments differed by 45 bp. In other cases, this difference will be smaller. To broaden the applicability of this method, we used PCR products amplified using another SSLP marker (#47) in which the two fragments differ by only 24 bp. Under the same conditions as described in Figure 10b, the two fragments could not be baseline-separated. After increasing the capillary length and the elution pressure slightly, we completely resolved them (see the top trace of Figure 11). These results also implied a direction to improve the resolving power for DNA separations by NC.
Conclusions
We have developed a nanocapillary method and demonstrated its feasibility for highresolution separations of DNA of a wide size range (from a few bases to tens of thousands of base pairs) in gel-free solutions. The method used a bare nanocapillary, and the separations were carried out under pressure-driven flow conditions. Because the separations are performed in free solutions, we eliminated all the problems associated with the viscous polymer sieving matrices. Since bare capillaries were utilized in this method, we extended the capillary lifetime considerably. This method also enables us to separate crude PCR products without removal of the salt and other larger biomolecules. All these features contribute to the low operation costs. In fact, to perform DNA separations using this method, the daily consumable is only the eluent (a TE buffer solution) at a rate of a few nLs per separation. In addition, the waste generation of this method is negligible. A combination of this method with a multi-capillary array detection system could provide a platform for inexpensive and high-throughput DNA genotyping analysis.
ACKNOWLEDGMENT
This work is partially supported by National Institute of Health (1 RO1 GM078592-01), National Science Foundation (CHE-0514706), and the Texas Advanced Research Program.
References
- 1.Ruiz-Martinez MC, Berka J, Belenkii A, Foret F, Miller AW, Karger BL. Anal. Chem. 1993;65:2851–2858. doi: 10.1021/ac00068a023. [DOI] [PubMed] [Google Scholar]
- 2.Huang XC, Quesada MA, Mathies RA. Anal. Chem. 1992;64:2149–2154. doi: 10.1021/ac00042a021. [DOI] [PubMed] [Google Scholar]
- 3.Kambara H, Takahashi S. Nature. 1993;361:565–566. doi: 10.1038/361565a0. [DOI] [PubMed] [Google Scholar]
- 4.Taylor JA, Yeung EA. Anal. Chem. 1993;65:956–960. [Google Scholar]
- 5.Buchholz BA, Doherty EAS, Albarghouthi MN, Bogdan FM, Zahn JM, Barron AE. Anal. Chem. 2001;73:157–164. doi: 10.1021/ac001023z. [DOI] [PubMed] [Google Scholar]
- 6.Noolandi J. Electrophoresis. 1992;13:394–395. doi: 10.1002/elps.1150130180. [DOI] [PubMed] [Google Scholar]
- 7.Mayer P, Slater GW, Drouin G. Anal. Chem. 1994;66:1777–1780. [Google Scholar]
- 8.Meagher RJ, Won JI, McCormick LC, Nedelcu S, Bertrand MM, Bertram JL, Drouin G, Barron AE, Slater GW. Electrophoresis. 2005;26:331–350. doi: 10.1002/elps.200410219. [DOI] [PubMed] [Google Scholar]
- 9.Voelkel AR, Noolandi J. Macromolecules. 1995;28:8182–8189. [Google Scholar]
- 10.Heller C, Slater GW, Mayer P, Dovichi N, Pinto D, Viovy JL, Drouin G. J. Chromatogr. A. 1998;806:113–121. [Google Scholar]
- 11.Kan CW, Fredlake CP, Doherty EAS, Barron AE. Electrophoresis. 2004;25:3564–3588. doi: 10.1002/elps.200406161. [DOI] [PubMed] [Google Scholar]
- 12.Haynes RD, Meagher RJ, Won J, Bogdan FM, Barron AE. Bioconjugate Chem. 2005;16:929–938. doi: 10.1021/bc0496915. [DOI] [PubMed] [Google Scholar]
- 13.Olivera BM, Baine P, Davidson N. Biopolymers. 1964;2:245–257. [Google Scholar]
- 14.Zheng J, Yeung ES. Anal. Chem. 2002;74:4536–4547. doi: 10.1021/ac0257344. [DOI] [PubMed] [Google Scholar]
- 15.Kang SH, Yeung ES. Anal. Chem. 2002;74:6334–6339. doi: 10.1021/ac0261202. [DOI] [PubMed] [Google Scholar]
- 16.Zheng J, Yeung ES. Anal. Chem. 2003;75:3675–3680. doi: 10.1021/ac034430u. [DOI] [PubMed] [Google Scholar]
- 17.Giddings JC. Sep. Sci. 1966;1:123–125. [Google Scholar]
- 18.Caldwell KD, Kesner LF, Myers MN, Giddings JC. Science. 1972;176:296–298. doi: 10.1126/science.176.4032.296. [DOI] [PubMed] [Google Scholar]
- 19.Han J, Craighead HG. Proc. SPIE. 2000;4177:11–17. [Google Scholar]
- 20.Han J, Craighead HG. Science. 2000;288:1026–1029. doi: 10.1126/science.288.5468.1026. [DOI] [PubMed] [Google Scholar]
- 21.Han J, Craighead HG. J. Vac. Sci. Technol. A. 1999;17:2142–2147. [Google Scholar]
- 22.Han J, Turner SW, Craighead HG. Phys. Rev. Lett. 1999;83:1688–1691. [Google Scholar]
- 23.Han J, Craighead HG. Anal. Chem. 2002;74:394–401. doi: 10.1021/ac0107002. [DOI] [PubMed] [Google Scholar]
- 24.Peterson NJ, Alarie JP, Jacobson SC, Ramsey JM. Proceedings of µTAS 2003, Squaw Valley, California. Volume 1. Kluwer Academic; 2003. pp. 701–703. [Google Scholar]
- 25.Pennathur S, Santiago JG. Anal. Chem. 2005;77:6782–6789. doi: 10.1021/ac0508346. [DOI] [PubMed] [Google Scholar]
- 26.Pennathur S, Baldessari F, Santiago JG, Kattah MG, Steinman JB, Utz PJ. Anal. Chem. 2007;79:8316–8322. doi: 10.1021/ac0710580. [DOI] [PubMed] [Google Scholar]
- 27.Lu JJ, Liu S. Electrophoresis. 2006;19:3764–3771. doi: 10.1002/elps.200600201. [DOI] [PubMed] [Google Scholar]
- 28.Edwards K, Johnstone C, Thompson C. Nucleic Acids Res. 1991;19:1349. doi: 10.1093/nar/19.6.1349. [DOI] [PMC free article] [PubMed] [Google Scholar]
- 29.Jander G, Norris SR, Rounsley SD, Bush DF, Levin I, Last RL. Plant Physiol. 2002;129:440–444. doi: 10.1104/pp.003533. [DOI] [PMC free article] [PubMed] [Google Scholar]
- 30.Liu S, Kang J, Wang S, Lu J. Proceedings of µTAS 2007 Conference; October 7–11; Paris, France. 2007. pp. 418–420. [Google Scholar]
- 31.Bard AJ, Faulkner LR. Electrochemical methods: fundamentals and applications. John Wiley and Sons, Inc.; 2001. pp. 546–549. [Google Scholar]
- 32.Noel RJ, Gooding KM, Regnier FE, Ball DM, Orr C, Mullins ME. J. Chromatogr. 1978;166:373–382. [Google Scholar]


