

Abstract
Many diseases and disorders are characterized by quantitative and/or qualitative changes in complex carbohydrates. Mass spectrometry methods show promise in monitoring and detecting these important biological changes. Here we report a new glycomics method, termed Glycan Reductive Isotope Labeling (GRIL), where free glycans are derivatized by reductive amination with the differentially coded stable isotope tags [12C6]-aniline and [13C6]-aniline. These dual-labeled aniline-tagged glycans can be recovered by reversed-phase chromatography and quantified based on UV-absorbance and relative ion abundances. Unlike previously reported isotopically coded reagents for glycans, GRIL does not contain deuterium, which can be chromatographically resolved. Our method shows no chromatographic resolution of differentially labeled glycans. Mixtures of differentially tagged glycans can be directly compared and quantified using mass spectrometric techniques. We demonstrate the use of GRIL to determine relative differences in glycan amount and composition. We analyze free glycans and glycans enzymatically or chemically released from a variety of standard glycoproteins, as well as human and mouse serum glycoproteins using this method. This technique allows for linear, relative quantitation of glycans over a 10-fold concentration range and can accurately quantify sub-picomole levels of released glycans, providing a needed advancement in the field of Glycomics.
Keywords: Mass spectrometry, MALDI, glycans, glycoproteins, oligosaccharides, reductive amination
Introductory Statement
Changes in glycan structures are associated with inherited and acquired human diseases, including congenital muscular dystrophy [1] and congenital disorders of glycosylation (CDGs) [2, 3], and acquired disorders, such as Tn syndrome [4] and inflammatory bowel disease [5, 6]. In addition, tumor cells exhibit changes in glycan structures [7]. Modern approaches to analyzing qualitative and quantitative changes in glycans rely largely on analytical techniques including HPLC- and mass spectrometry (MS)-based methods, which have helped to revolutionize our understanding of glycoconjugate structures [8–13].
MS-based methods have great potential for diagnosing human diseases involving changes in glycosylation. For example, MS is showing promise [14] in detecting structural differences in glycans from CDG patients, although these diseases are currently assessed by isoelectric focusing of serum glycoproteins [15]. Comparative MS methods have been developed for proteins using stable isotope-coded affinity tags (ICAT), in which peptides from two different samples are separately tagged with isotopically-different reagents [16]. While some ICAT-related techniques have been used to quantify peptide glycosylation [17] and detect differences in glycan content [13, 18], there is a need for a simple and easy to use glycan stable isotope labeling approach to rapidly assess quantitative and qualitative changes in the glycans in different samples.
Relative quantification by stable isotopic labeling has been well established in the field of proteomics for peptide analysis with techniques like ICAT, GIST, and iTRAQ [19]. However, only a few glycan stable isotopic labeling strategies have been reported [20, 21, 22]. A stable isotopic labeling methodology for relative glycan quantitation that is robust, easy to implement, and inexpensive but provides qualitative and quantitative means for comparative glycomic analyses of different samples is still needed. Other stable isotopic labeling methods for glycans have been reported utilizing permethylation of the glycans [22, 23]. One drawback of permethylation is that this process potentially removes structurally important information such as sulfation and phosphorylation, and can contain deuterium, which can be chromatographically resolved in LC-MS experiments.
A stable isotopic labeling method for glycans should involve minimal change of the glycan to preserve minor, but potentially biologically significant glycan modifications such as sulfation, acetylation, and phosphorylation. The method should also be simple, use readily available reagents, and provide high sensitivity with a large dynamic range for all varieties of glycans, along with use of 13C rather than deuterium isotopes to provide a robust mass difference without affecting chromatographic properties of derivatized glycans [19]. Here we describe a novel method in which glycan samples are labeled by reductive amination with either [12C6]aniline or [13C6]aniline and then combined together for MS analysis of the dual labeled sample. These aniline tags provide a method of quantifying glycans by absorbance and comparing them both qualitatively and quantitatively using matrix-assisted laser-desorption/ionization-time-of-flight mass spectrometry (MALDI-TOF-MS) and electrospray/ionization MS (ESI-MS). Our approach has distinct benefits over previously developed techniques that use a deuterium label [21]. First, the deuterium isotope affects the resolution of the separation by reverse-phase chromatography [20, 21, 24, 25]. Second, our carbon method is cheaper and more readily available than deuterium. Finally, deuterium encoded tags generate a 4 Da difference in mass that is potentially difficult to resolve without higher resolution, sensitive instrumentation. Our new method using a 6 Da mass difference easily resolves compounds in a single sample. The use of aniline in this unique approach, which we refer to as GRIL (Glycan Reductive Isotope Labeling), is useful with a variety of glycans and offers a general solution to the problem of comparative glycomics for the diagnosis of human diseases.
Materials and Methods
Materials
[12C6]aniline, [13C6]aniline, 2,5-dihydroxybenzoic acid (DHB), 6-aza-2-thiothymine (ATT), bovine pancreas ribonuclease B (RNaseB), dimethyl sulfoxide (DMSO), ammonium citrate, and sodium cyanoborohydride (NaCNBH3) were purchased from Sigma-Aldrich (St. Louis, MO). Lacto-N-neotetraose (LNnT) was obtained from V-labs (Covington, LA). Acetic acid, acetonitrile, and ammonium acetate were purchased from Fisher Scientific (Pittsburgh, PA). Trifluoroacetic acid (TFA) was purchased form Pierce (Rockford, IL). Human serum was obtained from normal healthy donors at Emory University under IRB approved protocol.
Derivatization of free glycans with [12C6]aniline or [13C6]aniline
Twenty-five μl of [12C6]aniline or [13C6]aniline and 25 μl of a fresh solution of 1 M NaCNBH3, prepared in DMSO:acetic acid (7:3), were added to dried, free 0.5–100 nmol glycans, sealed in a 0.6 ml Eppendorf tube, and incubated for 2 h at 65°C. The reaction mixture was dried under vacuum, dissolved in approximately 25 μl of distilled water, and transferred to a glass cartridge column containing 2 paper disks cut from 3M filter paper [26, 27] which absorbs the glycan-derivative and free glycan allowing unreacted aniline, NaCNBH3, and solvent to run through. The aqueous samples were allowed to remain in contact with the paper for 15 min at room temperature and washed with 1 ml of 100% acetonitrile followed by 5 × 1 ml washes with 96% acetonitrile in distilled water. The glycan derivatives were then eluted with 3 washes of 0.5 ml of distilled water. The eluted glycan derivatives were dried and stored at −20°C in the dark until use. The absorbance of LNnT-[12C6]aniline at 260 nm was used for determining aniline-glycan derivative concentrations.
Preparation of free N-glycan
RNase B (1 mg; 100 μl, 10 mg/ml) and 250 μl of human serum were denatured by heating at 100 °C for 10 min in 5% SDS and 0.4 M DTT. Free N-glycans for GRIL analysis were released from the denatured proteins by digestion with 30–60 Units/ml of Peptide:N-Glycosidase F (PNGase F, New England Biolabs, Ipswitch MA) in the presence of 1% NP-40 to protect PNGase F according to manufacturer’s instructions. The mixtures were incubated at 37°C overnight and boiled for 5 min to stop the reaction. The supernatants, obtained after decanting from the pellet after a 21,000 × g centrifugation (5 min), were diluted into 10 ml distilled water, loaded onto a Sep-Pak® C-18 Cartridge (Waters Corporation, Milford, MA), and the released N-glycans were collected in the un-retained fraction, while proteins remain bound to the column. The N-glycans were desalted by absorption to a carbograph SPE cartridge (Alltech, Deerfield, IL), washed with distilled water, eluted with 30% acetonitrile/0.05% TFA, and dried in a Centra-Vap evaporator.
Separation of glycan-aniline derivatives by HPLC
The glycans conjugated with [12C6]aniline and [13C6]aniline were quantitatively absorbed to C18 cartridges and further separated by HPLC on a normal phase column (Zorbax® NH2 analytical 4.6 × 250 mm - 5micron, Agilent Technologies, Palo Alto, CA) using a Shimadzu SCL-10A equipped with a UV detector, at a flow rate of 1.0 ml/min and UV detection at λ=260 nm. Separation was accomplished using a three-solvent system of 100% acetonitrile (Solvent A); 250 mM ammonium acetate-acetic acid, pH 4.5 (Solvent B); and Milli-Q water (Solvent C). A linear gradient from 80% A, 4% B, 16% C to 30% A, 50% B, 20% C was applied over 100 min.
Mass spectrometry of labeled glycans
Matrix-assisted laser desorption/ionization time-of-flight mass spectrometry (MALDI-TOF-MS) was carried out on a Voyager-DE RP Biospectrometry Workstation instrument (Applied Biosystems, Foster City, CA) or on a Bruker Daltonics Ultraflex II MALDI-TOF-TOF (Billerica, MA) using either linear negative or reflective positive mode. The matrix used for MALDI-TOF-MS was 10 mg/ml DHB or ATT prepared in 50% acetonitrile and 0.1% TFA. For positive mode analysis, 5 mM ammonium citrate solution was added to the matrix; for negative mode, 10 mM or 20 mM ammonium citrate solution was added to the matrix. The sample spots were air-dried, and neutral, aniline-derived glycans were analyzed in the positive mode, while the acidic glycan derivatives were analyzed in the negative mode. The ESI-MS and ESI-MS/MS were run on Agilent 1100 Series LC/MSD Trap (Foster City, CA) with an auto-injection syringe (Agilent) at a flow rate of 300 μL/h. The sample was dissolved in 50% methanol (Sigma) and water to a concentration of about 50 μM. The nebulizer pressure was set to 15 p.s.i. The dry gas flow rate was set to 5 L/min and the temperature at 325°C. The MSD trap was set to utilize positive mode. The mass accuracy in these experiments was generally 50–100 ppm without the use of an internal standard.
Results
Strategy for use of glycan reductive isotope labeling (GRIL)
The basis of GRIL is the quantitative derivatization of free, reducing glycans by reductive amination with [12C6]aniline and [13C6]aniline (Fig. 1a). Related approaches are commonly used for making fluorescent derivatives of glycans for HPLC analyses, such as 2-aminobenzoic acid [27, 28, 29]. Figures 1b and 1c show an example of the anticipated results of a comparison between two glycoprotein samples (A and B) that have identical N-glycans, but differ in the fucosylation of an O-glycan. When glycans from sample A (labeled with [13C6]aniline) are mixed with glycans from sample B (labeled with [12C6]aniline) in an equimolar mixture and analyzed by MS, it can be seen that glycan 1a in Sample A and the equivalent glycan 1b in Sample B are detected at equal ion intensity with a 6 Da difference between the differentially isotopically encoded glycans (Fig. 1b and 1c). Thus, it can be concluded that glycan 1a and 1b may be present in samples A and B, respectively, in equal amounts. Demonstration as to whether those glycans are identical in structure can be easily confirmed by MS/MS analyses. By contrast, glycan 2 is detected as glycan-[13C6]aniline molecular ion but no corresponding minus 6 Da species is observed, indicating that glycan 2 is a component of Sample A and absent from Sample B. Similarly, the peak from glycan 3 is detected as glycan-[12C6]aniline but no corresponding plus 6 Da species is observed, indicating that glycan 3 is a component of Sample B and absent from Sample A. Analyses such as these with mixed samples allow a direct qualitative and quantitative glycomic analysis and a ratio of the two labeled peaks. Alternatively, the glycans in Sample A, labeled with [13C6]aniline, could be known amounts of standard glycans (based on absorbance of the aniline derivative) that can be mixed with unknown glycans labeled with [12C6]aniline and analyzed by MALDI-TOF-MS to determine exact concentration of unknowns.
Figure 1. The strategy for using Glycan Reductive Isotope Labeling (GRIL) to analyze glycans.

a: In this approach free glycans either occurring naturally or released from glycoproteins or glycolipids, for example, are derivatized with either [12C6]aniline or [13C6]aniline. b: The glycans labeled with either [12C6]aniline or [13C6]aniline are mixed and analyzed by MALDI-TOF-MS. c: Glycans with related compositions in the two mixed samples are identified as a mass difference of 6 Da doublets and differences in their relative amounts would be seen as quantitative differences in relative peak height with the 6 Da difference doublet. By contrast, glycans that are present in one sample but not another will be seen as unique peaks without a corresponding doublet with a mass difference of 6 Da. The structure of each glycan is shown with symbols as indicated.
Quantitative GRIL of free glycans
We used LNnT to optimize the conjugation of [12C6]aniline and [13C6]aniline to free glycans. [12C6]Aniline and [13C6]aniline were incubated separately with LNnT in 1 M NaCNBH3 in DMSO:acetic acid (7:3) at 65°C. Within 2 h, the conjugation reaction was >98% complete as determined by HPAEC-PAD, where the retention time of free LNnT differed from the corresponding aniline derivative by 30–45 seconds (data not shown) and no differences in response factors between free and derivatized LNnT were observed. Reaction completion was further confirmed by the quantitative conversion of [3H]LNnT to [3H]LNnT-aniline (data not shown) and finally by MS of the purified reaction product as shown in Fig. 2. The data from all methods used for demonstrating quantitative derivatization by reductive amination were in agreement and consistent with the commonly accepted quantitative derivatization of free glycans by reductive amination with other amine-containing derivatives. The addition of aniline caused a slight increase in the retention time of the conjugate compared to the native sugar as measured by reverse phase chromatography. Analysis of the purified LNnT-[12C6]aniline by MALDI-TOF-MS demonstrates the presence of the [LNnT-[12C6]aniline + H]+ at m/z 785.20 and the [LNnT-[12C6]aniline + Na]+ at m/z 807.74, but no [LNnT + H]+ at 708.25 or [LNnT + Na]+ at m/z 730.25. The structure of the LNnT-aniline conjugate was confirmed by ESI-MS (data not shown), which shows B and Y fragment ions. The molecular ion for LNnT-aniline was detected at its predicted mass of 785.4 and fragmentation identified fragments at their predicted masses. The data are consistent with the complete conversion of LNnT to the LNnT-aniline derivative. These data indicate that the method for reductive amination of oligosaccharides with aniline is quantitative. Additional analyses using charged species were also performed, including 3′-sialyllactose and 3′-sulfo-Lewis a, and quantitative derivatization was also obtained (data not shown).
Figure 2. Derivatization of LNnT with aniline is quantitative based on mass spectrometric analysis.

The LNnT-aniline conjugate purified by adsorption to cellulose discs was subjected to ESI-MS analysis on an Agilent 1100 Series LC/MSD Trap, carried out in positive ion mode.
[12C6]Aniline and [13C6]aniline derivatives of LNnT were prepared under identical conditions, dissolved in distilled water, and an equimolar mixture was prepared based on absorbance at 260 nm. The isotopic structures co-eluted during HPLC analysis using normal phase separation, which indicates that there is no isotope effect on the separation of the different aniline derivatives (Fig. 3a). MS analysis of the equimolar mixture of LNnT-[12C6]aniline and LNnT-[13C6]aniline (Fig. 3b) separated by normal phase HPLC revealed molecular ions at m/z 785.2 [LNnT-[12 C6]aniline+H]+ and m/z 791.2 [LNnT-[13 C6]aniline+H]+ with a 6 Da difference as expected for the heavier isotope containing glycan. For the glycans detected as doublets with a mass difference of 6 Da, the relative amount of each labeled glycan was determined as ratio of the 12C:13C aniline label by measuring the monoisotopic peak area. LNnT-aniline 12C:13C ratio of 1.03 (%CV = 4.85) as expected for an equimolar mixture. This method can be combined with other types of chemical modification such as glycan permethylation.
Figure 3.


a: The [12C6]aniline and [13C6]aniline derivatives of LNnT behave identically on normal phase HPLC analysis. An equimolar mixture of LNnT-[12C6]aniline and LNnT-[13C6]aniline co-chromatographed during normal phase separation by HPLC. The aniline derivatives were detected using UV absorption at 260 nm. A profile showing the chromatographic behavior of purified LNnT-[12C6]aniline is inserted below as a reference. b: The 6 Da difference in [12C6]aniline and [13C6]aniline derivatives of LNnT are easily measured by ESI-MS analysis. The equimolar mixture of LNnT-[12C6]aniline and LNnT-[13C6]aniline was subjected to analysis by LC-MS. The structures are shown as symbols (Fig. 1) with the corresponding molecular masses.
GRIL of N-glycans released from glycoproteins
N-glycans released from bovine RNase B by PNGase F were separately derivatized with either [12C6]aniline or [13C6]aniline, and an equimolar mixture was prepared and analyzed by MALDI-TOF-MS (Fig. 4a). The results show that each glycan is represented as a doublet with a 6 Da difference. The average of the peak area ratios (shown in parentheses below each structure and the two masses) in each of the 5 doublets was 0.945 (%CV = 4.7), which was close to the theoretical ratio of 1.0 for an equimolar mixture. The low %CV value indicates the high precision of this method. The inset in Fig. 4a shows the 6 Da difference doublets of the [12C6]aniline and [13C6]aniline derivatives of the Man5GlcNAc2 structure. The method was also applied to PNGase F-released N-glycans from human apo-transferrin, and the data reveal 6 Da difference doublets of the expected biantennary N-glycans (data not shown).
Figure 4.

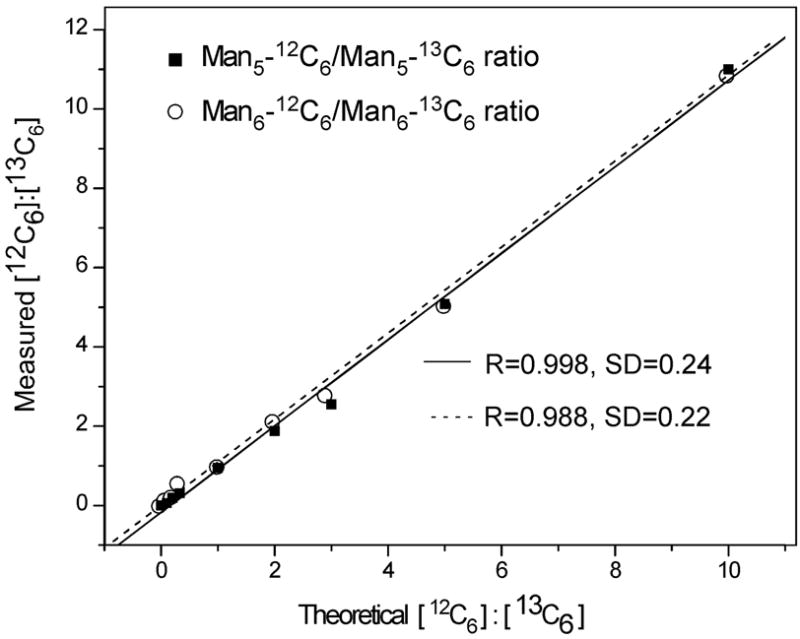
a: GRIL of glycans released by PNGase F from RNaseB. A mixture of free high mannose-type N-glycans Man5, Man6, Man7, Man8, and Man9 released by PNGase F digestion of RNaseB were labeled in separate reactions with [12C6]aniline or [13C6]aniline, mixed in exactly a 1:1 ratio and subjected to MALDI-TOF analysis. The masses of the individual glycans are shown associated with the most plausible structures represented with the symbols as shown in Fig. 1. For doublets found in the equimolar mixtures, the masses are shown below the structure and the ratio of the peak areas of glycan-[12C6]aniline: glycan-[13C6]aniline is shown (R). The inset represents an expansion of a portion of the spectrum. b: Use of GRIL to estimate relative amounts of glycan structures in glycan mixtures. N-glycans derived from RNase B were divided and separately derivatized with [12C6]aniline or [13C6]aniline and these were mixed in molar ratios of 10:1, 5:1, 3:1, 2:1, 1:1, 1:2, 1:3, 1:5, and 1:10 (based on absorption at 260 nm) and subjected to MALDI-TOF analysis. The linear relationship between expected ratios of heavy and light isotope included in the 8 mixtures and ratios calculated from the observed MALDI-TOF profiles of the Man5GlcNAc2-[12C6]aniline and -[13C6]aniline derivatives (■) and the Man6GlcNAc2-[12C6]aniline and -[13C6]aniline derivatives (○) are shown.
Quantitative and qualitative GRIL of glycans
Because this quantification scheme relies on the relative ratio between two different isotopic forms of a glycan derivative, it is important to determine the appropriate working range of the labeling method. To examine the linearity and dynamic range for the quantitative utility of GRIL, equal concentrations of [12C6]aniline and [13C6]aniline derivatized RNase B N-glycans were prepared in nine different 12C:13C ratios (10:1, 5:1, 3:1, 2:1, 1:1, 1:2, 1:3, 1:5, and 1:10 ratio of 12C:13C). The 12C:13C ratio of aniline-labeled glycans were determined by measuring the absorbance at 260 nm of the derivatized glycans. The various mixtures were then analyzed by MALDI-TOF-MS. Fig. 4b demonstrates the linear relationship between the measured ratios of the Man5GlcNAc2- and Man6GlcNAc2-[12C6]aniline: Man5GlcNAc2- and Man6GlcNAc2-[13C6]aniline peak areas and the calculated or theoretical ratios based on the composition of each mixture. The results for the Man5GlcNAc2- and Man6GlcNAc2-derivatives are linear (R=0.998 and 0.988, respectively) over the full range of ratios. At a ratio of 1:20, the glycan-[12C6]aniline derivatives could not be detected (data not shown). These data indicate that the limit of detection in this analysis was between 5 and 10% of the major peak. GRIL clearly demonstrates a 10-fold dynamic range for these measurements. In these experiments, the major peak was obtained from a sample containing 6.4 pmol of glycan, which is consistent with a limit of detection of between 0.32 and 0.64 pmol in these analyses. As outlined in Fig. 1, qualitative differences in glycans from different samples analyzed by GRIL are detected by the absence of the distinctive 6 Da difference doublets.
GRIL of the glycans derived from human and mouse serum samples
Two aliquots of the N-glycans released from a single sample of human serum by PNGase F treatment were separately derivatized with [12C6]aniline or [13C6]aniline. An equimolar mixture of the N-glycan derivatives was analyzed by MALDI-TOF-MS. Six major glycans from a single human serum glycoprotein sample are seen as a doublet with a 6 Da difference between them (Fig. 5a). For example, the derivative at m/z = 2282.2 has the composition [NeuAc2Hex5HexNAc4-[12C6]aniline H2O] and likely represents a di-sialylated biantennary N-glycan derivatized with [12C6]aniline with the calculated mass of 2282.82. The corresponding [13C6]aniline-labeled isomer has a predicted mass of 2288.99, which is consistent with the composition [NeuAc2Hex5HexNAc4-[13C6]aniline H2O] at m/z=2288.99. The average peak area ratio of the six doublets was 0.96 (%CV = 5.2). The structures provided in Fig. 5 are predictions of the likely structures, given the masses and are consistent with published structures [30]. Thus, these data show the reliability of the method and the expected equal ratio of glycans in the same sample prepared as either [12C6]aniline or [13C6]aniline derivatives. The occasional loss of water may be due to the fragmentation ions commonly seen in MALDI-TOF due to the higher energy compared to ESI-MS, even though collision mode was not used, as has been reported by others [31]. However, GRIL provides a distinct advantage in that it is comparative and therefore if the loss of water will be seen in both the [12C6]Aniline- and [13C6]Aniline-labeled glycans.
Figure 5. Use of GRIL to detect both qualitative and qualitative differences in glycan mixtures.


Glycans released from human and mouse serums by PNGase F were separately labeled with [12C6]aniline and [13C6]aniline. a: The MALDI-TOF profile of an equimolar mixture of [12C6]aniline-glycans and [13C6]aniline-glycans from a single human serum sample (Human Serum 1). b: The MALDI-TOF profile of an equimolar mixture of [12C6]aniline-glycans and [13C6]aniline-glycans from two different human serum samples (Human Serum 1 + Human serum 2). c: The MALDI-TOF profile of an equimolar mixture of [12C6]aniline-glycans and [13C6]aniline-glycans from a single mouse serum sample (Mouse Serum 1). d: The MALDI-TOF profile of an equimolar mixture of [12C6]aniline-glycans from mouse serum and [13C6]aniline-glycans from human serum. The masses of the individual glycans are shown associated with the most plausible structures represented with the symbols as shown in Fig. 1 with masses of [13C6]aniline-glycans labeled in red and masses of [12C6]aniline-glycans labeled in blue. In the case of the doublets found in the equimolar mixtures, the masses are shown below the structure and the ratio of the peak areas of glycan-[12C6]aniline: glycan-[13C6]aniline is shown (R). The inset represents an expansion of a portion of the mass spectrum.
[12C6]Aniline-labeled N-glycans from one individual were mixed with [13C6]aniline-labeled N-glycans from a second individual in an equimolar ratio. The MALDI-TOF spectra in Fig. 5b were obtained through reflective negative mode and the masses quoted are monoisotopic. The spectra are qualitatively indistinguishable compared to the profile of the mixed glycan derivatives of a single donor. The average peak area ratios of the six doublets were 0.95 (%CV = 4.2). The average of ratios of the six doublets from 3 donors (data not shown) was 0.91 (%CV = 8.0). Many such analyses were conducted with mixtures of N-glycans derived from sera of several healthy donors, and the results were representative of those in Fig. 5b (data not shown). These data demonstrate that there are minute qualitative and quantitative differences in the major glycans among the healthy human donors tested.
N-glycans from mouse serum glycoproteins have not been described in detail, and we questioned the degree to which they would be similar to those in human serum glycoproteins. Accordingly, the N-glycans derived from mouse serum glycoproteins were derivatized with either [12C6]aniline or [13C6]aniline and the MALDI-TOF-MS profile in Fig. 5c, obtained through reflective negative mode with monoisotopic masses quoted, demonstrates that N-glycans in mouse serum are detected as doublets with a 6 Da difference, similar to glycans in the human healthy patient samples. The average ratio of the 10 doublets was 0.98 (%CV = 6.1), close to the predicted value of 1.0 for an equimolar mixture and represents that there are no significant differences in glycan concentration. For the most abundant serum glycoproteins, there is little variation in concentration for released N-glycans, the high concentration serum glycoproteins have a consistent glycosylation in healthy individuals [23, 30].
We then compared the serum glycome of mouse to human using GRIL and we observed dramatic qualitative differences in the glycans. We prepared equimolar mixtures of mouse glycan-[12C6]aniline derivatives and human glycan-[13C6]aniline derivatives (Fig. 5d). For example, the human serum glycan at m/z=2288.74 (Fig. 5d) has a mass consistent with a biantennary complex N-glycan terminating with two NeuAcs and derivatized with [13C6]aniline, which means that it was derived from human serum. The absence of the corresponding [12C6]aniline derivative at 2282.74 indicates that this structure is absent from the major glycoproteins of mouse serum. This is consistent with the absence of this glycan in the spectrum for the major mouse serum glycans (Fig. 5c). Mouse serum glycoproteins contain biantennary complex type N-glycans as expected; however, the mouse glycans only have NeuGc as their sialic acid on this glycan as indicated by: a) the presence of the doublet at 2314.66/2320.68 in the spectrum of the mouse glycans (Fig. 5c); and b) the [12C6]aniline derivative detected in the mixture of mouse and human glycans in Fig. 5d at m/z=2314.70. The presumed structure of the mouse N-glycan is NeuGc2Hex2HexNAc2Man3GlcNAc2-[12C6]aniline-H2O with a calculated mass of 2314.80, which is consistent with NeuGc as the predominant sialic acid of the mouse [32, 33]. In addition, a minor component at m/z of 2461.72 that corresponded to a composition of [NeuGc2Fuc1Hex2HexNAc2Man3GlcNAc2-[12C6]aniline-H2O], with a predicted mass of 2461.83 is also present only in the mouse serum sample (Fig. 5d). The mono-sialyl derivatives of biantennary N-glycans are also represented in the m/z range of 1990 to 2070 mass units in both human and mouse glycans as NeuAc (1997.67) and NeuGc (2007.60) derivatives, respectively (Fig. 5d). An N-glycan derivative (2039.92) is present in the human glycans (Fig. 5d), while the apparent corresponding structure in mouse may be a related N-glycan at m/z=2051.58.
Only two N-glycans among these glycomes appear to be shared between human and mouse serum glycoproteins. One N-glycan that is common between mouse and human serum glycoproteins is a doublet in both samples and the mixture at m/z= 1700.55 and 1706.60. However, this glycan is only a minor component based on its relative ion intensity, seen in an expanded scale in Fig. 5d. The presumed structure is the asialo-precursor to biantennary complex N-glycans that contains NeuAc in human serum and NeuGc in mouse serum. When comparing the two healthy individuals, the human serum glycans the ratio of peaks at 1700.55 and 1706.60 is ~0.8 and in mouse serum glycans, the ratio is 1.1. This structure is seen only in a trace amount in the mixture of mouse and human and the ratio is ~0.20 indicating that this peak is 5-fold less in the mouse glycans when compared to human serum glycans. A second N-glycan that may be common is the bisected, biantennary N-glycan that appears as a doublet at 1743.66 and 1749.68 in both mouse and human serum glycans, appears in the mixture (Fig. 5d) as the [12C6]aniline derivative from human serum with only a minor contribution from mouse serum glycans. The peak area ratio for the glycan is only 0.13 (Fig. 5d), which is close to the limit of detection for this analysis. The high mannose-type N-glycans are found in the mouse serum but are not a major structure in the human serum sample. For example, the peak at m/z=1294.44 is presumably a Man5GlcNAc2 glycan present in the mouse serum glycans, but does not appear in this human serum glycan sample.
Discussion
Here we describe a novel approach for reductive amination of all free, reducing glycans with isotopes of aniline to provide 13C isotope-coded labels for the comparative analysis of glycan mixtures. [12C6]Aniline is commercially available along with its inexpensive heavy isotope counterpart, [13C6]aniline. The approach provides relative quantitative derivatization of glycans; and since mixtures are used with the isotope label, the comparative analyses provide quantitative information about changes in glycan levels. Importantly, these isotopically labeled aniline derivatives behave equivalently in HPLC and Dionex HPAEC and have excellent properties for one-step purification based on their high affinity for C18 resins and/or cellulose. The derivatives of both [12C6]aniline and [13C6]aniline can be analyzed by ESI-MS or MALDI-MS directly, as the glycan derivative or as permethylated derivatives (data not shown).
Five key advantages of GRIL that make it attractive include: (1) the label, aniline, is hydrophobic and allows the adsorption of glycans directly on C18 supports; (2) the tag absorbs UV light and allows complete quantification of total glycans without further chemical analyses; (3) the 6 Da difference in glycan pairs in two different samples are independent of glycan heterogeneity and size, and the 6Da change is substantial enough to allow definitive characterization of “doublet” masses for glycan pairs versus a mass shift of 4 Da seen in other techniques; (4) each free glycan acquires a single label at the reducing end, which when mixed results in a novel dual label system for measuring 2 glycans simultaneously; and (5) the quantitation step is performed directly before MS analysis, providing a more accurate measure of quantity compared to other methods where quantitation is performed at the beginning of sample processing, where steps are less than 100% efficient. The other related methods for studies on glycans utilize [12C] and [13C] isotopes of CH3I in permethylation of samples [24] and deuterium-labeled anthranilic acid derivatives [34] or require extensive synthesis for generation of derivative [21]. Other recent related methods for quantification of glycans rely on relative prevalence of individual peaks in single samples [35]. There are reports using aniline and benzylamine for derivatization of glycans by reductive amination, but these derivatives were not used in isotopic forms [36–38]. The GRIL approach described here is comparable to ICAT approaches used in proteomics where peptides are readily quantified [16]. During the course of our development of this technique, we applied the method to studies on the fine structures of glycosaminoglycans as described by Lawrence et al [39]. In addition, contemporaneously with this development were studies by Ridlova et al [40] that utilize [12C] and [13C] isotopes of aniline in reductive amination to resolve plant polysaccharides in capillary normal-phase (NP)-LC and ESI-MS. Thus, the use of [12C6]aniline and [13C6]aniline for GRIL is highly validated and will provide a general solution to quantitative glycomics by mass spectrometry.
We validated GRIL with a wide variety of free glycans and also used it to explore the potential differences in N-glycan structures of human and mouse serum glycoproteins. Our results show that total N-glycans released from total glycoproteins in individual human serum samples do not differ significantly among the normal healthy donors we examined. However, there was surprisingly little similarity between human and mouse serum-derived N-glycans. The differences were readily apparent both quantitatively and qualitatively and demonstrate the utility of this approach for detailed examination of total N-glycan pools between different samples. N-glycans derived from mouse serum glycoproteins are exclusively NeuGc rather than NeuAc, and the glycans contained different branching and fucosylation patterns. In addition, high mannose-type N-glycans are abundant in mouse serum glycoproteins but not in human serum glycoproteins. Little is known about the glycan structures in total mouse serum glycoproteins, other than that there are unique glycan structures on some glycoproteins and that there are significant changes in terminal glycan extensions in conditions of inflammation [41, 42]. Our results offer a new approach to explore such inflammation-dependent changes in serum glycoproteins and indicate that N-glycosylation of mouse serum glycoproteins is qualitatively unique compared to human serum glycoproteins.
We previously showed that O-glycans in airway mucins from non-diseased individuals are different in many ways from the airway mucins derived from individuals with cystic fibrosis [43], consistent with a wide variety of other studies [44]. Many previous analyses were performed on free glycans derivatized with 2-aminobenzamide. Individual samples were analyzed, not mixtures as with the GRIL approach described here, and it was difficult to draw quantitative and qualitative conclusions about glycans in different samples. In future work, we will perform GRIL on non-diseased and cystic fibrosis mucin samples to quantify difference in the O-glycans between the non-diseased and cystic fibrosis samples. The GRIL technique should allow for the visual identification of glycans that are absent or present in different mucin samples and will facilitate the use of O-glycan markers for this and related diseases where there are qualitative and quantitative alterations in O-glycan structures.
A large number of human diseases are now known to arise from altered glycosylation of proteins [45]. However, the techniques available to date to study these changes often involve complex biochemical manipulations and indirect methods. Modern mass spectrometry offers a unique approach to both identify glycan structures and relate them to change in the human glycome expression [46]. The GRIL method described here will be invaluable in defining these changes in a relatively simple and straightforward manner that will facilitate more high-throughput studies.
Acknowledgments
This work was supported in part by NIH Grant HL065509 to GPS and resources from the Glycomics Center at Emory University. The authors thank Dr. Ziad Kawar for contributing glycans for this study and Dr. Jamie Heimburg-Molinaro and Dr. Xuezheng Song for suggestions, manuscript preparation, and review. The authors declare that they have no competing financial interest.
Abbreviations
- ATT
6-aza-2-thiothymine
- CDG
Congenital Disorders of Glycosylation
- Da
Daltons
- DHB
2,5-dihydroxybenzoic acid
- DMSO
dimethyl sulfoxide
- ESI-MS
electro-spray ionization mass spectrometry
- GRIL
glycan reductive isotopic labeling
- HPAEC
high performance anion exchange chromatography
- ICAT
isotope-coded affinity tags
- LNnT
Lacto-N-neotetraose
- NaCNBH3
sodium cyanoborohydride
- PNGase-F, Peptide
N-Glycosidase F
- RNaseB
bovine pancreas ribonuclease B
Footnotes
Publisher's Disclaimer: This is a PDF file of an unedited manuscript that has been accepted for publication. As a service to our customers we are providing this early version of the manuscript. The manuscript will undergo copyediting, typesetting, and review of the resulting proof before it is published in its final citable form. Please note that during the production process errors may be discovered which could affect the content, and all legal disclaimers that apply to the journal pertain.
References
- 1.Endo T, Manya H. O-mannosylation in mammalian cells. Methods Mol Biol. 2006;347:43–56. doi: 10.1385/1-59745-167-3:43. [DOI] [PubMed] [Google Scholar]
- 2.Butler M, Quelhas D, Critchley AJ, Carchon H, Hebestreit HF, Hibbert RG, Vilarinho L, Teles E, Matthijs G, Schollen E, Argibay P, Harvey DJ, Dwek RA, Jaeken J, Rudd PM. Detailed glycan analysis of serum glycoproteins of patients with congenital disorders of glycosylation indicates the specific defective glycan processing step and provides an insight into pathogenesis. Glycobiology. 2003;13:601–22. doi: 10.1093/glycob/cwg079. [DOI] [PubMed] [Google Scholar]
- 3.Sun L, Eklund EA, Chung WK, Wang C, Cohen J, Freeze HH. Congenital disorder of glycosylation id presenting with hyperinsulinemic hypoglycemia and islet cell hyperplasia. J Clin Endocrinol Metab. 2005;90:4371–5. doi: 10.1210/jc.2005-0250. [DOI] [PubMed] [Google Scholar]
- 4.Ju T, Cummings RD. Protein glycosylation: chaperone mutation in Tn syndrome. Nature. 2005;437:1252. doi: 10.1038/4371252a. [DOI] [PubMed] [Google Scholar]
- 5.Teague RH, Fraser D, Clamp JR. Changes in monosaccharide content of mucous glycoproteins in ulcerative colitis. Br Med J. 1973;2:645–6. doi: 10.1136/bmj.2.5867.645. [DOI] [PMC free article] [PubMed] [Google Scholar]
- 6.Bodger K, Halfvarson J, Dodson AR, Campbell F, Wilson S, Lee R, Lindberg E, Jarnerot G, Tysk C, Rhodes JM. Altered colonic glycoprotein expression in unaffected monozygotic twins of inflammatory bowel disease patients. Gut. 2006;55:973–7. doi: 10.1136/gut.2005.086413. [DOI] [PMC free article] [PubMed] [Google Scholar]
- 7.Kobata A, Amano J. Altered glycosylation of proteins produced by malignant cells, and application for the diagnosis and immunotherapy of tumours. Immunol Cell Biol. 2005;83:429–39. doi: 10.1111/j.1440-1711.2005.01351.x. [DOI] [PubMed] [Google Scholar]
- 8.Jang-Lee J, North SJ, Sutton-Smith M, Goldberg D, Panico M, Morris H, Haslam S, Dell A. Glycomic profiling of cells and tissues by mass spectrometry: fingerprinting and sequencing methodologies. Methods Enzymol. 2006;415:59–86. doi: 10.1016/S0076-6879(06)15005-3. [DOI] [PubMed] [Google Scholar]
- 9.Haslam SM, North SJ, Dell A. Mass spectrometric analysis of N- and O-glycosylation of tissues and cells. Curr Opin Struct Biol. 2006;16:584–91. doi: 10.1016/j.sbi.2006.08.006. [DOI] [PubMed] [Google Scholar]
- 10.Dell A, Morris HR. Glycoprotein structure determination by mass spectrometry. Science. 2001;291:2351–6. doi: 10.1126/science.1058890. [DOI] [PubMed] [Google Scholar]
- 11.Zhang H, Singh S, Reinhold VN. Congruent strategies for carbohydrate sequencing. 2. FragLib: an MS(n) spectral library. Anal Chem. 2005;77:6263–70. doi: 10.1021/ac050725r. [DOI] [PMC free article] [PubMed] [Google Scholar]
- 12.Ashline D, Singh S, Hanneman A, Reinhold V. Congruent strategies for carbohydrate sequencing. 1. Mining structural details by MS(n) Anal Chem. 2005;77:6250–62. doi: 10.1021/ac050724z. [DOI] [PMC free article] [PubMed] [Google Scholar]
- 13.Hitchcock AM, Costello CE, Zaia J. Glycoform quantification of chondroitin/dermatan sulfate using a liquid chromatography-tandem mass spectrometry platform. Biochemistry. 2006;45:2350–61. doi: 10.1021/bi052100t. [DOI] [PMC free article] [PubMed] [Google Scholar]
- 14.Wada Y. Mass spectrometry for congenital disorders of glycosylation, CDG. J Chromatogr B Analyt Technol Biomed Life Sci. 2006;838:3–8. doi: 10.1016/j.jchromb.2006.02.028. [DOI] [PubMed] [Google Scholar]
- 15.Leroy JG. Congenital disorders of N-glycosylation including diseases associated with O- as well as N-glycosylation defects. Pediatr Res. 2006;60:643–56. doi: 10.1203/01.pdr.0000246802.57692.ea. [DOI] [PubMed] [Google Scholar]
- 16.Gygi SP, Rist B, Gerber SA, Turecek F, Gelb MH, Aebersold R. Quantitative analysis of complex protein mixtures using isotope-coded affinity tags. Nat Biotechnol. 1999;17:994–9. doi: 10.1038/13690. [DOI] [PubMed] [Google Scholar]
- 17.Whelan SA, Hart GW. Identification of O-GlcNAc sites on proteins. Methods Enzymol. 2006;415:113–33. doi: 10.1016/S0076-6879(06)15008-9. [DOI] [PubMed] [Google Scholar]
- 18.Wada Y, Azadi P, Costello CE, Dell A, Dwek RA, Geyer H, Geyer R, Kakehi K, Karlsson NG, Kato K, Kawasaki N, Khoo KH, Kim S, Kondo A, Lattova E, Mechref Y, Miyoshi E, Nakamura K, Narimatsu H, Novotny MV, Packer NH, Perreault H, Peter-Katalinic J, Pohlentz G, Reinhold VN, Rudd PM, Suzuki A, Taniguchi N. Comparison of the methods for profiling glycoprotein glycans--HUPO Human Disease Glycomics/Proteome Initiative multi-institutional study. Glycobiology. 2007;17:411–22. doi: 10.1093/glycob/cwl086. [DOI] [PubMed] [Google Scholar]
- 19.Julka S, Regnier F. Quantification in proteomics through stable isotope coding: a review. J Proteome Res. 2004;3:350–363. doi: 10.1021/pr0340734. [DOI] [PubMed] [Google Scholar]
- 20.Wade D. Deuterium isotope effects on noncovalent interactions between molecules. Chem Biol Interact. 1999;117:191–217. doi: 10.1016/s0009-2797(98)00097-0. [DOI] [PubMed] [Google Scholar]
- 21.Bowman M, Zaia J. Novel tags for the stable isotopic labeling of carbohydrates and quantitative analysis by mass spectrometry. Anal Chem. 2007;76:5777–5784. doi: 10.1021/ac070581b. [DOI] [PMC free article] [PubMed] [Google Scholar]
- 22.Atwood JA, III, Alvarez-Manilla G, Warren NL, York WS, Orlando R. Quantitation by isobaric labeling: applications to glycomics. J Proteome Res. 2008;7:367–374. doi: 10.1021/pr070476i. [DOI] [PubMed] [Google Scholar]
- 23.Kang P, Mechref Y, Kyselova Z, Goetz J, Novotny M. Comparative Glycomic Mapping through Quantitative Permethylation and Stable-Isotope Labeling. Anal Chem. 2007;79:6064–6073. doi: 10.1021/ac062098r. [DOI] [PubMed] [Google Scholar]
- 24.Alvarez-Manilla G, Warren NL, Abney T, Atwood J, III, Azadi P, York WS, Pierce M, Orlando R. Tools for glycomics: relative quantitation of glycans by isotopic permethylation using 13CH3I. Glycobiology. 2007;17:677–687. doi: 10.1093/glycob/cwm033. [DOI] [PubMed] [Google Scholar]
- 25.Zhang R, Sioma CS, Thompson RA, Xiong L, Regnier FE. Controlling deuterium isotope effects in comparative proteomics. Anal Chem. 2002;74:3662–9. doi: 10.1021/ac025614w. [DOI] [PubMed] [Google Scholar]
- 26.Merry AH, Neville DC, Royle L, Matthews B, Harvey DJ, Dwek RA, Rudd PM. Recovery of intact 2-aminobenzamide-labeled O-glycans released from glycoproteins by hydrazinolysis. Anal Biochem. 2002;304:91–9. doi: 10.1006/abio.2002.5620. [DOI] [PubMed] [Google Scholar]
- 27.Xia B, Kawar ZS, Ju T, Alvarez RA, Sachdev GP, Cummings RD. Versatile fluorescent derivatization of glycans for glycomic analysis. Nat Methods. 2005;2:845–50. doi: 10.1038/nmeth808. [DOI] [PubMed] [Google Scholar]
- 28.Bigge JC, Patel TP, Bruce JA, Goulding PN, Charles SM, Parekh RB. Nonselective and efficient fluorescent labeling of glycans using 2-amino benzamide and anthranilic acid. Anal Biochem. 1995;230:229–38. doi: 10.1006/abio.1995.1468. [DOI] [PubMed] [Google Scholar]
- 29.Hase S. Analysis of sugar chains by pyridylamination. Methods Mol Biol. 1993;14:69–80. doi: 10.1385/0-89603-226-4:69. [DOI] [PubMed] [Google Scholar]
- 30.Harvey DJ, Radcliffe CM, Rudd PM, Dwek RA. Structural and quantitative analysis of N-linked glycans by matrix-assisted laser desorption ionization and negative ion nanospray mass spectrometry. Anal Biochem. 2008;376:44–60. doi: 10.1016/j.ab.2008.01.025. [DOI] [PubMed] [Google Scholar]
- 31.Hsu J, Chang SJ, Franz AH. MALDI-TOF and ESI-MS Analysis of Oligosaccharides labeled with a new multifunctional Oligosaccharide tag. J Amer Soc Mass Spectrom. 2006;17:194–204. doi: 10.1016/j.jasms.2005.10.010. [DOI] [PubMed] [Google Scholar]
- 32.Kirmiz C, Li B, An HJ, Clowers BH, Chew HK, Lam KS, Ferrige A, Alecio R, Borowsky AD, Sulaimon S, Lebrilla CB, Miyamoto S. A serum glycomics approach to breast cancer biomarkers. Mol Cell Proteomics. 2007;6:43–55. doi: 10.1074/mcp.M600171-MCP200. [DOI] [PubMed] [Google Scholar]
- 33.Raju TS, Briggs JB, Borge SM, Jones AJ. Species-specific variation in glycosylation of IgG: evidence for the species-specific sialylation and branch-specific galactosylation and importance for engineering recombinant glycoprotein therapeutics. Glycobiology. 2000;10:477–86. doi: 10.1093/glycob/10.5.477. [DOI] [PubMed] [Google Scholar]
- 34.Hitchcock AM, Yates KE, Shortkroff S, Costello CE, Zaia J. Optimized extraction of glycosaminoglycans from normal and osteoarthritic cartilage for glycomics profiling. Glycobiology. 2007;17:25–35. doi: 10.1093/glycob/cwl046. [DOI] [PMC free article] [PubMed] [Google Scholar]
- 35.Aoki K, Perlman M, Lim JM, Cantu R, Wells L, Tiemeyer M. Dynamic developmental elaboration of N-linked glycan complexity in the Drosophila melanogaster embryo. J Biol Chem. 2007;282:9127–42. doi: 10.1074/jbc.M606711200. [DOI] [PubMed] [Google Scholar]
- 36.Lemoine J, Chirat F, Domon B. Structural analysis of derivatized oligosaccharides using post-source decay matrix-assisted laser desorption/ionization mass spectrometry. J Mass Spectrom. 1996;31:908–12. doi: 10.1002/(SICI)1096-9888(199608)31:8<908::AID-JMS376>3.0.CO;2-D. [DOI] [PubMed] [Google Scholar]
- 37.Osman SF, Hoagland PD. A sequencing method for the reductive-amination derivatives of oligo- and polysaccharides. Carbohy Res. 1984;128:361–365. [Google Scholar]
- 38.Wang WT, LeDonne NC, Jr, Ackerman B, Sweeley CC. Structural characterization of oligosaccharides by high-performance liquid chromatography, fast-atom bombardment-mass spectrometry, and exoglycosidase digestion. Anal Biochem. 1984;141:366–81. doi: 10.1016/0003-2697(84)90057-5. [DOI] [PubMed] [Google Scholar]
- 39.Lawrence R, Olson SK, Steele RE, Wang L, Warrior R, Cummings RD, Esko JD. Evolutionary Differences in Glycosaminoglycan Fine Structure Detected by Quantitative Glycan Reductive Isotope Labeling. J Biol Chem. 2008;283:33674–33684. doi: 10.1074/jbc.M804288200. [DOI] [PMC free article] [PubMed] [Google Scholar]
- 40.Ridlova G, Mortimer JC, Maslen SL, Dupree P, Stephens E. Oligosaccharide relative quantitation using isotope tagging and normal-phase liquid chromatography/mass spectrometry. Rapid Comm Mass Spec. 2008;22:2723–2730. doi: 10.1002/rcm.3665. [DOI] [PubMed] [Google Scholar]
- 41.Heegaard PM. Changes in serum glycoprotein glycosylation during experimental inflammation in mice are general, unrelated to protein type, and opposite changes in man and rat: studies on mouse serum alpha 1-acid glycoprotein, alpha 1-esterase, and alpha 1-protease inhibitor. Inflamm. 1992;16:631–44. doi: 10.1007/BF00919346. [DOI] [PubMed] [Google Scholar]
- 42.Yasukawa Z, Sato C, Kitajima K. Inflammation-dependent changes in alpha2,3-, alpha2,6-, and alpha2,8-sialic acid glycotopes on serum glycoproteins in mice. Glycobiology. 2005;15:827–37. doi: 10.1093/glycob/cwi068. [DOI] [PubMed] [Google Scholar]
- 43.Xia B, Royall JA, Damera G, Sachdev GP, Cummings RD. Altered O-glycosylation and sulfation of airway mucins associated with cystic fibrosis. Glycobiology. 2005;15:747–75. doi: 10.1093/glycob/cwi061. [DOI] [PubMed] [Google Scholar]
- 44.Lamblin G, Degroote S, Perini JM, Delmotte P, Scharfman A, Davril M, Lo-Guidice JM, Houdret N, Dumur V, Klein A, Rousse P. Human airway mucin glycosylation: a combinatory of carbohydrate determinants which vary in cystic fibrosis. Glycoconj J. 2001;18:661–84. doi: 10.1023/a:1020867221861. [DOI] [PubMed] [Google Scholar]
- 45.Ohtsubo K, Marth JD. Glycosylation in cellular mechanisms of health and disease. Cell. 2006;126:855–67. doi: 10.1016/j.cell.2006.08.019. [DOI] [PubMed] [Google Scholar]
- 46.Comelli EM, Amado M, Head SR, Paulson JC. Custom microarray for glycobiologists: considerations for glycosyltransferase gene expression profiling. Biochem Soc Symp. 2002:135–42. doi: 10.1042/bss0690135. [DOI] [PubMed] [Google Scholar]