Abstract
Crowding refers to the increased diffculty in identifying a letter flanked by other letters. The purpose of this study was to determine if the peak sensitivity of the human visual system shifts to a different spatial frequency when identifying crowded letters, compared with single letters. We measured contrast thresholds for identifying the middle target letters in trigrams, for a range of spatial frequencies, letter separations and letter sizes, at the fovea and 5° eccentricity. Plots of contrast sensitivity vs. letter frequency exhibit spatial tuning, for all letter sizes and letter separations tested. The peak tuning frequency grows as the 0.6–0.7 power of the letter size, independent of letter separation. At the smallest letter separation, peak tuning frequency occurs at a frequency that is 0.17 octaves higher for flanked than for unflanked letters at the fovea, and 0.19 octaves at 5° eccentricity. This finding suggests that the human visual system shifts its sensitivity toward a higher spatial-frequency channel when identifying letters in the presence of nearby letters. However, the size of the shift is insuffcient to account for the large effect of crowding in the periphery.
Keywords: Crowding, Letter identification, Spatial frequency channel, Spatial scale shift
1. Introduction
Our ability to identify a letter is better when it is presented alone, than when it is flanked by other letters in close proximity (e.g. Bouma, 1970; Townsend, Taylor, & Brown, 1971). This phenomenon is termed crowding. A closely related phenomenon, contour interaction, refers to the effect of proximal contours such as bars or edges on the resolution of a single letter (Flom, Weymouth, & Kahneman, 1963). Crowding and contour interaction are ubiquitous in spatial vision. For instance, it has been demonstrated that crowding or contour interaction affect two-bar resolution (Takahashi, 1967), Vernier discrimination (Levi & Klein, 1985; Levi, Klein, & Aitsebaomo, 1985; Westheimer & Hauske, 1975), stereopsis (Butler & Westheimer, 1978) and line orientation sensitivity (Westheimer, Shimamura, & McKee, 1976). In these tasks, thresholds for task performance are always elevated in the presence of nearby flanking elements. Even though the impact of crowding or contour interaction on spatial task performance is well documented, the mechanism underlying crowding remains unclear.
Several hypotheses ranging from early sensory to high-order interactions have been examined as the underlying mechanism(s) of crowding. A popular hypothesis involving an early sensory explanation is that crowding is simply ordinary spatial-frequency based masking with laterally displaced maskers. By comparing the spatial-frequency and contrast properties of crowding with those of ordinary masking, we previously showed that although crowding shows spatial-frequency selectivity similar to that of ordinary masking, it lacks other signatures of ordinary masking (Chung, Levi, & Legge, 2001). Specifically, the spatial extent of crowding in peripheral vision does not vary with stimulus frequency (see also Levi, Hariharan, & Klein, 2002b; Tripathy & Cavanagh, 2002), crowding does not exhibit contrast facilitation at low stimulus contrast and the contrast response of crowding at high stimulus contrast is not comparable with that of ordinary masking. Subsequent studies by Levi and his colleagues provided additional evidence showing that whereas foveal crowding is related to simple contrast masking (Levi, Klein, & Hariharan, 2002a), peripheral crowding requires a different explanation (Levi et al., 2002b).
Pelli, Palomares, and Majaj (2004) extended the comparison of crowding and ordinary masking by showing that ordinary masking impairs feature detection while crowding impairs feature integration. In their model, feature integration resides in a second-stage process and takes place within an integration field. They argued that at the fovea, the visual system could utilize an integration field of an appropriate size and location as the object to be identified. In the periphery where small integration fields are absent, the visual system uses inappropriately large integration field to integrate features, thus causing crowding. According to this model, crowding is an inevitable consequence when the task involves more than one feature-detection event. The notion of feature integration underlying crowding is consistent with the findings of several other reports. Parkes, Lund, Angelucci, Solomon, and Morgan (2001) showed that when a target grating patch was surrounded by several other grating patches, observers were unable to report the orientation of the target patch; yet, observers could reliably estimate the average orientation of the ensemble of patches. This finding suggests that the local orientation signal of the target grating patch was integrated with the orientation signals of the other patches. Capitalizing on the fact that crowding is an inevitable consequence of feature integration, we previously examined a counter-intuitive hypothesis that the crowding effect induced by flanking elements on a target could be released if additional elements are added such that the additional and flanking elements are integrated into a global object that is separated from the target (Tjan, Chung, & Oliensis, 2001). Consistent with this prediction, we indeed found such a “release” of crowding by adding more flanking elements to the target, thus strengthening the support for an association between crowding and feature integration.
Besides early sensory explanations, crowding has been attributed to an inability of observers to attend to the target in the presence of flanking elements. He, Cavanagh, and Intriligator (1996) reported that observers experienced an orientation-specific adaptation elicited by a grating patch flanked by other grating patches even though they were unable to report the orientation of the target grating patch. They explained their finding as evidence that the activation of orientation-sensitive neurons in the visual cortex is insuffcient for conscious perception, and that this crowding effect reflects the limited resolution of the spatial attention mechanism. Leat, Li, and Epp (1999) compared visual acuities for letters flanked by simple contours vs. letter flankers, on the premise that more attention is required to recognize the target when the flankers are letters (similar to the target) than when they are simple contours. Consistent with their premise, they found that acuities are always worse with letter flankers than with contour flankers. More recently, Tripathy and Cavanagh (2002) found that the spatial extent of crowding in peripheral vision does not scale with target size (see also Pelli et al., 2004). They interpreted this finding as evidence that the crowding extent is limited by attentional resolution rather than spatial resolution at a given eccentricity. Interestingly, Pelli et al. (2004) found similar results as Tripathy and Cavanagh (2002); nevertheless, Pelli et al. (2004) favored an explanation based on feature integration (a sensory phenomenon) instead of an attentional-based explanation.
Yet another hypothesis for explaining crowding is that in the presence of surrounding objects, the visual system shifts its sensitivity toward a spatial-frequency mechanism different from that used to analyze the target when it is present alone. If this shift in the spatial scale of analysis were toward lower spatial-frequencies, the resolution of the visual system would become poorer, thus explaining why it is more diffcult to resolve a target in the presence of surrounding objects. Using a Landolt C stimulus, Hess and his colleagues (Hess, Dakin, & Kapoor, 2000a; Hess, Dakin, Kapoor, & Tewfik, 2000b) indeed found a shift in the spatial scale when the Landolt C stimulus was flanked by four bars, compared with the no-bar condition. However, contrary to the prediction of the hypothesis, the shift in spatial scale was toward a higher instead of a lower frequency. The magnitude of the shift was approximately 0.5 octaves.
All of the studies cited above, with the exceptions of Chung et al. (2001) and Pelli et al. (2004), examined crowding using tasks and/or stimuli that did not involve identifying letters flanked by other letters (we will refer to this as “letter crowding”). We are interested in studying letter crowding because of our interest in understanding the limitations and the potentials of peripheral vision in relation to reading. Even when print size is not a limiting factor, reading is slow in normal peripheral vision (Chung, Mans-field, & Legge, 1998) and in patients with central vision loss who presumably have to rely on their residual peripheral vision to read (Faye, 1984; Legge, Rubin, Pelli, & Schleske, 1985; Rubin, 1986). Because the spatial extent (Bouma, 1970; Jacobs, 1979; Latham & Whitaker, 1996; Toet & Levi, 1992) and intensity (Jacobs, 1979; Loomis, 1978) of crowding are greater in peripheral than central vision, it has been suggested as a major factor contributing to slow reading in peripheral vision. If crowding indeed limits peripheral reading, and if we could understand its underlying mechanism, then we might be able to develop strategies to minimize crowding in text, which might ultimately improve reading performance in people with central vision loss. Therefore, the ultimate goal of our series of studies on crowding, including the present study, is to identify the mechanism(s) of letter crowding.
It is likely that more than one mechanism contributes to letter crowding. In this study, we examined one such potential mechanism. We asked if the findings of Hess et al. (2000a, 2000b), who showed a shift in the spatial scale of analysis toward a higher spatial frequency when observers identified a Landolt C flanked by four bars, compared with the unflanked condition, could be extended to the case of letter crowding. Specifically, we hypothesized that the human visual system shifts its sensitivity toward a higher spatial-frequency mechanism for identifying letters flanked by other letters, than for single letters. To anticipate, we found a shift in human observers’ sensitivity toward a higher spatial-frequency mechanism for letter crowding, consistent with the findings of Hess et al. (2000a, 2000b). However, the magnitude of the shift is small and only occurs for our closest letter separation. This shift was found only in human observers, but not in a CSF-limited ideal-observer model,1 suggesting that human observers rely upon non-optimal spatial-frequency mechanisms during crowding; yet the size of the shift is insuffcient to account for the large effect of crowding in the periphery.
2. Methods
To test our hypothesis that the visual system shifts its sensitivity toward a different spatial-frequency mechanism when identifying a letter flanked by other letters, than when identifying a single letter, we determined the spatial-tuning functions for identifying the middle (target) letter of trigrams (sequences of three random letters) as a function of letter separations and letter sizes. Spatial-tuning functions were obtained by measuring the contrast thresholds for identifying letters that contained different bands of spatial frequencies (see details below). For comparison, we also determined the spatial-tuning functions for identifying single letters. Because crowding is more pronounced outside the fovea (Chung et al., 2001; Jacobs, 1979; Latham & Whitaker, 1996; Loomis, 1978; Strasburger, Harvey, & Rentschler, 1991; Toet & Levi, 1992), we obtained measurements at both the fovea and 5° eccentricity in the inferior visual field.
2.1. Stimuli
Letters making up each trigram were chosen randomly from the 26 letters of the Times-Roman alphabet and each was digitally filtered with a set of seven raised cosine log filters (Alexander, Xie, & Derlacki, 1994; Chung et al., 2001, Chung, Legge, & Tjan, 2002a, Chung, Levi, Legge, & Tjan, 2002b; Peli, 1990), with peak object spatial frequencies ranging from 0.88 to 7.07 c/letter, in half-octave steps, and a bandwidth (full-width at half-height) of 1 octave. The filters were all radially symmetrical in the log-frequency domain. The equation of the filter is given by:
where ctr represents the spatial frequency corresponding to the peak amplitude of the filter (center frequency) and cut represents the frequency at which the amplitude of the filter drops to zero (cut-off frequency).
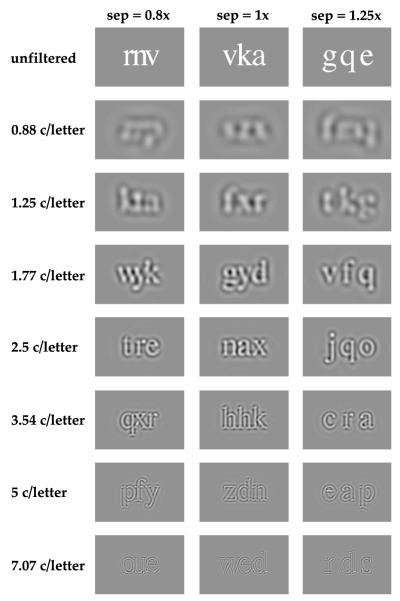
Details of generating the band-pass filtered letter stimuli are given elsewhere (Chung et al., 2001, 2002a). The contrast and letter frequency were the same for all three letters of a trigram on any given trial. Letter separation was defined as the center-to-center separation between adjacent letters, expressed as multiples of x-height (the height of the lowercase letter “x”) of the letter size that was being tested. Three letter separations were tested: 0.8, 1 and 1.25 times the x-height, in addition to the unflanked (single letter) condition. At small letter separations, portions of a letter might overlap with those of its adjacent letter, especially for letters filtered with lower spatial frequency filters. When this happened, the luminance values of the pixels corresponding to the overlapping region simply represented the linear sum of the luminance contributed by each letter, with a clipping at the maximum contrast of 1.0 when it was reached.2 At both eccentricities (fovea and 5°), four letter sizes were tested, ranging from 0.2 to 0.8 log units above the observer’s acuity at the respective eccentricity. Observer’s acuity was predetermined by measuring the letter size for identifying single letters. Stimuli were presented for 150 ms on each trial for all conditions in this study. Fig. 1 shows samples of trigrams composed of the filtered letters.
Fig. 1.
Samples of trigrams filtered by the seven raised-cosine log filters (center frequency ranging from 0.88 to 7.07 c/letter, in half-octave steps), as well as the unfiltered versions are shown for the three letter separations (nominal separations = 0.8, 1 and 1.25× x-height). All letters share the same relative contrast of 1 (maximum contrast after filtering without rescaling).
Given that our goal of this study was to determine if the visual system shifts its sensitivity toward a different spatial-frequency mechanism when identifying a letter flanked by other letters, compared with single letters, it is important that we treated the three letters of each trigram as one single entity, and measured the contrast sensitivity of our human observers to such stimuli that have restricted band of spatial frequencies. As such, the spatial frequencies and contrast of the flanking letters were always identical to those of the target letters. Because the magnitude of crowding increases with the contrast of the flankers (Chung et al., 2001; Kothe & Regan, 1990; Pelli et al., 2004; Simmers, Gray, McGraw, & Winn, 1999), potentially, our results could have been affected by having variable flanker contrast within the same block of trials. However, we believe that the effect was minimal. Pelli et al. (2004) argued that once the flanker becomes visible (i.e. above detection threshold), its effect soon saturates, producing its full effect on the signal. In our case, when the target was at contrast threshold for letter identification, the flankers, which had the same contrast as the target, were clearly visible.
2.2. Psychophysical procedures
We used the Method of Constant Stimuli to determine the contrast threshold that yielded 50% correct identification (after correction for guessing) of the target letters (middle letter of a trigram, or in the case of the unflanked condition, the singly presented letter). The letter size, letter frequency and letter separation remained constant within the same block of trials. Six letter contrast (20 trials each), spanning a range of 1 log unit in value, were tested randomly in each block of trials. Each datum reported in this paper represents the average of 2 or 3 replicates (threshold estimates) of the same condition.
2.3. Observers
Two observers with normal vision, one of the authors and a paid observer unaware of the purpose of the study, participated in the study. Both had corrected acuity of 20/16 or better in both eyes. Observer SC was an experienced psychophysical observer while observer RB had little experience with psychophysical experiments. Both observers practiced the task in this experiment until their performance on each condition stabilized before we began data collection for the experiment. Data collected during the practice phase are not reported in this paper. The experimental protocols were approved by the Institutional Review Board, and written informed consent was obtained from observer RB after the procedures of the experiment were explained and before the commencement of the practice phase.
3. Results
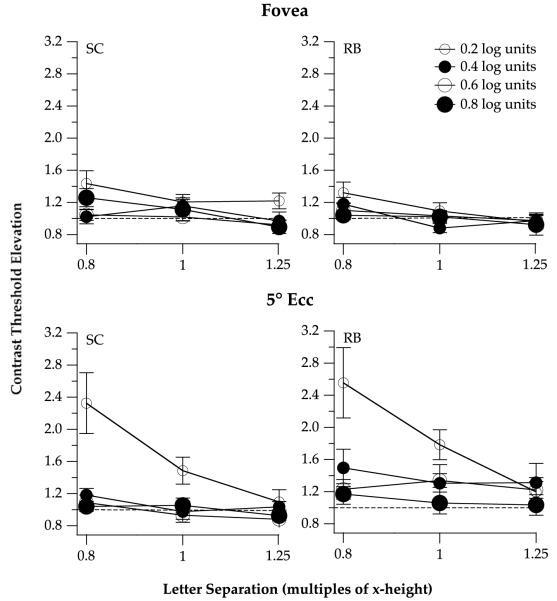
Contrast threshold elevation for identifying unfiltered letters is plotted as a function of letter separation, expressed as the multiples of the height of the letter x, with letter sizes as parameter in Fig. 2. Contrast threshold elevation is defined as the ratio of contrast thresholds for identifying flanked and unflanked (single) letters, and is used to represent the magnitude of crowding in this study. Consistent with previous reports (Bouma, 1970; Chung et al., 2001), crowding is maximal (threshold elevation is highest) for the smallest letter separation (0.8 times x-height) and decreases with larger letter separation.3 Crowding is also maximal for the smallest letter size (0.2 log units above acuity: Arditi, Knoblauch, & Grunwald, 1990; Chung, 2002; Yu, Cheung, Legge, & Chung, 2007) and stronger outside the fovea (5° eccentricity: Chung et al., 2001; Jacobs, 1979; Latham & Whitaker, 1996; Loomis, 1978; Toet & Levi, 1992). At 5° eccentricity, for the smallest letter size and at the smallest letter separation, contrast threshold elevation averaged 2.4, representing a 140% threshold elevation. At the fovea, the maximal contrast threshold elevation (at the smallest letter separation and for the smallest letter size) averaged 1.4, representing a 40% threshold elevation.
Fig. 2.
Contrast threshold elevation, ratio of the contrast threshold for identifying flanked to unflanked letters, is plotted as a function of letter separation (expressed as multiples of x-height), for the two observers. Data obtained at the fovea are given in the top panels and data obtained at 5° eccentricity are given in the bottom panels. In each panel, data are plotted for the four letter sizes (0.2–0.8 log units above acuity), coded by the size and color (white or black) of the symbols. A contrast threshold elevation of 1 (represented by the dashed line in each panel) implies a null effect of the flankers on the identification of the target letter, whereas a contrast threshold elevation greater than 1 implies crowding.
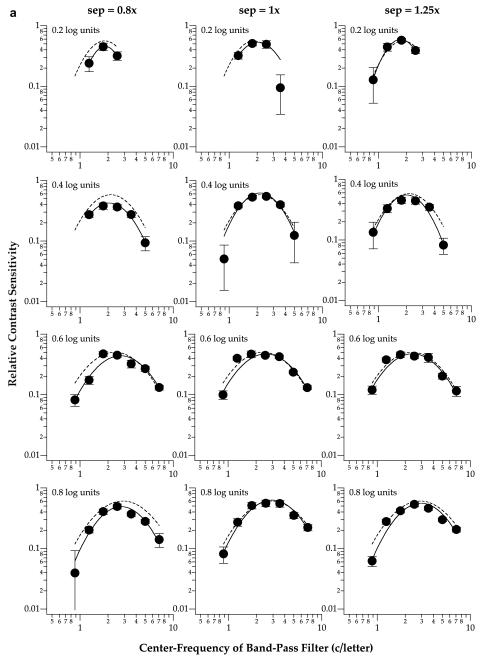
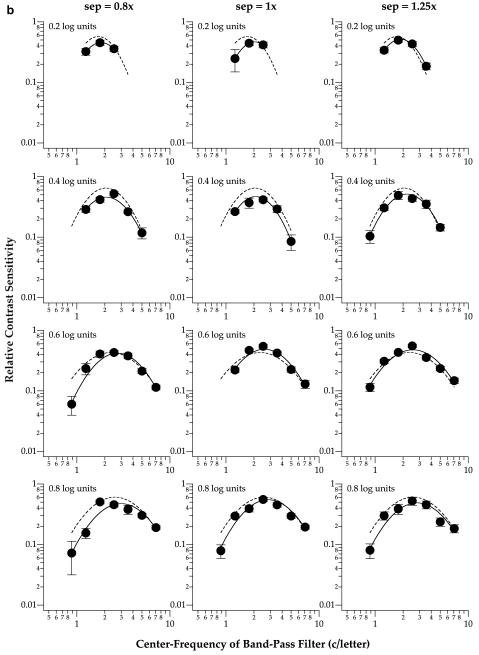
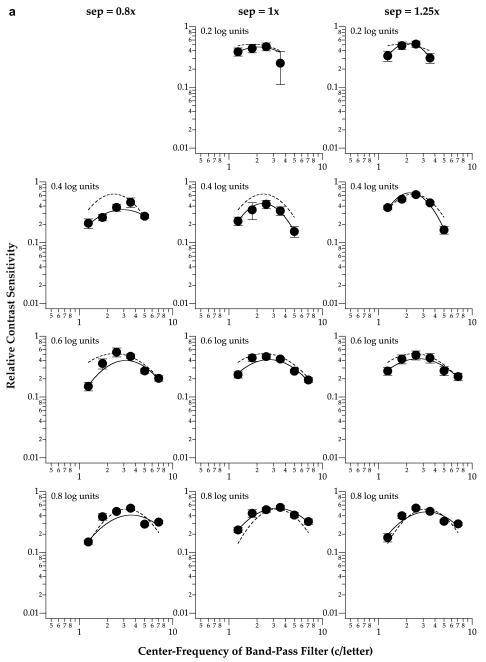
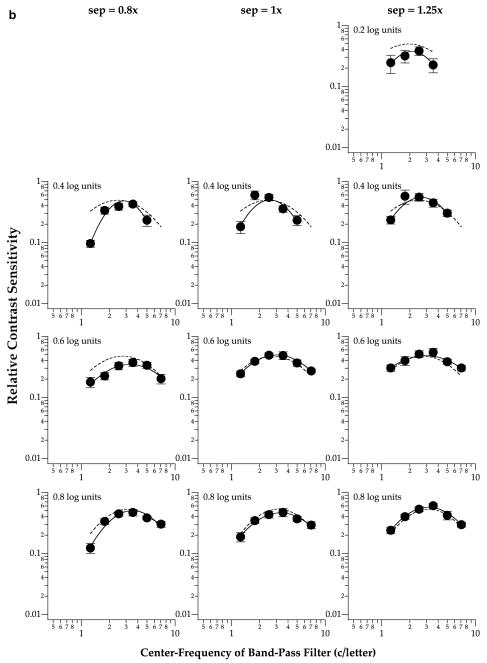
Fig. 2 establishes that substantial crowding could be obtained with our stimulus parameters, particularly for small letters and at small letter separations. To test our hypothesis that the visual system shifts its sensitivity toward a different spatial-frequency mechanism when identifying crowded letters, we compare the spatial-tuning functions for identifying flanked and unflanked letters. Spatial-tuning functions are constructed by plotting the relative contrast sensitivity for identifying the middle letter of trigrams (flanked conditions) or the single letter (unflanked conditions) as a function of the center frequency of band-pass filters. Figs. 3 and 4 show the spatial-tuning functions for the four letter sizes at the fovea (Fig. 3) and 5° eccentricity (Fig. 4). Each panel presents data obtained at one letter size and separation, with the dashed curve representing the spatial-tuning function (see below for details) obtained for the unflanked condition. Relative contrast sensitivity is derived from the ratio of contrast thresholds between filtered and unfiltered letters. For instance, a band with a relative contrast sensitivity of 0.5 means that the nominal threshold contrast of this band was twice as high as that of an unfiltered letter (Chung et al., 2002a, 2002b). In general, the relative contrast sensitivity vs. spatial frequency plot demonstrates spatial-tuning characteristics. To describe the spatial-tuning characteristics of the data, we fit each data-set using a parabolic curve, symmetrical on log—log coordinates, as given by the following equation:
where amplitude represents the full-height of the function, sf is spatial frequency, sfp is the peak tuning frequency and σ is the bandwidth of the function in octaves. This function is the same one used previously to describe the spatial-tuning characteristics of single letter identification (Chung et al., 2002a, 2002b).
Fig. 3.
Relative contrast sensitivity for identifying the middle letter of a trigram is plotted as a function of the center frequency of the band-pass filter used to generate the letters. Data shown were obtained from observers SC (a) and RB (b), for foveal viewing. Each column of panels plots the data obtained at one letter separation. Each row of panels plots the data obtained for one letter size. The solid line in each panel represents the best-fit parabolic curve (see text for details) to the data-set. For comparison, the best-fit parabolic curve to the unflanked condition is included in each panel as the dashed line. Error bars represent ±1 SEM.
Fig. 4.
Relative contrast sensitivity for identifying flanked letters is plotted as a function of the center frequency of the band-pass filter used to generate the letters for the same two observers SC (a) and RB (b), at 5° eccentricity. Details of the figure are as in Fig. 3.
Fig. 3 shows that at the fovea, the peak tuning frequency of the spatial-tuning functions, representing the spatial scale most sensitive for the task, are similar among the three letter separations (solid line in each panel) and the unflanked (dashed line in each panel) condition (repeated measures ANOVA: F(df=3,3) = 2.16, Greenhouse-Geisser adjusted p = 0.38). Similarly, the peak tuning frequencies obtained at 5° eccentricity (Fig. 4) are also similar among the three letter separations and the unflanked condition (repeated measures ANOVA: F(df=3,3) = 8.25, Greenhouse-Geisser adjusted p = 0.21). These statistical findings are not surprising given that most of the crowding effect occurred at the smallest letter separation only (Fig. 2). Based on this a priori reason, and our expectation that the peak tuning frequency at the smallest letter separation would shift toward a higher frequency when compared with the unflanked condition (Hess et al., 2000a, 2000b), we compared the peak tuning frequencies for the unflanked and the smallest letter separation (0.8×) using one-tailed paired t-tests. Results from the one-tailed paired t-tests showed that indeed, the peak tuning frequencies obtained at the smallest letter separation were higher than those for the unflanked conditions (fovea: t(df=7) = 2.18, p = 0.033; 5° eccentricity: t(df=5) = 4.70, p = 0.003). In other words, there was a shift in the peak tuning frequency at both the fovea and 5° eccentricity.
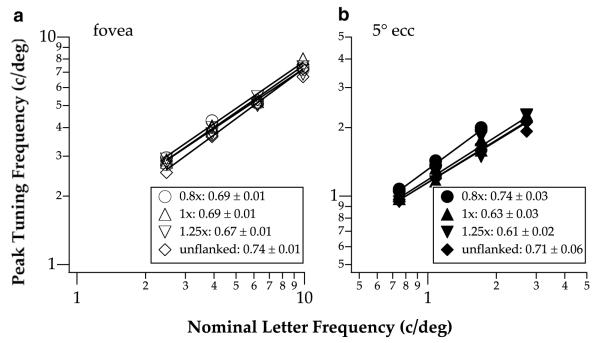
With respect to the effect of letter size (as opposed to letter separation), Figs. 3 and 4 show that the peak tuning frequency, in units of c/letter, progressively shifts toward higher frequency when letter size increases at both the fovea (repeated measures ANOVA: F(df=3,3) = 3556.6, Greenhouse-Geisser adjusted p = 0.011) and 5° eccentricity (repeated measures ANOVA: F(df=2,2) = 102.1, Greenhouse-Geisser adjusted p = 0.043.4) The dependence of peak tuning frequency on letter size, a representation of the degree of scale-invariance, is an important feature of letter identification (Chung et al., 2002a, 2002b; Majaj, Pelli, Kurshan, & Palomares, 2002), and is commonly represented by a plot of peak tuning frequency, expressed as retinal frequency in c/deg, as a function of letter size. The data can usually be described using a power function (a straight line fit to the data on log-log coordinates), where the exponent indicates the degree of scale invariance, i.e. whether we use the same or different spatial-frequency mechanisms to identify letters of different sizes. An exponent of 1 implies perfect size scaling, or size invariance. For single letter identification, the exponent is approximately 0.6–0.7 (Chung et al., 2002a, 2002b; Majaj et al., 2002). Here, we were interested in determining if the amount of the shift of spatial scale with letter size is similar for flanked and unflanked (single) letters. To do so, we plotted in Fig. 5 the peak tuning frequency, converted to retinal frequency in c/deg, as a function of letter size, expressed as nominal letter frequency,5 for the three letter separations, as well as the unflanked condition. Data were pooled from both observers (i.e., each datum represents the peak tuning frequency from one of the spatial-tuning function shown in Figs. 3 and 4). We fit each data-set obtained at a given letter separation with a power function. Consistent with previous studies (Chung et al., 2002a, 2002b; Majaj et al., 2002), the exponent of the power function for identifying single letters averages 0.67, suggesting that the frequency of the mechanism underlying single letter identification does not scale perfectly with letter size. The important issue here, however, is whether the function changes when observers identified letters flanked closely by other letters. Fig. 5 lists the exponent of the power function fit to each set of the data. Clearly, the exponent does not depend on eccentricity (ANOVA: F(df=1,3)=1.89, p = 0.26) or letter separation (ANOVA: F(df=3,3) = 0.80, p = 0.57). The significance of similar exponents for the unflanked and the flanked conditions will be addressed in Section 4.
Fig. 5.
Spatial frequency corresponding to the peak of the parabolic spatial-tuning functions given in Figs. 3 and 4 is plotted as a function of letter size, expressed as nominal letter frequency in c/deg, for the different letter separations at the fovea (a) and 5° eccentricity (b). Each line represents the power function (straight line on log-log coordinates) fit to data obtained at one letter separation (including the unflanked condition) and from both observers (data from the two observers for the same condition were plotted as separate data points). Exponents of these lines are summarized in the figure legend.
Although the exponents of the peak tuning frequency vs. letter size functions are similar among the unflanked condition and other various letter separations, these functions are not identical. The y-intercepts (or the vertical position of these functions), which represent the spatial scale used, are different between the fovea and 5° eccentricity (ANOVA: F(df=1,3) = 39.51, p = 0.008). Specifically, the functions are higher for the foveal data than for the 5° eccentricity data. With respect to letter separation, the function obtained at the smallest letter separation (0.8×) was displaced upward toward higher frequencies when compared with others, although there is no statistical difference in the intercept as a function of letter separation (ANOVA: F(df=3,3) = 3.03, p = 0.19). Again, this finding is consistent with the result shown in Fig. 2 that substantial crowding was found only at the smallest letter separation. Given that crowding was most prominent at the smallest letter separation, for the remaining of the paper, we will focus on the comparison between the unflanked condition and the smallest letter separation only.
To quantify the difference in the y-intercepts (i.e. the shift of spatial scale) of the peak tuning frequency vs. letter size functions obtained at the smallest letter separation and the unflanked condition, we refit each of these two data-sets with a power function with a fixed exponent — the average exponent values of the two conditions. The peak tuning frequency vs. letter size function for the smallest letter separation is found to be shifted toward a higher frequency, when compared with the unflanked condition, by 12% or 0.17 octaves at the fovea, and 14% or 0.19 octaves at 5° eccentricity. In both cases, the error estimates associated with the fitted intercepts show that the 95% confidence intervals do not overlap between the smallest letter separation and the unflanked conditions, implying that the difference in the vertical positions of the fitted functions for the two conditions is statistically significant.
3.1. CSF-ideal-observer analysis
Previously, we showed that a CSF-limited ideal-observer analysis could account for the human spatial-tuning properties for identifying single letters in central and peripheral vision (Chung et al., 2002a), and for amblyopic observers (Chung et al., 2002b). The CSF-ideal-observer is a model in which we combined the physical properties of the stimulus (in this case, information contained in the letter set) with the limited spatial resolution of a human observer. In this study, we applied the same analysis to test whether or not the shift in the spatial scale of analysis in identifying flanked letters could be accounted for by the physical properties of the stimuli and the CSF, which is a coarse characterization of a human observer’s spatial resolution. In other words, we want to determine if the shift in the spatial scale represents an optimal strategy given the specific stimuli and the observer’s spatial resolution at the test eccentricity. Details of the implementation of this analysis are given in Appendices A and B in Chung et al. (2002a). In brief, we computed the letter sensitivity functions (LSFs), representing the distribution of letter-identity information across spatial frequency, of an unflanked letter as well as one flanked by two other letters at the smallest letter separation (Fig. 6) using a Bayesian ideal observer (see Appendix A). Then we measured our human observers’ CSFs for detecting the presence of vertical sine-wave gratings at the fovea and 5° eccentricity. By multiplying the LSFs with the human observers’ CSFs, we derived the spatial tuning functions for an ideal observer limited by the human CSF (the CSF-ideal-observer), for different letter sizes and separations, as described in Chung et al. (2002a). The CSF-ideal-observer has no free parameter that may affect its spatial-tuning properties once the letter stimuli and the observer’s CSF are given.
Fig. 6.
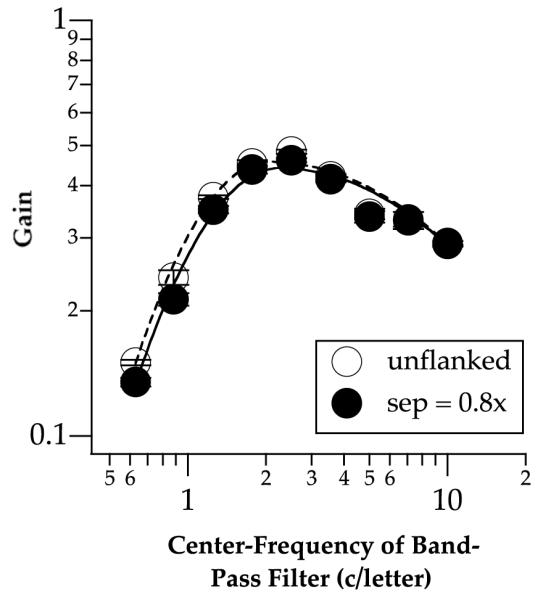
The ideal observer’s letter sensitivity functions (LSFs) for the unflanked (unfilled symbols) and the smallest letter separation (filled symbols). Error bars represent ±1 SEM.
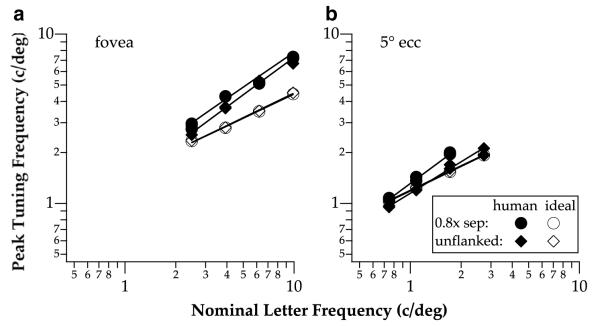
Fig. 7 compares the peak tuning frequency vs. letter size functions derived for the CSF-ideal-observer with those obtained empirically from our human observers, for the unflanked and the smallest letter separation conditions, at the fovea and 5° eccentricity. Consistent with our previous report (Chung et al., 2002a), for unflanked letters, the peak tuning frequency vs. letter size function of the CSF-ideal-observer closely matches that of human data outside the fovea, but not at the fovea, where human observers consistently tuned to a high spatial frequency for all letter sizes. More critically, unlike the results for the human observers, the peak tuning frequency vs. letter size functions of the CSF-ideal-observer obtained for the smallest letter separation are identical to those for the unflanked letters. In contrast, data from the human observers show a small vertical offset between the two functions. For all conditions, the peak frequency of the spatial tuning functions of the CSF-ideal-observer grows as the 0.5 power of letter size, compared with the 0.6–0.7 power for human observers. We shall return to the significance and interpretation of this finding in Section 4.
Fig. 7.
Peak tuning frequencies as a function of letter size are plotted for the CSF-ideal-observer (unfilled symbols), and compared with those from the human observers (filled symbols), for the smallest letter separation (circles) and the unflanked (diamonds) conditions.
4. Discussion
The primary goal of this study was to test if the human visual system shifts its sensitivity toward a different spatial-frequency mechanism for identifying letters flanked by other letters, compared with single letter. In general, the spatial frequency at which peak sensitivity occurs is higher at the smallest letter separation (i.e. the most crowded condition), than at other letter separations, or the unflanked condition. This shift occurs relatively uniformly across the range of letter sizes tested, with the magnitude of the shift measuring 0.17 octaves at the fovea and 0.19 octaves at 5° eccentricity.
Another key finding of our study is that the peak tuning frequency of the spatial-tuning functions grows as the 0.6–0.7 power of letter size, independent of letter separation and whether or not flanking letters were present. The relatively small shift in peak tuning frequency found for the smallest letter separation, and the similar exponents for all letter separations, are consistent with the view that we use similar spatial mechanisms for identifying letters regardless of whether or not flanking letters are present, and how far they are from the target letter. A small change in the spatial scale occurs only when the letter separation between the target and its flankers is very small, with the shift toward a higher spatial frequency.
The shift of human observers’ sensitivity toward a higher spatial frequency under the crowding condition is qualitatively consistent with the findings of Hess et al. (2000a, 2000b), but our magnitude is much smaller. In their studies, using Landolt C as stimuli, Hess et al reported a larger magnitude of the shift (∼0.5 octaves) at both the fovea and periphery (4–14° eccentricity). In our study, the magnitude of the shift was a mere 0.17–0.19 octaves. We believe that the difference in the magnitude of the shift is likely to be due to the different performance measurement. The studies of Hess et al. (2000a, 2000b) as well as our study, measured performance as a function of the spatial frequency of band-pass filtered letters to derive the spatial-tuning functions. In the studies of Hess et al, the performance measurement was percent-correct of identifying the orientation of the Landolt Cs. As shown in Figures 4, 6 and 7 in Hess et al. (2000b), the percent-correct performance reached 90–100% for the unflanked condition; whereas in the 1 bar width condition (edge-to-edge distance between the flanking bars and the Landolt C), peak performance fell to 40–60% correct. In our study, we measured contrast threshold that corresponded to a fixed 50% correct identification performance of the target letter. Therefore, the performance measurements in our study and that of Hess et al. (2000a, 2000b) are not entirely comparable.
Previously, we determined the classification images for locating the gap of a Landolt C, without and with flanking bars at different bar-to-C distances (Chung & Tjan, 2004). An analysis of the classification images in the spatial-frequency domain showed a small shift in the spatial-tuning of the classification images when the flanking bars touched the Landolt C (closest bar-to-C separation), compared with the unflanked condition. This finding is consistent with that of the present study in showing a small shift in the spatial scale of analysis during crowding, despite a sizeable magnitude of crowding.
4.1. CSF-ideal-observer
To account for the human’s properties of identifying single letters, we previously devised a parsimonious model that takes into account only the letter-identity information distributed across the spatial-frequency spectrum, and the human’s spatial resolution as represented by the contrast sensitivity function (CSF). This CSF-ideal-observer model well predicts human’s behavior, in terms of the peak tuning frequency, the bandwidth of the spatial tuning functions, and the relationship between the peak tuning frequency and letter size for unflanked letters at the fovea and the periphery. For unflanked letters, the only discrepancy between the model prediction and human behavior is that human observers’ peak tuning frequency at the fovea is higher than the model prediction by one-third of an octave. Here, we implemented the same model to determine if the human’s properties of identifying a flanked letter could be explained by the letter-identity information and the human CSF.
There are three interesting findings from the CSF-ideal-observer analysis. First, as shown in Fig. 6, the ideal letter sensitivity functions (LSFs) are virtually identical between the smallest separation (0.8× separation) and the unflanked condition at high spatial frequencies relative to letter size (≥3.54 c/letter), suggesting that the letter-identity information distributed across spatial frequencies of the target letter is not affected by the stimulus uncertainty due to the presence of flankers. At lower spatial frequencies (<3.54 c/letter), the unflanked condition yields slightly higher sensitivity than the smallest separation condition. Presumably, at these frequencies, information from the close-by flankers might encroach on the target letter, thus affecting even the ideal observer, which is supposed to be optimal in segmenting the stimuli (Tjan, 1996). Nevertheless, the slight differences in sensitivity at low frequencies between the unflanked and the smallest letter separation conditions are insuffcient to account for the change in the peak tuning frequency vs. letter size functions obtained for these two conditions (Fig. 7: unfilled circles and diamonds).
Second, Fig. 7 shows that the exponent of the peak tuning frequency vs. letter size functions are shallower for the CSF-ideal-observer model (unfilled symbols) than for human observers (filled symbols), at both the fovea and 5° eccentricity. A comparison of these data with our previous data on single letter identification (Chung et al., 2002a) reveals that the exponents predicted by the model are virtually identical, however, the exponent is steeper for the human observers’ data (∼0.7) in this study than in our previous study (∼0.6). Given that the experimental conditions for single letter identification are essentially identical between the two studies, we interpret the difference in the exponents as a result of random variations in the measurements. Even so, the exponents of the peak tuning frequency vs. letter size functions are still shallower for the CSF-ideal-observer model than for human observers. The shallower exponents imply that the shift in the peak tuning frequency is less dependent on letter size in the model than in human observers, especially for small letter sizes. This property is true regardless of whether identification was performed on a single letter, or a letter flanked by other letters. We, however, noted that despite its slightly shallower exponent, the CSF-ideal-observer matched remarkably well in absolute terms to the human data for unflanked letters at 5° eccentricity, consistent with the finding of Chung et al. (2002a). We do not yet know the underlying causes for the difference in scaling exponent between the model and human observers, or if additional factors need to be add to the model to account for this small discrepancy. The CSF-ideal-observer is an optimal observer under the assumptions that this observer’s internal noise is additive and Gaussian-distributed, and the observer’s spatial resolution is fully described by the observer’s CSF. Given these assumptions, our finding implies that when the letter size and separation are small, human observers use a mechanism with inappropriately high spatial-frequency tuning.
Third, we found a vertical shift in the peak tuning frequency vs. letter size functions between human observers and the CSF-ideal-observer model. At the fovea, these functions for the smallest letter separation and the unflanked condition are both shifted upward (toward higher tuning frequency) with respect to the model prediction. At 5° eccentricity, the function obtained for the smallest letter separation was also shifted upward with respect to the model prediction while the function for the unflanked condition was very similar to that predicted by the model. Previously, we have already shown that the peak tuning frequency vs. letter size function for single letter (unflanked) identification at the fovea is shifted upward with respect to the model (Chung et al., 2002a), therefore there is no surprise here for the same result. The interesting finding is the upward shift for the smallest letter separation (most crowded condition) at both the fovea and 5° eccentricity. As with the change in the slope of the peak tuning frequency vs. letter size functions, the upward shift implies that during crowding, human observers rely upon a spatial scale that is not the optimal one for performing the task, with respect to the assumptions of the ideal-observer model. We still do not understand why human observers prefer to do so. One explanation, as suggested by Hess et al. (2000b), is that a finer scale of analysis may help segregate the target from its flankers. Such an explanation is puzzling since by doing so, the mechanism would end up using a spatial frequency range that is suboptimal for the task.
4.2. Shifts in spatial-frequency tuning and crowding
Our data showed a shift towards a higher spatial frequency in the most crowded condition (the condition with the smallest letter size and separation) by 0.17 octaves at the fovea, and 0.19 octaves at 5° eccentricity. Given the results from the CSF-ideal-observer model, we argued that such a shift is suboptimal. One may therefore speculate that such an inappropriate shift in spatial tuning could be the root cause of crowding. We reported in Chung et al. (2002a) that the CSF-ideal-observer has an average spatial-frequency tuning bandwidth of about 2.5 octaves, bounded by parabolic fall-off in log-log coordinates. This bandwidth represents the limited range of spatial frequencies that are both informative given the stimuli and usable given a limited spatial resolution. With respect to this ideal-observer bandwidth, a shift of 0.2 octaves amounts to less than 10% decrease in peak contrast sensitivity, which is insuffcient to account for the observed threshold elevation at the smallest letter separation for either the fovea (40%) or at 5° eccentricity (140%). It is therefore highly unlikely that letter crowding is caused by the observed change in spatial-frequency tuning of the observer. In fact, from this perspective, the shift towards a higher and seemingly suboptimal peak tuning frequency during letter crowding is less puzzling: some yet-unknown factor(s) causes crowding, and the system tries to compensate for it by using a slightly higher spatial frequency band. Depending on what the root cause of crowding is, it may indeed be plausible that without shifting to high spatial frequencies, recognition performance can be worse.
5. Conclusions
We tested in this study whether or not the human visual system shifts its sensitivity toward a different spatial-frequency mechanism when identifying letters flanked by other letters. We found a shift only for the most crowded (smallest letter separation) condition. The shift, measures only 0.17–0.19 octaves toward a higher spatial frequency, is not found in the CSF-ideal-observer model, which uses the most optimal strategy to perform the given task. Although this finding implies that human observers rely upon a spatial scale that is not optimal for identifying letters during crowding, given the small shift in spatial scale, we conclude that the shift in spatial scale of analysis is unlikely to be a significant contributing factor of crowding.
Acknowledgments
This study was supported by NIH research grant R01-EY12810 (S.T.L.C.) and USC Zumberge Innovation Fund (B.S.T.).
Appendix A
Here we briefly describe the formulation of the ideal observer for identifying unflanked and flanked letters. This ideal observer is one of the two components of our CSF-ideal-observer model (the other component being the CSF of the human observer). For a more detailed formulation of the CSF-ideal-observer model, refer to Appendices A and B of Chung et al. (2002a).
To be maximally correct on average, the ideal observer model selects the response letter L that is most probable given the stimulus S (CSF-filtered letter plus noise). That is, select L such that the posterior probability Pr(L|S) is at its maximum. By Bayes rule, we can write
The prior probability Pr(L) is a constant since all letters occurred equally often in our experiments, and Pr(S) does not depend on L; therefore, to maximize the posterior probability Pr(L|S) with respect to L is the same as maximizing the likelihood Pr(S|L). In the case of a flanked letter, a response L is associated with 262 version of the stimulus, one for each possible pair of flankers. Let Lj denote the j-th noiseless template for the response L. Under Gaussian luminance noise, the likelihood of L can be computed as the sum of likelihoods of Lj (Tjan & Legge, 1998):
| A.1 |
Here, C is a normalization constant independent of L (and therefore irrelevant), and σ is the standard deviation of the internal additive white noise. N is 262 for the flanked conditions or 1 for the unflanked condition. The optimal decision rule for the CSF-ideal-observer is simply: choose the response L that maximizes Pr(S|L) as defined in (A.1).
Footnotes
CSF refers to the contrast sensitivity function. Details of the CSF-limited ideal-observer model will be given in later sections of the paper.
When letter parts of one letter overlapped those of its adjacent letter, the contrast became higher (linear summation) and could potentially affect observers’ letter identification performance. However, exactly how different letter features are being used for letter identification is still largely unknown and is currently being investigated. With respect to the purpose of this study, the threshold elevation could not be accounted for by the overlapping features because the overlapping features were present at the fovea as well, yet the threshold elevation was much lower at the fovea than at 5° eccentricity.
The threshold elevation was still above 1.0 for observer RB at 5° eccentricity, for a letter size of 0.4 log units and at the largest letter separation (1.25× x-height). This is likely to be due to the fact that the extent of letter crowding is approximately half the eccentricity (Bouma, 1970; Chung et al., 2001; Pelli et al., 2004). In this case, the letter size used was 1.45°, thus at a letter separation of 1.25× x-height, the distance between the target and its flanking letter was 1.8°, a value smaller than half the eccentricity. Therefore, it is not surprising that there was still some threshold elevation (crowding) at this letter separation for this letter size.
For the 5° eccentricity data, because we were unable to obtain measurements at small letter separations for the smallest letter size, data for the smallest letter sizes were not included in the repeated measures ANOVA to maintain a balance design. This might have affected the overall effect of letter size (when compared with the foveal data).
Nominal letter frequency is a measurement based on the letter size, assuming that a letter subtending 5 arcmin in height has an equivalent nominal letter frequency of 30 c/deg.
References
- Alexander KR, Xie W, Derlacki DJ. Spatial-frequency characteristics of letter identification. Journal of the Optical Society of America A. 1994;11:2375–2382. doi: 10.1364/josaa.11.002375. [DOI] [PubMed] [Google Scholar]
- Arditi A, Knoblauch K, Grunwald I. Reading with fixed and variable character pitch. Journal of the Optical Society of America A. 1990;7:2011–2015. doi: 10.1364/josaa.7.002011. [DOI] [PubMed] [Google Scholar]
- Bouma H. Interaction effects in parafoveal letter recognition. Nature. 1970;226:177–178. doi: 10.1038/226177a0. [DOI] [PubMed] [Google Scholar]
- Butler TW, Westheimer G. Interference with stereoscopic acuity: spatial, temporal, and disparity tuning. Vision Research. 1978;18:1387–1392. doi: 10.1016/0042-6989(78)90231-6. [DOI] [PubMed] [Google Scholar]
- Chung STL. The effect of letter spacing on reading speed in central and peripheral vision. Investigative Ophthalmology and Visual Science. 2002;43:1270–1276. [PubMed] [Google Scholar]
- Chung STL, Legge GE, Tjan BS. Spatial-frequency characteristics of letter identification in central and peripheral vision. Vision Research. 2002a;42:2137–2152. doi: 10.1016/s0042-6989(02)00092-5. [DOI] [PubMed] [Google Scholar]
- Chung STL, Levi DM, Legge GE. Spatial-frequency and contrast properties of crowding. Vision Research. 2001;41:1833–1y850. doi: 10.1016/s0042-6989(01)00071-2. [DOI] [PubMed] [Google Scholar]
- Chung STL, Levi DM, Legge GE, Tjan BS. Spatial-frequency properties of letter identification in amblyopia. Vision Research. 2002b;42:1571–1581. doi: 10.1016/s0042-6989(02)00065-2. [DOI] [PubMed] [Google Scholar]
- Chung STL, Mansfield JS, Legge GE. Psychophysics of reading. XVIII. The effect of print size on reading speed in normal peripheral vision. Vision Research. 1998;38:2949–2962. doi: 10.1016/s0042-6989(98)00072-8. [DOI] [PubMed] [Google Scholar]
- Chung STL, Tjan BS. Crowding: tuning to the wrong spatial-frequency channels? [Abstract] Journal of Vision. 2004;4(8):532a. http://journalofvision.org/4/8/532/.
- Faye EE. Clinical low vision. 2nd ed Little, Brown & Co.; Boston, Mass: 1984. [Google Scholar]
- Flom MC, Weymouth FW, Kahneman D. Visual resolution and spatial interaction. Journal of the Optical Society of America. 1963;53:1026–1032. doi: 10.1364/josa.53.001026. [DOI] [PubMed] [Google Scholar]
- He S, Cavanagh P, Intriligator J. Attentional resolution and the locus of visual awareness. Nature. 1996;383:334–337. doi: 10.1038/383334a0. [DOI] [PubMed] [Google Scholar]
- Hess RF, Dakin SC, Kapoor N. The foveal ‘crowding’ effect: physics or physiology? Vision Research. 2000a;40:365–370. doi: 10.1016/s0042-6989(99)00193-5. [DOI] [PubMed] [Google Scholar]
- Hess RF, Dakin SC, Kapoor N, Tewfik M. Contour interaction in fovea and periphery. Journal of the Optical Society of America, A. 2000b;17:1516–1524. doi: 10.1364/josaa.17.001516. [DOI] [PubMed] [Google Scholar]
- Jacobs RJ. Visual resolution and contour interaction in the fovea and periphery. Vision Research. 1979;19:1187–1195. doi: 10.1016/0042-6989(79)90183-4. [DOI] [PubMed] [Google Scholar]
- Kothe AC, Regan D. Crowding depends on contrast. Optometry and Vision Science. 1990;67:283–286. doi: 10.1097/00006324-199004000-00009. [DOI] [PubMed] [Google Scholar]
- Latham K, Whitaker D. A comparison of word recognition and reading performance in foveal and peripheral vision. Vision Research. 1996;36:2665–2674. doi: 10.1016/0042-6989(96)00022-3. [DOI] [PubMed] [Google Scholar]
- Leat SJ, Li W, Epp K. Crowding in central and eccentric vision: the effects of contour interaction and attention. Investigative Ophthalmology and Visual Science. 1999;40:504–512. [PubMed] [Google Scholar]
- Legge GE, Rubin GS, Pelli DG, Schleske MM. Psychophysics of reading — II. Low vision. Vision Research. 1985;25:253–266. doi: 10.1016/0042-6989(85)90118-x. [DOI] [PubMed] [Google Scholar]
- Levi DM, Hariharan S, Klein SA. Suppressive and facilitatory spatial interactions in peripheral vision: peripheral crowding is neither size invariant nor simple contrast masking. Journal of Vision. 2002b;2:167–177. doi: 10.1167/2.2.3. [DOI] [PubMed] [Google Scholar]
- Levi DM, Klein SA. Vernier acuity, crowding and amblyopia. Vision Research. 1985;25:979–991. doi: 10.1016/0042-6989(85)90208-1. [DOI] [PubMed] [Google Scholar]
- Levi DM, Klein SA, Aitsebaomo AP. Vernier acuity, crowding and cortical magnification. Vision Research. 1985;25:963–977. doi: 10.1016/0042-6989(85)90207-x. [DOI] [PubMed] [Google Scholar]
- Levi DM, Klein SA, Hariharan S. Suppressive and facilitatory spatial interactions in foveal vision: foveal crowding is simple contrast masking. Journal of Vision. 2002a;2:140–166. doi: 10.1167/2.2.2. [DOI] [PubMed] [Google Scholar]
- Loomis JM. Lateral masking in foveal and eccentric vision. Vision Research. 1978;18:335–338. doi: 10.1016/0042-6989(78)90168-2. [DOI] [PubMed] [Google Scholar]
- Majaj NJ, Pelli DG, Kurshan P, Palomares M. The role of spatial frequency channels in letter identification. Vision Research. 2002;42:1165–1184. doi: 10.1016/s0042-6989(02)00045-7. [DOI] [PubMed] [Google Scholar]
- Parkes L, Lund J, Angelucci A, Solomon JA, Morgan M. Compulsory averaging of crowded orientation signals in human vision. Nature Neuroscience. 2001;4:739–744. doi: 10.1038/89532. [DOI] [PubMed] [Google Scholar]
- Peli E. Contrast in complex images. Journal of the Optical Society of America A. 1990;7:2032–2040. doi: 10.1364/josaa.7.002032. [DOI] [PubMed] [Google Scholar]
- Pelli DG, Palomares M, Majaj NJ. Crowding is unlike ordinary masking: distinguishing feature integration from detection. Journal of Vision. 2004;4:1136–1169. doi: 10.1167/4.12.12. [DOI] [PubMed] [Google Scholar]
- Rubin GS. Predicting reading performance in low vision observers with age related maculopathy (ARM) In: Woo GC, editor. Low vision: Principles and applications. Springer-Verlag; New York: 1986. pp. 323–333. [Google Scholar]
- Simmers AJ, Gray LS, McGraw PV, Winn B. Contour interaction for high and low contrast optotypes in normal and amblyopic observers. Ophthalmic and Physiological Optics. 1999;19:253–260. [PubMed] [Google Scholar]
- Strasburger H, Harvey LO, Jr., Rentschler I. Contrast thresholds for identification of numeric characters in direct and eccentric view. Perception and Psychophysics. 1991;49:495–508. doi: 10.3758/bf03212183. [DOI] [PubMed] [Google Scholar]
- Takahashi ES. Doctoral thesis. University of California; Berkeley, California: 1967. Effects of flanking contours on visual resolution at foveal and near-foveal loci. [Google Scholar]
- Tjan BS. Doctoral thesis. University of Minneapolis; Minnesota: 1996. Ideal observer analysis of object recognition. [Google Scholar]
- Tjan BS, Chung STL, Oliensis J. Contour detour: how more could be less for crowding. Investigative Ophthalmology and Visual Science (Supplement) 2001;42:S515. [Google Scholar]
- Tjan BS, Legge GE. The viewpoint complexity of an object recognition task. Vision Research. 1998;38:2335–2350. doi: 10.1016/s0042-6989(97)00255-1. [DOI] [PubMed] [Google Scholar]
- Toet A, Levi DM. The two-dimensional shape of spatial interaction zones in the parafovea. Vision Research. 1992;32:1349–1357. doi: 10.1016/0042-6989(92)90227-a. [DOI] [PubMed] [Google Scholar]
- Townsend JT, Taylor SG, Brown DR. Lateral masking for letters with unlimited viewing time. Perception and Psychophysics. 1971;10:375–378. [Google Scholar]
- Tripathy SP, Cavanagh P. The extent of crowding in peripheral vision does not scale with target size. Vision Research. 2002;42:2357–2369. doi: 10.1016/s0042-6989(02)00197-9. [DOI] [PubMed] [Google Scholar]
- Westheimer G, Hauske G. Temporal and spatial interference with vernier acuity. Vision Research. 1975;15:1137–1141. doi: 10.1016/0042-6989(75)90012-7. [DOI] [PubMed] [Google Scholar]
- Westheimer G, Shimamura K, McKee SP. Interference with line-orientation sensitivity. Journal of the Optical Society of America. 1976;66:332–338. doi: 10.1364/josa.66.000332. [DOI] [PubMed] [Google Scholar]
- Yu D, Cheung S-H, Legge GE, Chung STL. Effect of letter spacing on visual span and reading speed. Journal of Vision. doi: 10.1167/7.2.2. (in press) [DOI] [PMC free article] [PubMed] [Google Scholar]


