Abstract
Impaired remyelination is critical to neuroinflammation in multiple sclerosis (MS), which causes chronic and relapsing neurological impairments. Recent studies revealed that immunomodulatory activity of statins in an experimental autoimmune encephalomyelitis (EAE) model of MS are via depletion of isoprenoids (farnesyl-pyrophosphate and geranylgeranyl-pyrophosphate) rather than cholesterol in immune cells. Additionally, we previously documented that lovastatin impedes demyelination and promotes myelin repair in treated EAE animals. To this end, we revealed the underlying mechanism of lovastatin-induced myelin repair in EAE using in vitro and in vivo approaches. Survival, proliferation (NG2+ and O4+) and terminal-differentiation (MBP+) of OPs was significantly increased in association with induction of a promyelinating milieu by lovastatin in mixed glial cultures stimulated with pro-inflammatory cytokines. Lovastatin-induced effects were reversed by co-treatment with mevalonolactone or geranylgeranyl-pyrophosphate, but not by farnesyl-pyrophosphate or cholesterol, suggesting that depletion of geranygeranyl-pyrophosphate is more critical than farnesyl-pyrophosphate in glial cells. These effects of lovastatin were mimicked by inhibitors of geranylgeranyl-transferase (GGTI-298) and down-stream effectors i.e., Rho-family functions (C3-exoenzyme) and Rho kinase (Y27632), but not by an inhibitor of farnesyl-transferase (FTI-277). Moreover, activities of Rho/Ras family GTPases were reduced by lovastatin in glial cells. Corresponding with these findings, EAE animals exhibiting demyelination (on peak clinical day; clinical scores ≥3.0) when treated with lovastatin and aforementioned agents validated these in vitro findings. Taken together, these data provide unprecedented evidence that—like immune cells—geranylgeranyl-pyrophosphate depletion thus inhibition of Rho family functions in glial cells by lovastatin promotes myelin repair in ameliorating EAE.
INTRODUCTION
Multiple sclerosis (MS) is a neurodegenerative disease characterized by inflammation, gliosis, demyelination, and loss of both neuronal axons and oligodendrocytes (OL) (Lassmann et al., 2001). The involvement of various cells types and metabolites in MS pathology suggests that myelin repair (remyelination) can occur in the acute inflammatory phase when damage may be reversed but it is impaired in the later stages (Zamvil and Steinman, 2003). Remyelination has been attributed to recruitment and differentiation of OL progenitors rather than to new process formation by previously myelinating OLs (Franklin, 2002). Currently, FDA-approved treatments for MS specifically target the inflammatory phase of the disease with the ultimate goal of reducing disease progression and limiting long-term disability (Rizvi and Agius, 2004). However, these treatments often do not target the neurodegenerative phase of the disease, including impaired remyelination. Two major probable causes of remyelination failure in MS lesions are the shortage or impaired recruitment of OL-progenitor (OP)s to areas of active demyelination and the presence of inhibitory proteins within the lesion which limit the differentiation of late OPs into myelin-forming OLs (Franklin, 2002).
The most compelling approaches to induce normal remyelination in MS are either by induction of endogenous OPs or by transplantation of exogenous neural stem cells (Keilhoff et al., 2006). It is now well accepted that endogenous OPs can be induced for remyelination in demyelinated lesions. In fact, OPs are reported to be present in some of the chronic MS lesions (Wolswijk, 2000), but appear to be quiescent. Moreover, new OPs produced within the subventricular zone from neuronal stem cells can migrate to participate in remyelination (Franklin and Blakemore, 1995). Transplantation of neural stem cells induced remyelination in the central nervous system (CNS) of animal models of acute demyelination (Cao et al., 2002). These cell-based therapies, however, differ in their ability to remyelinate CNS axons and are susceptible to graft rejection, the potential to form tumors and teratomas, the ability to modify the injury site, and a capacity for promoting functional recovery.
FDA-approved drugs such as copaxone and interferon-β are known to target the inflammatory phase of MS (Duda et al., 2000; Kraus et al., 2004), but their effects in neuroregeneration are not evident or are unknown. Recently, we and others have reported that statins can target the inflammatory phase of MS (Greenwood et al., 2003; Paintlia et al., 2004; Youssef et al., 2002). In addition, we documented that lovastatin impedes demyelination and augments myelin repair (remyelination) via preserving OPs in an experimental autoimmune encephalomyelitis (EAE) model of MS (Paintlia et al., 2005). Similarly, another lipophilic statin, simvastatin, has recently been shown to modulate OL process dynamics and survival via regulating isoprenoid biosynthesis (Miron et al., 2007). Statins act by inhibiting 3-hydroxy-3-methylglutaryl-CoA (HMG-CoA) reductase, the rate-limiting enzyme in endogenous cholesterol biosynthesis that blocks the synthesis of mevalonic acid. Besides reducing cholesterol biosynthesis, inhibition of mevalonate by statins also leads to a reduction in the synthesis of isoprenoids i.e., farnesyl-pyrophosphate (farnesyl-PP) and geranylgeranyl-pyrophosphate (geranylgeranyl-PP) (Alegret and Silvestre, 2006). These intermediates are involved in the posttranslational isoprenylation of several proteins (e.g., Ras, Rho, Rac) that modulate a variety of cellular processes including cellular signaling, proliferation and differentiation, (Nobes and Hall, 1995). In this study, we investigated the underlying mechanism of lovastatin-induced OP survival and induction of myelin repair/remyelination in ameliorating EAE using in vitro and in vivo approaches. Our findings revealed that the inhibition of the geranylgeranyl-PP arm of the mevalonate-pathway in glial cells by lovastatin is critical for induction of myelin repair in improving EAE animals.
MATERIALS AND METHODS
Chemicals and antibodies
Dulbecco’s modified eagle’s medium (DMEM; 4.5 g/L glucose), fetal bovine serum (FBS), and laminin-2 (merosin) were purchased from Invitrogen (Carlsbad, CA). Poly-D-lysine hydrobromide, Pertussis toxin, Mevalonolactone, Geranylgeranyl pyrophosphate ammonium salt (Geranylgeranyl-PP), Farnesyl pyrophosphate ammonium salt (Farnesyl-PP), farnesol and other buffer salts were purchased from Sigma-Aldrich (St. Louis, MO). Lovastatin, GGTI-298, FTI-277, L-744,832, Y27632, hydroxyfasudil, 5-bromo-2’-deoxyuridine (BrdU) and cholesterol were purchased from Calbiochem (La Jolla, CA). Membrane-permeable C3 exoenzyme was purchased from Cytoskeleton, Inc (Denver, CO). Recombinant rat IFN-γ, TNF-α, and IL-1β proteins were purchased from R&D Systems (Minneapolis, MN). Rabbit anti-RhoA, -cdc42/Rac1 and -Ras antibodies were purchased from Cell Signaling Technology (Danvers, MA). Rabbit anti-NG2 chondroitin sulfate proteoglycan (NG2), mouse anti- oligodendrocyte markers i.e., O4, and rabbit anti-β-actin antibodies were purchased from Chemicon International (Temecula, CA). The murine anti-mouse myelin basic protein (MBP, clone 1: 129-138) antibodies were from Serotec (Raleigh, NC). Rabbit anti-glial fibrilary acidic protein (GFAP antibodies were purchased from DAKO (Carpentaria, CA) and anti-ciliary neurotrophic factor (CNTF) antibodies were purchased from GeneTex Inc (San Antonio, TX). Mouse IgG and rabbit polyclonal IgG (control primary antibodies) and secondary antibodies such as Texas red-X-conjugated goat anti-mouse IgG (for NG2, and MBP) and fluorescein (FITC)-conjugated goat anti-rabbit IgG (for GFAP and O4) were from Vector Laboratory (Burlingame, CA). ECL-detecting reagents and nitrocellulose membranes were purchased from Amersham Biosciences (Arlington Heights, IL).
Treatment of mixed glial cell cultures
Rat cortical glial cell cultures were generated from P1–P2 SD rat brains (Charles River, Wilmington, MA) as described earlier (Paintlia et al., 2005). Primary OPs, microglia and astrocytes were purified using standard methods as described earlier (Paintlia et al., 2005). Mixed glial cells were plated on glass chamber slides or in Petri plates precoated with poly-D-lysine at a density of 2 × 10⁵ cells/ml. After 24 h, fresh DMEM without FBS was changed and cells were treated with lovastatin, inhibitors, or concurrent treatment with lovastatin and different compounds for another 24 h prior to stimulation with a cocktail of inflammatory cytokines (Cyt-Mix; TNF-α, IL-1β, and IFN-γ, each 10 ng/ml). Proliferation of OPs was determined at days in vitro (DIV) 3 (NG2+) and DIV5 (O4+) as per treatment with various compounds. For differentiation of developing OPs into myelin-forming OLs, mixed glial cultures at DIV4 (enriched in O4 population of oligodendrocyte-lineage) were treated with compounds followed by Cyt-Mix exposure and analyzed at DIV7 (MBP).
Fluorescence-activated cell sorting (FACS) analysis
Mixed glial cells or purified OPs were harvested after treatment by incubation in Trypsin-EDTA (1X) solution (Invitrogen, Grand Island, NY). Cells were washed and re-suspended in PBS containing 3% BSA and incubated with 10 μg/ml non-immune mouse IgG for 15 min. After washing, cells were incubated with 2 μg/ml mouse anti-NG2+-IgG or anti-O4+ IgM and/or anti-MBP antibodies diluted 1:100 in PBS containing 3% BSA at 4 °C for 30 min. After washing, cells were incubated at 4 °C for 30 min with PE-conjugated goat anti-rabbit IgG (Santa Cruz Biotech Inc, Santa Cruz, CA) for NG2+ and FITC-conjugated goat anti-mouse IgM (Sigma, Saint Louis, MO) for O4+, and MBP diluted at 1:200 and measured in a FL-1 channel (530 ± 15 nm band pass filter). Cells were washed before analysis on a FACScalibur flow cytometer (BD Biosciences, San Jose, CA) operating with the Cell Quest™ software. Dead cells and debris were excluded from the analysis by gating living cells from size/structure density plots. Data were displayed on a logarithmic scale with increasing fluorescence intensity (data not shown). Each histogram plot was recorded for at least 10,000 gated events. Percentage positive cells were plotted in each group.
Collection of cellular cytosolic and membranal fractions
Cytosolic and membranal fractions of treated cells were collected by standard methods. Briefly, cells were harvested after 24 h treatment of purified glial cells with lovastatin and other compounds including 30 min of Cyt-Mix-stimulation wherever indicated and washed twice in PBS. Then cells were suspended in permeabilization buffer, containing 20 mM HEPES, pH 7.2, 135 mM KCl, 5 mM NaCO3, 5.6 mM D-glucose, 2 mM ATP, 4 mM MgCl2, 5 mM EGTA, 1.5 mM CaCl2 (corresponding to 40 nM free Ca2+) and 8 μM digitonin, was added, followed by a further incubation period of 10–60 min on ice. Afterwards, cells were pelleted by centrifugation at 15,000×g for 1 min. Supernatant and pellet fractions were used as cytosolic and membranal fractions, respectively, to determine the distribution of Rho and Ras family GTPases using SDS-PAGE and Western blotting methods.
Immunocytochemistry & Immunohistochemistry
For single-label immunocytochemistry, standard methodology was used. Briefly, slides were blocked with a serum-PBS solution and incubated with appropriately diluted primary antibody (1:100) at 4 °C overnight followed by washing and incubation with secondary antibodies. For double-labeling for immunocytochemistry and immunohistochemistry, slides or sections were incubated simultaneously with both types of primary antibodies after blocking with a serum-PBS solution at 4 °C overnight as described above. Then, secondary antibodies for the appropriate marker (anti-IgG conjugated with FITC or anti-IgM conjugated with Texas red) were used. Slides were also incubated with Texas red-conjugated IgM and FITC-conjugated IgG without primary antibody as negative controls and an appropriate mouse IgG and rabbit polyclonal IgG were used as isotype controls. After thorough washings, slides were mounted with aqueous mounting media (Vectashield, Vector Labs; Burlingame, CA). Slides were analyzed by immunofluorescence microscopy (Olympus BX-60, Optronics; Goleta, CA) with an Olympus digital camera (Optronics; Goleta, CA) using a dual-band pass filter. Images were captured and processed using Adobe Photoshop 7.0 and were adjusted using the brightness and contrast level to enhance image clarity. Total numbers of positive cells/field were determined by manual counting in 10 fields of a slide from similarly treated slides (n= 5) in a blinded fashion.
Animals
Female Lewis rats (225–300g) were purchased from Harlan Laboratory (Harlan, IN) and housed in the animal care facility of the Medical University of South Carolina (MUSC), throughout the experiment and provided with food and water ad lib. All experiments were performed according to the National Institutes of Health Guidelines for the Care and Use of Laboratory Animals (NIH publication number 80-23, revised 1985) and were approved by the MUSC Animal Care and Use Committee.
EAE induction and clinical evaluation
The procedures used for the induction of EAE have been described previously (Paintlia et al., 2005; Paintlia et al., 2004). In brief, female rats received a subcutaneous injection in the hind limb footpads of guinea pig MBP (35 μg; Sigma) in 0.1 ml of PBS emulsified in an equal volume of CFA supplemented with 2 mg/ml of mycobacterium tuberculosis H37Ra (Difco, Detroit, MI) on days 0 and 7. Immediately thereafter and again 24 h later, rats received pertussis toxin (200 ng, interaperitoneally, ip) in 0.1 ml PBS. Pertussis toxin was administered to animals as per a standardized protocol in our laboratory for induction of EAE (Paintlia et al., 2004). Similarly, control animals received an injection (subcutaneous) of PBS and CFA emulsion in the hind limb footpads on days 0 and 7. Individual animals were observed daily and clinical scores were assessed by an experimentally blinded investigator on a 0–5 scale: 0, no clinical disease; 1.0, piloerection; 2.0, loss in tail tonicity; 3.0, hind-leg paralysis; 4.0, paraplegia, and 5.0, moribund or dead.
In vivo drug treatments
Lovastatin (4 mg/ml) was suspended in 0.8% ethanol/0.6 N NaOH and PBS, adjusted to pH 7.4. Likewise, mevalonolactone (5 mg/ml) was suspended in PBS; farnesol (5 mg/ml) was suspended in PBS; GGTI-298 (0.50 mg/ml) was suspended in ethanol and diluted in PBS; L-744,832 was suspended in physiological saline (pH 7.4, 30 mg/kg); and hydroxyfasudil (1 mg/ml) was dissolved in 100 μl of DMSO and diluted in PBS. Drugs were administered (ip) at the specified dose once daily using an insulin syringe (1 ml). A treatment was started when a clinical score of ≥3.0 (on the 12th day post immunization; 12th dpi) was reached in EAE animals. Drug treatment was continued to the end of the experiment. EAE animals without drug treatment received an injection (ip) of vehicle (0.8% ethanol in PBS), once daily. Control animals received an injection (ip) of vehicle or drug (drug controls), once daily. One set of animals were sacrificed on peak clinical day (12th dpi) and the remaining animals were kept for 23rd dpi at which time serum and spinal cord (SC) tissues were collected.
Real-time PCR analysis
Lumbar SC tissues were carefully processed for RNA isolation. Total RNA was purified using ‘TRIZOL’ reagent according to the manufacturer’s protocol as described previously (Paintlia et al., 2005). Single-stranded cDNA was synthesized from the total RNA from each group of animals using a superscript pre-amplification system for first-strand cDNA synthesis (Life Technologies Gaithersburg, MD) as described earlier (Paintlia et al., 2005). Real-time PCR was performed using iCycler iQ Real-Time PCR Detection System (Bio-Rad Lab, Hercules CA). The primer sets used were designed and purchased from Integrated DNA Technologies (Coralville, IA, USA). The primer sequences are: for GAPDH, forward primer (FP): 5’-cctacccccaatgtatccgttgtg-3’and reverse primer (RP): 5’-ggaggaatgggagttgctgttgaa-3’; 18S rRNA, FP: 5’-ccagagcgaaagcatttgccaaga-3’ and RP: 5’-tcggcatcgtttatggtcggaact-3’, α-platelet derived growth factor receptor (PDGF-αR), FP: 5’-cagacattgaccctgttccagagg-3’ and RP: 5’-gaatctatgccaatatcatccatc-3’; sex determining region Y-box 10 (SOX10), FP: 5’-tctacacggccatctctgacc-3’ and RP: 5’-gtcgtatatactggctgttcccagtg-3’, MBP, FP: 5’-ctctggcaaggactcacacac-3’ and RP: 5’-tctgctgagggacaggcctctc-3; Myelin transcription factor 1-like (MyT1-L), FP: 5’-ggtgcccaagagcaaagaa-3’ and RP: 5’-atcacagccaggtaccgga-3’, insulin-like growth factor-1 (IGF-1), FP: 5’-tgacatgcccaagactcagaagga-3’ and RP: 5’-ggttgctcaagcagcaaaggatct-3’, platelet derived growth factor (PDGF), FP: 5’-gatgccttggagacaaacctgaca-3’ and RP: 5’-atacttctcttcctgcgaatgggc-3’, and CNTF, FP: cttcaagagctctcacagtg-3’ and RP: tgcttatctttggccccataat-3’. IQ™ SYBR Green Supermix was purchased from Bio-Rad (Hercules CA). Thermal cycling conditions were as follows: activation of iTaq™ DNA polymerase at 95 °C for 10 min, followed by 35 cycles of amplification at 95 °C for 30 s and 55–57.5 °C for 1 min. The specificity of real-time PCR for each analysis was determined by melting curve analysis of amplified product (PCR machine was programmed for melting curve analysis at the end of each run). Then, normalized expression data were generated by dividing the amount of target gene concentration with the amount of reference gene (GAPDH). The detection threshold was set above the mean baseline fluorescence determined by the first 20 cycles. Amplification reactions in which the fluorescence increased above the threshold were defined as positive. A standard curve for each template was generated using a serial dilution of the template (cDNA). The quantities of target gene expression were normalized to the corresponding GAPDH or 18S rRNA expression in test samples.
Immunoblotting
SC tissues were homogenized in ice-cold lysis buffer (50 mm Tris-HCl, pH 7.4, containing 50 mM NaCl, 1mM EDTA, 0.5 mM EGTA, 10% glycerol, and protease inhibitor mixture) and sample protein concentration was determined with Bradford reagent (Bio-Rad, Hercules, CA). SDS-PAGE, Western blotting, and immunoblotting were performed as described previously (Paintlia et al., 2005). Autoradiograph of immunoblots was generated using enhanced chemiluminescence detection kits (Amersham Biosciences, Arlington Heights, IL).
Analysis of PDGF-αβ and IGF-1 in serum samples by ELISA
Serum samples were collected from animals on 0 day of treatment (12th dpi) and on remission (23rd dpi) following treatment with drug. Levels of PDGF-αβ and IGF-1 were determined in serum by ELISA based assay kits (R&D systems, Minneapolis, MN). Data are computed as protein concentration per ml and plotted.
Cholesterol extraction and amplex red assay
Total cholesterol was extracted from cells using a standard protocol. Briefly, mixed glial cells (104–105) were suspended in 500 μl of isopropanol and sonicated with a microprobe for 10 s. After centrifugation for 15 min at 800 × g the clear supernatant was decanted, and an aliquot was taken for cholesterol analysis using Amplex Red Cholesterol Assay kit (Invitrogen, Carlsbad, CA). The supernatant was evaporated to dryness and resuspended in 1× reaction buffer. The pellet was suspended in 0.1 M sodium hydroxide (100 ml) and used for protein determination. Total cholesterol was measured in the lipid extract and in serum samples using the Amplex Red Cholesterol Assay kit (Invitrogen, Carlsbad, CA).
Statistical analysis
Using the Student’s unpaired t-test and ANOVA (Student-Newman-Keuls to compare all pairs of columns), p values were determined for the respective experiment from three identical experiments using GraphPad software (GraphPad Software Inc. San Diego, CA USA). The criterion for statistical significance was p<0.05.
RESULTS
Inhibition of the mevalonate-pathway by lovastatin rescues OPs from inflammatory insult and promotes their proliferation in mixed glial cultures
To assess the effect of lovastatin-induced reduction of isoprenoid and cholesterol in glial cells on myelin repair/remyelination in ameliorating EAE (Paintlia et al., 2005), we investigated the effect of inhibiting or supplementing metabolites involved in the mevalonate-pathway (Fig. 1A). Similar to conditions observed within the EAE/MS brain (Paintlia et al., 2004; Wolswijk, 2000), proinflammatory cytokines are reported to be detrimental to oligodendrocytes in vitro (Druzhyna et al., 2005; Molina-Holgado et al., 2001). Lovastatin treatment rescued OPs from the deleterious effect of proinflammatory cytokines (Cyt-Mix: IFN-γ, TNF-α, and IL-1β; 10 ng/ml each) and promoted their proliferation as revealed by NG2+/BrdU+ cell counting in mixed glial cultures (Fig. 1B–C). FACS analysis indicated a significant increase in NG2+ and O4+ cells at DIV3 and DIV5, respectively, in lovastatin and Cyt-Mix-treated mixed glial cultures compared with those treated with Cyt-Mix only (Fig. 1D). In addition, PDGF-αR transcripts were increased significantly in lovastatin and Cyt-Mix-treated mixed glial cells compared with those treated with Cyt-Mix only (Fig. 1E). Co-treatment of Cyt-Mix glial cultures with lovastatin and mevalonolactone (0.25 mM) eliminated the observed effect of lovastatin in Cyt-Mix-stimulated mixed glial cultures (Fig. 1C–E). The dose of mevalonolactone used in the study to abolish the effect of lovastatin rescues isoprenoid function, whereas cholesterol synthesis remains insignificant (Cole et al., 2005). Of note, mixed glial cells treated with lovastatin only had significantly greater OP proliferation compared with untreated ones, but this was reversed by mevalonolactone co-treatment as demonstrated by NG2+/brdU+ counting (Fig. 1C), NG2+ and O4+ typing (Fig. 1D), and, PDGF-αR transcript level (Fig. 1E). Of note, experimental dose of lovastatin either 1 μM or 2 μM did not alter total cholesterol in cells (Fig. 1F). Lactate dehydrogenase release and trypan blue exclusion assays revealed significant cell death in mixed glial cultures stimulated with Cyt-Mix compared with controls or lovastatin and Cyt-Mix-treated cells as an indicator of loss of developing OPs under inflammatory disease conditions (data not shown).
Figure 1. Inhibition of HMG-CoA reductase by lovastatin rescues OPs and promotes their proliferation in mixed glial cultures stimulated with pro-inflammatory cytokines.
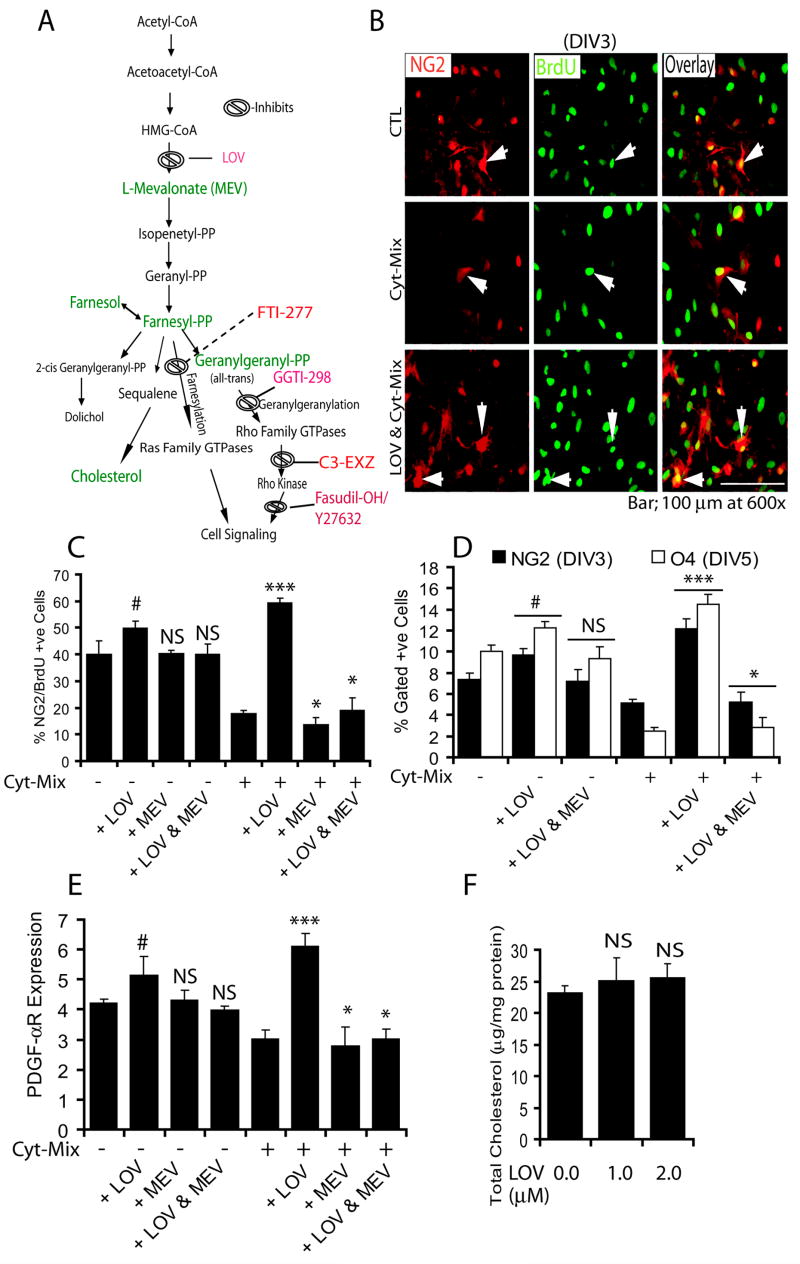
(A) The mevalonate-pathway. Metabolites (green) and drug inhibitors (red) are used in the study. Cortical mixed glial cells were seeded in 100-mm Petri plates and glass slide chambers (2 × 10⁵ cells/ml). After 24 h, lovastatin (LOV; 2 μM) and mevalonolactone (MEV; 0.25 mM) treatments were performed for the next 24 h followed by treatment with a cocktail of cytokines (Cyt-Mix). To measure LOV-induced survival and proliferation of OPs, mixed glial cells were flushed with BrdU (20 μM) 24 h prior to immunocytochemistry. (B) Representative field of the slide depicts NG2+/BrdU+ in controls (upper panel), Cyt-Mix-treated (middle panel), and LOV & Cyt-Mix-treated (lower panel) mixed glial cell cultures. Arrow indicates double-labeled OPs with anti-NG2 and -BrdU antibodies as an indicator of OP proliferation. (C) Plot depicts percentage of NG2+/BrdU+ OP counts at DIV3 determined by manual counting of 10 fields/slide (n = 5). (D) Likewise, FACS analysis shows percentage of gated NG2+ and O4+ cells in similarly treated mixed glial cultures at DIV3 and DIV5, respectively. (E) Real-time PCR analysis shows level of PDGF-αR transcripts in similarly treated mixed glial cultures at DIV3. (F) Plot depicts level of total cholesterol in LOV-treated mixed glial cells at DIV5. Results in plots are expressed as Mean ± SD of three identical experiments. Statistical significance is shown as ***p<0.01 and * (non-significant) versus Cyt-Mix, and # p<0.05 and NS (non-significant) versus untreated controls (CTL).
Inhibition of the geranylgeranyl-PP arm of the mevalonate-pathway by lovastatin promotes proliferation of OPs in mixed glial cultures
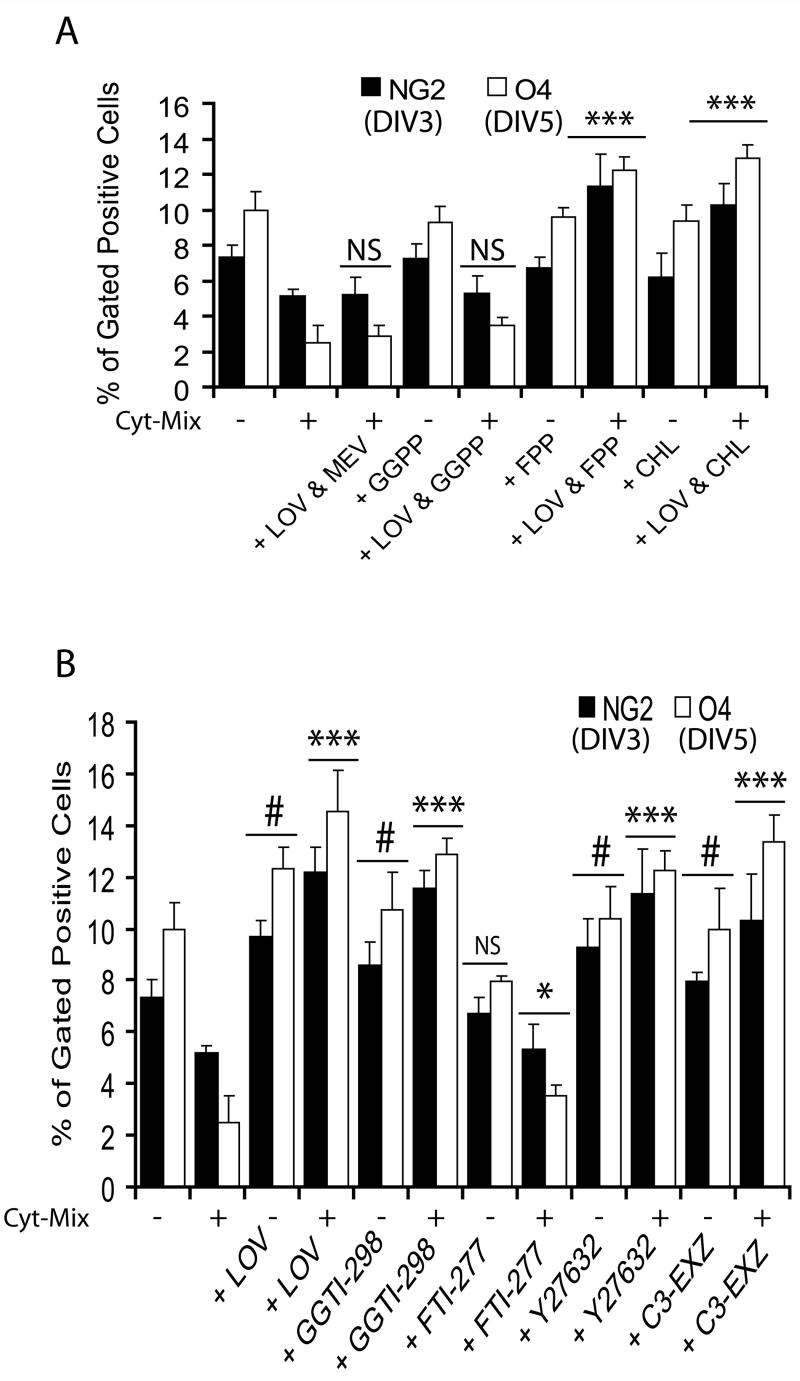
Inhibition of HMG-CoA reductase (thus mevalonate synthesis) by statins prevents the synthesis of isoprenoids, which are important for isoprenylation of certain cell signaling proteins and cell growth (Liao, 2002; Nobes and Hall, 1995). Thus, to investigate the underlying mechanism of survival and proliferation of OPs by lovastatin against inflammatory insult, we treated Cyt-Mix-stimulated mixed glial cells with lovastatin and either isoprenoids (farnesyl-PP and all-trans geranylgeranyl-PP) or exogenous cholesterol in combination or individually. Similar to mevalonolactone, co-treatment of lovastatin with all-trans geranylgeranyl-PP also reversed lovastatin’s effect in Cyt-Mix-stimulated mixed glial cultures as showed by quantification of NG2+ and O4+ populations (Fig. 2A). This effect of lovastatin in Cyt-Mix-stimulated mixed glial cultures was not reversed by either farnesyl-PP or exogenous cholesterol co-treatment (Fig. 2A). These findings were further validated by using inhibitors of isoprenoid transferases and down-stream effectors of Rho family GTPases (Fig. 1A). Interestingly, the observed effect of lovastatin in Cyt-Mix-stimulated mixed glial cultures was mimicked by GGTI-298, C3 exoenzyme (inhibitor of Rho family functions), and Y27632 (ROCK inhibitor), but not by FTI-277 (Fig. 2B). Similar to lovastatin alone, GGTI-298, Y27632, and C3 exoenzyme also significantly increased NG2+ and O4+ populations in treated mixed glial cells not stimulated with Cyt-Mix compared to controls, but not with FTI-277 (Fig. 2B).
Figure 2. Inhibition of the geranylgeranyl-PP arm of the mevalonate-pathway by lovastatin protects OPs from inflammatory insult.
Mixed glial cells were cultured in 100-mm Petri plates (2 × 10⁵ cells/ml) for 24 h. Then cells were treated with lovastatin (LOV; 2 μM) and various metabolites of the mevalonate-pathway i.e., geranylgeranyl-PP (GGPP; 5 μM), farnesyl-PP (FPP; 5 μM) and cholesterol (CHL; 10 μM) including inhibitors i.e., GGTI-298 (5 μM), FTI-277 (5 μM) and Y27632 (5 μM), and 40 μg/ml of C3-exoenzyme (C3-EXZ;) for the next 24 h followed by treatment with Cyt-Mix. (A) Plot depicts percentage of gated NG2+ and O4+ OPs at DIV3 and DIV5, respectively, in treated mixed glial cultures determined by FACS. (B) Likewise, plot depicts percentage of gated NG2+ and O4+ OPs at DIV3 and DIV5, respectively, in treated mixed glial cells determined by FACS. Results in plots are expressed as Mean ± SD of three identical experiments. Statistical significance is shown as ***p<0.01 and * (non-significant) versus Cyt-Mix, and # p<0.05 and NS (non-significant) versus untreated controls.
Inhibition of the geranylgeranyl-PP arm of the mevalonate-pathway by lovastatin promotes terminal differentiation of OPs in mixed glial cultures stimulated with Cyt-Mix
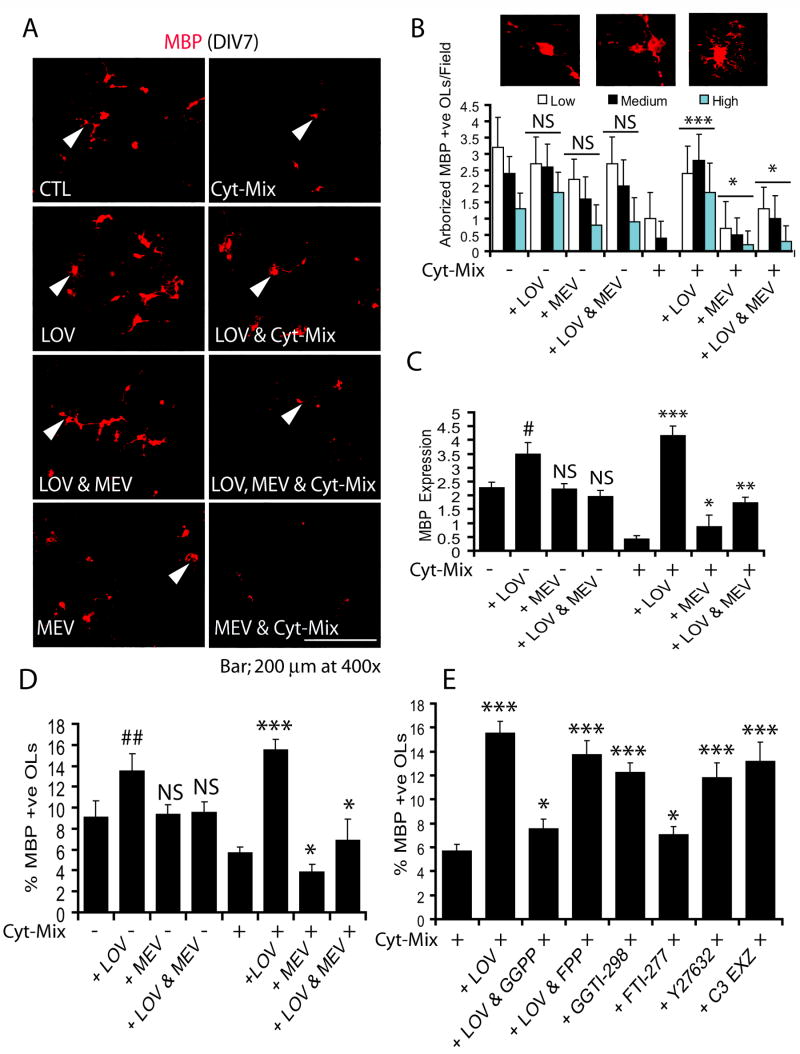
Since late-OPs (O4+) are reported to be more vulnerable to inflammatory insult than pre-OPs as observed in a periventricular model (Back et al., 2002), we next treated mixed glial cultures grown until DIV4 to determine the effect of inflammatory insult on differentiating late-OPs. FACS analysis revealed an increase in the population of O4+ cells of OL-lineage in mixed glial cultures at DIV4 (data not shown). Cyt-Mix-stimulation inhibited the survival and differentiation of OPs into myelin-forming OLs as depicted by a decrease in the number of MBP+ OLs (Fig. 3A). The degree of OL differentiation was scored as low, medium, or high depending upon the complexity of OL extensions (processes) as shown in Fig. 3B (inset). There was a significant increase in both survival and differentiation of OLs as revealed by degree of arborization in lovastatin and Cyt-Mix-treated mixed glial cells compared to those treated with Cyt-Mix only (Fig. 3A-B). MBP transcripts were also significantly increased in lovastatin and Cyt-Mix-stimulated mixed glial cells compared to those treated with Cyt-Mix only (Fig. 3C). Likewise, the population of MBP+ OLs was increased significantly in lovastatin and Cyt-Mix-treated mixed glial cells compared to those treated with Cyt-Mix only (Fig. 3D). Co-treatment of lovastatin with mevalonolactone reversed the effect of lovastatin in Cyt-Mix-stimulated mixed glial cultures (Fig. 3A–D). Interestingly, mixed glial cells treated with lovastatin alone had significantly greater OL differentiation as shown by degree of arborization (Fig. 3B), level of MBP transcripts (Fig. 3C), and the population of MBP+ OLs (Fig. 3D) as compared to controls. This was reversed by mevalonolactone co-treatment (Fig. 3A–D). Similar to mevalonolactone, co-treatment of lovastatin with all-trans geranylgeranyl-PP reversed the effect of lovastatin in Cyt-Mix-stimulated mixed glial cells, but that reversal was not evident with farnesyl-PP co-treatment (Fig. 3E). Lovastatin-induced effects were mimicked by treatment of Cyt-Mix-stimulated mixed glial cells with GGTI-298, Y27632, and C3 exoenzyme (Fig. 3E). No significant change in the MBP+ cell population was observed in Cyt-Mix-stimulated mixed glial cells treated or untreated with FTI-277 (Fig. 3E).
Figure 3. Inhibition of the geranylgeranyl-PP arm of the mevalonate-pathway by lovastatin promotes the differentiation of OPs in mixed glial cultured stimulated with Cyt-Mix.
Mixed glial cell were cultured in 100-mm Petri plates and glass chamber slides (2 × 10⁵ cells/ml). After 24 h, cells were treated with LOV and various metabolites of the mevalonate-pathway i.e., 0.25 mM of mevalonolactone (MEV), 5 μM of each geranylgeranyl-PP and farnesyl-PP including inhibitors i.e., 5 μM of each GGTI-298, FTI-277 and Y27632, and 40 μg/ml of C3 exoenzyme (C3-EXZ) for the next 24 h followed by treatment with Cyt-Mix. (A) Representative field of the slide depicts MBP+ OLs in the treated mixed glial cells determined by immunocytochemistry. Arrowheads depict differentiating OLs with variable complexities of processes. (B) Plot depicts number of MBP+ OLs/10 fields with different degrees of arborization, scored as low, medium, and high in treated mixed glial cells. (C) Plot depicts MBP mRNA expression in similarly treated mixed glial cells at DIV5. Plots depict percentage of gated MBP+ OLs in treated mixed glial cells at DIV7 (D & E). Results in plots are expressed as Mean ± SD of three identical experiments. Statistical significance is shown as * (non-significant), ** p<0.05, *** p<0.01 versus Cyt-Mix, and # p<0.05, ## p< 0.01 and NS (non-significant) versus untreated controls (CTL).
Inhibition of the geranylgeranyl-PP arm of the mevalonate-pathway by lovastatin induces expression of neurotrophic factors in Cyt-Mix-stimulated mixed glial cell
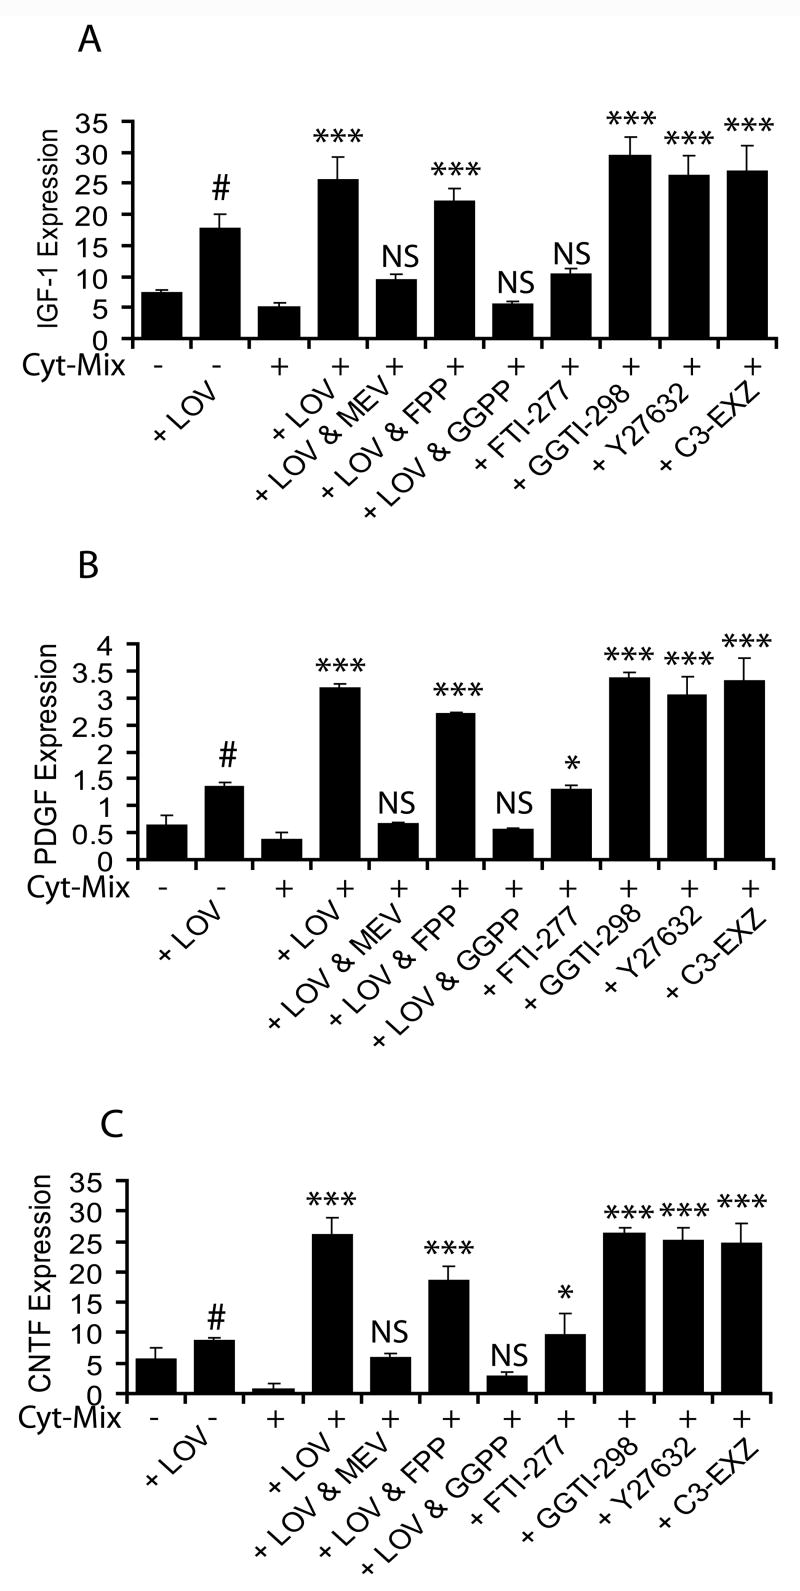
Because, multifunctional neurotrophic growth factors secreted by brain glial cells are known to promote the proliferation, differentiation, and survival of OPs (Barres et al., 1993), we next measured transcripts of some of the reference neurotrophic factors i.e., IGF-1, PDGF and CNTF in similarly treated mixed glial cells. Cyt-Mix-stimulated mixed glial cultures had significantly less IGF-1 (4A), PDGF (4B), and CNTF (4C) transcripts compared to controls. In contrast, lovastatin treatment significantly blocked this decrease in neurotrophic factor transcripts in Cyt-Mix-stimulated mixed glial cells and that was reversed by mevalonolactone co-treatment (Fig. 4A-C). Likewise, lovastatin’s effect was reversed by co-treatment with all-trans geranylgeranyl-PP in Cyt-Mix-stimulated mixed glial cultures, but this did not occur with farnesyl-PP (Fig 4A-C) or exogenous cholesterol (data not shown). Furthermore, lovastatin induced effects were mimicked by GGTI-298, Y27632 and C3 exoenzyme in Cyt-Mix-stimulated mixed glial cultures, but not by FTI-277 (Fig. 4A-C).
Figure 4. Inhibition of the geranylgeranyl-PP arm of the mevalonate-pathway by lovastatin induces expression of neurotrophic factors in mixed glial cultures stimulated with Cyt-Mix.
Mixed glial cells were cultured in 100-mm Petri plates (2 × 10⁵ cells/ml). After 24 h, cultures were treated with LOV and various metabolites of the mevalonate-pathway i.e., 0.25 mM of mevalonolactone (MEV), and 5 μM of each geranylgeranyl-PP (GGPP) and farnesyl-PP (FPP) including inhibitors i.e., 5 μM of each GGTI-298, FTI-277 and Y27632, and 40 μg/ml of C3 exoenzyme (C3-EXZ) for the next 24 h followed by treatment with Cyt-Mix. Quantitative real-time PCR shows level of IGF-1 (A), PDGF (B) and CNTF (C) transcripts in treated mixed glial cells at DIV4. Results in plots are expressed as Mean ± SD of three identical experiments. Statistical significance is shown as * p<0.05, *** p<0.001, and NS (non significant) versus Cyt-Mix, and # p<0.05 versus untreated controls.
Lovastatin alters the activity of Rho/Ras family GTPase in glial cells
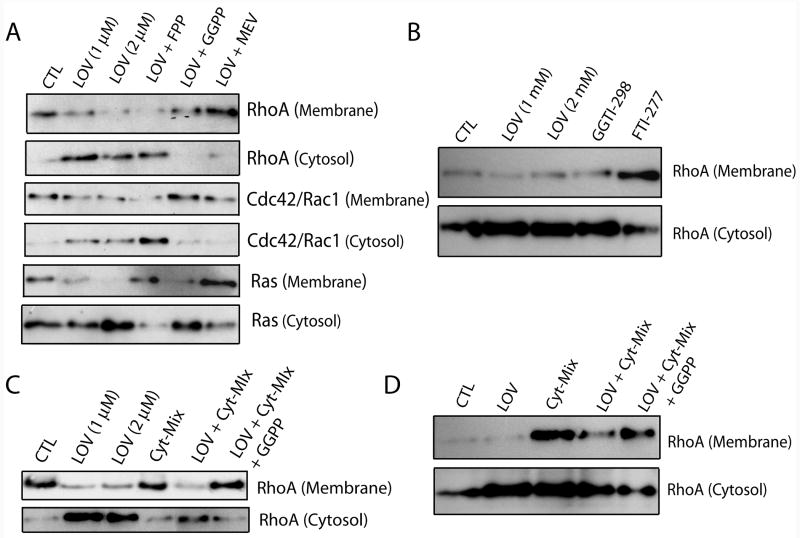
Next we determined the activity of Rho/Ras family GTPases in lovastatin-treated glial cells by analyzing the distribution of Rho/Ras family GTPases in the cytosolic/membranal fractions. As expected, lovastatin treatment altered the membranal/cytoplasmic distribution of RhoA, cdc42/Rac1 and Ras small GTPases in primary OLs (Fig. 5A). Lovastatin induced an increase in the accumulation of RhoA and cdc42/Rac1 GTPases in the cytoplasm than membrane of treated primary OLs and that was reversed by both mevalonolactone and all-trans geranylgeranyl-PP co-treatment, but not by farnesyl-PP (Fig. 5A). In support to these findings, lovastatin induced effect on RhoA distribution in primary OLs was mimicked by both GGTI-298, but not by FTI-277 (Fig. 5B). Furthermore, lovastatin induced an increase in the accumulation of Ras GTPases in the cytoplasm than membrane in treated primary OLs and that was reversed by farnesyl-PP and mevalonolactone, but not by all-trans geranylgeranyl-PP (Fig. 5A). Similarly treated primary microglia (Fig. 5C) and astrocytes (Fig. 5D) also showed a decrease in the RhoA activity as indicated by its accumulation in the cytoplasm. Importantly, lovastatin treatment reversed the increase in RhoA activity in both Cyt-Mix-stimulated microglia (Fig. 5C) and astrocytes (Fig. 5D).
Figure 5. Lovastatin alters distribution of Rho/Ras family GTPases in treated glial cells.
Purified glial cells (OPs, microglia and astrocytes) were cultured in 100-mm Petri plates (2 × 10⁵ cells/ml). After 24 h, cultures were treated with LOV and various metabolites of the mevalonate-pathway i.e., 0.25 mM of mevalonolactone (MEV), and 5 μM of each geranylgeranyl-PP (GGPP) and farnesyl-PP (FPP) including inhibitors i.e., 5 μM of each GGTI-298 and FTI-277 for next 24 h and harvested or stimulated with Cyt-Mix for next 30 min (astrocytes and microglia). Cellular cytosolic and membranal fractions were collected and used for detection of Rho/Ras family GTPases as described under materials and methods. Autoradiographs depict RhoA, cdc42/Rac1 and Ras distribution in the cytosolic and membranal fractions of treated primary OLs (A-B). Autoradiograph depicts distribution of RhoA in the cytosolic and membranal fractions of treated microglia (C) and astrocytes (D). Data is representative of two independent experiments.
Inhibition of HMG-CoA reductase by lovastatin impedes demyelination and promotes myelin repair in recovering EAE animals
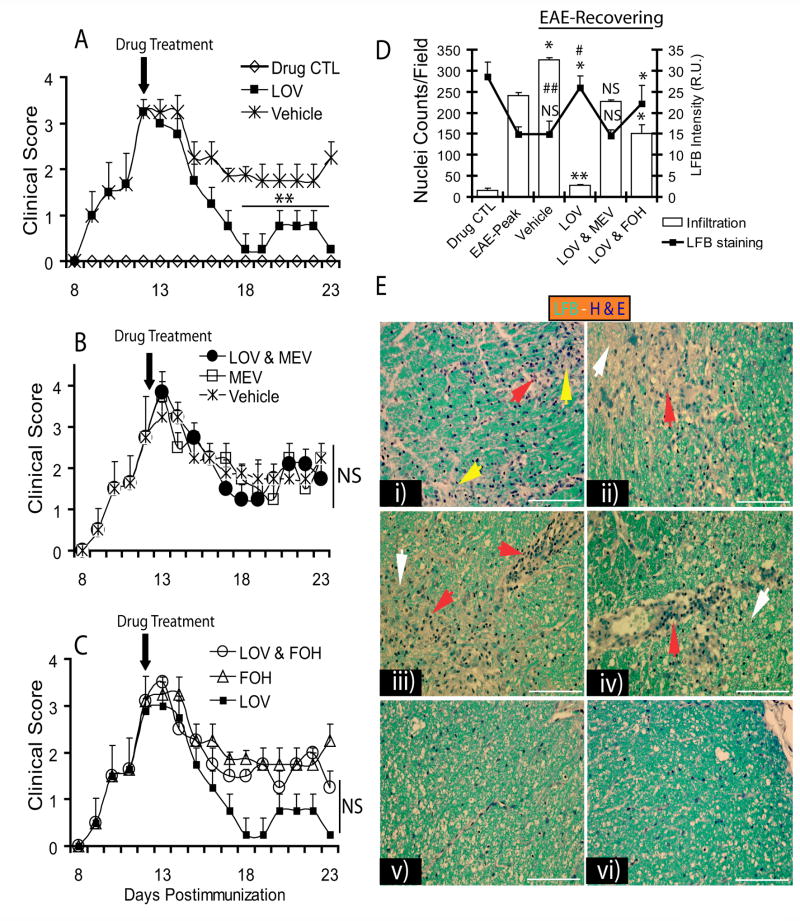
Parallel to in vitro findings, EAE disease was induced in Lewis female rats and treated with lovastatin alone or co-treated with intermediate products of the mevalonate-pathway i.e., mevalonolactone and farnesol (alcohol precursor to farnesyl-PP, Fig. 1A). Treatment began in established EAE animals on peak clinical day (12th dpi) with clinical scores ≥3.0. In this EAE model, we previously showed severe cellular infiltration and demyelination in the lumbar region of the SC on peak clinical day (Paintlia et al., 2005). Interestingly, lovastatin (2 mg/kg) treatment—when initiated on the peak clinical day—markedly reduced the clinical symptoms of the disease and improved recovery as evidenced by clinical examination (Fig. 6A). Co-administration of lovastatin and mevalonolactone (5 mg/kg, ip) abolished the observed effect of lovastatin in recovering EAE animals (Fig. 6B). Co-administration of farnesol with lovastatin did not reverse the effect of lovastatin in recovering EAE animals (Fig. 6C). Of note, EAE animals treated with mevalonolactone or farnesol alone had more exacerbated EAE than that observed in vehicle-treated animals as evidenced by clinical examination (Fig. 6B and C). Histological examination by luxol fast blue (LFB) and hematoxylin and eosin (H&E) staining revealed a significant reduction in demyelination and cellular infiltration in the lateral funiculi of SC of lovastatin-treated recovering EAE animals compared with EAE animals on peak clinical day (Fig. 6D and E). In addition, LFB staining revealed an induction of myelin repair as reflected by light blue-stained regions with lesser infiltration (white arrowhead) in the lateral funiculi of SC of recovering EAE animals (Fig. 6E). Co-administration of lovastatin with mevalonolactone reversed the observed effect of lovastatin in recovering EAE animals (Fig. 6D and E). In contrast, farnesol when co-treated with lovastatin did not reverse the observed effect of lovastatin in recovering EAE animals (Fig. 6D and E). Of note, EAE animals treated with either mevalonolactone or farnesol had more severe cellular infiltration and demyelination compared with those animals treated with vehicle (data not shown). Importantly, cellular infiltration was still greater in the SC of recovering vehicle-treated EAE animals compared with animals observed on peak clinical day (Fig. 6D and E), irrespective of clinical scores (Fig. 6A).
Figure 6. Inhibition of HMG-CoA reductase by lovastatin impedes cellular infiltration and demyelination in ameliorating EAE.
Female Lewis rats (n = 5/group) were immunized with guinea pig MBP (35 μg/ rat) emulsified in CFA to established EAE. Treatment with lovastatin (LOV, 2 mg/kg, ip) or mevalonolactone (MEV, 5 mg/kg, ip) and/or farnesol (FOH, 5 mg/kg, ip) individually or in combination began on peak clinical day of the disease (12th dpi, clinical score ≥3.0). On the 23rd dpi, animals were sacrificed to collect SC from the lumber region from representative rats (n = 3) in each group. Plots depict disease clinical scores in EAE animals treated with LOV or vehicle (A), MEV or LOV & MEV (B) and FOH or LOV & FOH (C). (D) Plot depicts cellular infiltration and demyelination by H&E and LFB staining in the SC of treated recovering EAE animals. (E) Representative fields of lateral funiclui of SC of EAE animals stained with LFB-H&E dyes i.e., i) EAE on peak clinical day (12th dpi), recovering EAE animals treated with vehicle (ii), LOV & MEV (iii), LOV & FOH (iv) and LOV (v) on 23rd dpi including drug CTL (vi) on 23rd dpi. Arrowhead depicts cellular infiltration (red), demyelination (yellow) and myelin repair/remyelination (white). Data in plots are expressed as Mean ± SD of three identical experiments. Statistical significance is shown as ** p<0.01 and NS (non-significant) versus vehicle treated recovering EAE (A-C), and * p< 0.05, ** p< 0.01 and NS (non-significant) versus EAE-Peak and # (non-significant) and ## p<0.01 versus drug CTL (D).
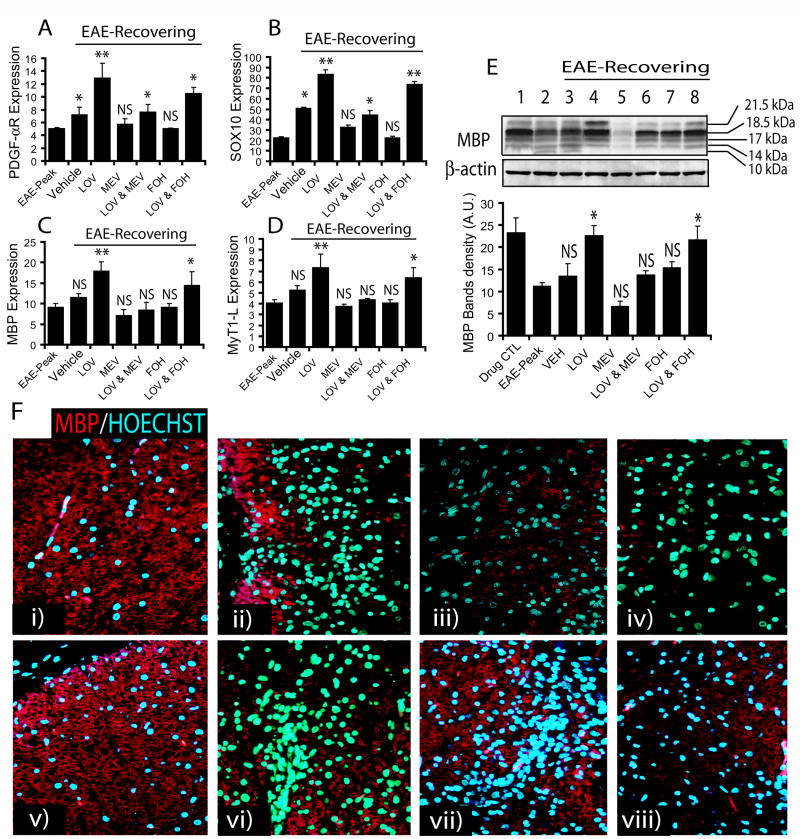
To further assess the induction of myelin repair by lovastatin in recovering EAE animals, we measured transcript for myelin proteins in the SC. Transcripts for OP-specific proteins (i.e., PDGF-αR and SOX10, a transcription factor), and OL-specific proteins (i.e., MBP and MyT1-L, a transcription factor) were significantly increased by lovastatin treatment compared with vehicle-treated recovering EAE animals (Fig. 7A–D). In contrast, co-administration of mevalonolactone with lovastatin reversed the effect of lovastatin in recovering EAE animals (Fig. 7A–D). Co-administration of farnesol with lovastatin did not reverse the effects of lovastatin in recovering EAE animals (Fig. 7A–D). Of note, vehicle-treated recovering EAE animals had an increased transcripts for OP-specific proteins, but not for OL-specific proteins when compared with that observed on peak clinical day (Fig. 6A–D), which is an indicative of induction of myelin repair. Furthermore, immunoblotting revealed a significant increase in the level of MBP isoforms in the SC of lovastatin-treated recovering EAE animals compared to those animals treated with vehicle (Fig. 7E). This lovastatin mediated increase in level of MBP was reversed by mevalonolactone co-administration, but not with farnesol in recovering EAE animals (Fig. 7E). An observed reduction of the level of all isoforms of MBP on peak clinical day reflects myelin degradation (demyelination) and its normalization during recovery phase of EAE upon treatment reflects myelin repair (remyelination) as compared to controls (Fig. 7E). This lovastatin-mediated increase in myelin repair in recovering EAE animals was further supported by immunohistochemical analysis of the SC with anti-MBP antibodies (Fig. 7F). Importantly, the restoration of SC white matter integrity by lovastatin in recovering EAE animals was associated with the attenuation of cellular infiltration (Fig. 7F). This effect of lovastatin was reversed by co-treatment of lovastatin with mevalonolactone, but not by farnesol (Fig. 7F).
Figure 7. Inhibition of HMG-CoA reductase by lovastatin promotes myelin-repair in ameliorating EAE.
SC tissues of treated EAE animals were processed for RNA isolation followed by cDNA synthesis using standard protocols described under Materials & Methods. Plots depict the level of transcripts for PDGF-αR (A), SOX10 (B), MBP (C) and MyT1-L (D) in the SC of recovering EAE animals determined by quantitative real-time PCR. (E) A representative autoradiograph of immunoblotting depicts MBP isoforms including reference protein β-actin in the SC of EAE animals (inset) and plot depicts densitometeric analysis of total MBP level normalized with β-actin. (F) Representative fields of the lateral funiculi of SC from recovering EAE animals immunostained with anti-MBP antibodies and counterstained with Hoechst dye for nuclei i.e., drug CTL (i), EAE on peak clinical day (ii) and recovering EAE treated with vehicle (iii), MEV (iv), LOV (v), LOV & MEV (vi), FOH (vii) and LOV & FOH (viii). Results in plots are expressed as average n = 3/group in three identical experiments. Statistical significance is shown as * p<0.05, **p<0.01, and NS (non-significant) versus vehicle treated EAE animals and # (non-significant) and ##p<0.05 versus EAE-Peak.
Treatment with either GGTI-298 or hydroxylfasudil, but not with L-744,832 mimicked lovastatin-induced effects in recovering EAE animals
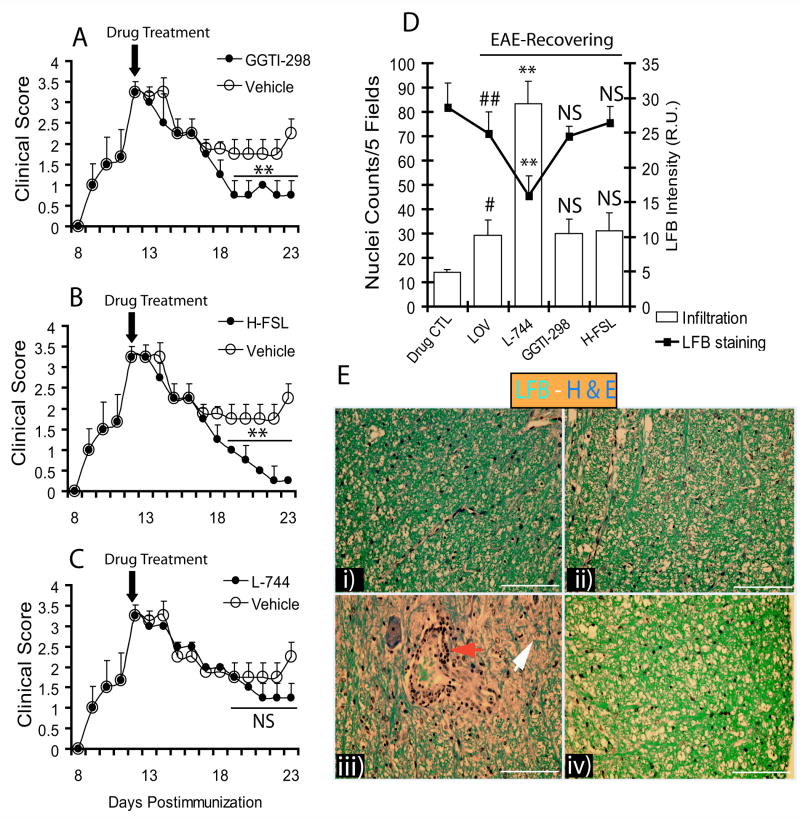
To further evaluate our in vitro findings, that lovastatin-induced effects in Cyt-Mix-exposed mixed glial cultures are a result of geranylgeranyl-PP depletion in glial cells, we treated EAE animals exhibiting demyelination with GGTI-298, L-744,832 (farnesyl transferase inhibitor), and hydroxylfasudil (ROCK inhibitor). Evaluation of the therapeutic efficacy of these inhibitors with regard to the augmentation of myelin repair was also an interest of the study. Interestingly, both GGTI-298 and hydroxyfasudil mimicked the observed effect of lovastatin in recovering EAE animals when treatment began on the 12th dpi as shown by a significant decrease in clinical scores compared to those treated with vehicle (Fig. 8A and B). EAE animals treated with L-744,832 (30 mg/kg), however, had no significant difference in clinical scores compared with those treated with vehicle (Fig. 8C). The dose of L-744,832 used in the study was similar to that used by other investigators (Dunn et al., 2006). Histological examination with LFB and H&E staining showed a reduction in cellular infiltration and demyelination in the lateral funiculi of SC from GGTI-298- and hydroxylfasudil-treated recovering EAE animals, which was similar to lovastatin-treated EAE animals (Fig. 8D and E). In addition, myelin repair was enhanced by GGTI-298 or hydroxylfasudil—similar to lovastatin—as indicated by LFB staining of lateral funiculi of SC (Fig. 8D and E). Moreover, L-744-treated EAE animals showed more cellular infiltration and demyelination in the SC when compared with lovastatin-treated EAE animals (Fig. 8D and E).
Figure 8. Lovastatin limits cellular infiltration and promotes myelin repair/remyelination via inhibition of geranylgeranyl-PP arm of mevalonate-pathway.
Female Lewis rats (n = 5/group) were immunized with guinea pig MBP (35 μg/ rat) emulsified in CFA to establish EAE. Treatment with vehicle, GGTI-298 (0.50 mg/kg, ip), L744,832 (L-744; 30 mg/kg) and/or hydroxyfasudil (H-FSL; 1 mg/kg, ip) began on peak clinical day (12th dpi; clinical score ≥ 3.0). On the 23rd dpi, animals were sacrificed to collect SC from the lumber region of three representative animals in each group. Plots depict clinical scores of disease in recovering EAE animals treated with GGTI-298 (A), H-FSL (B), and L-744 (C) and compared with vehicle. Plot depicts inhibition of cellular infiltration and demyelination in treated EAE animals determined by H&E and LFB staining (D). (E) Representative fields of the LFB-H&E stained lateral funiculi of SC from recovering EAE animals treated with LOV (i), GGTI-298 (ii), L744 (iii) and H-FSL (iv). Arrowheads depict cellular infiltration (red) and remyelination (white). Results in plots are expressed as average of n = 3/group in three identical experiments. Statistical significance are shown as ** p<0.01 and NS (non-significant) vehicle (A-C), and ** p<0.01 versus LOV treated recovering EAE and, # p<0.05 and ## (non-significant) versus drug CTL (D).
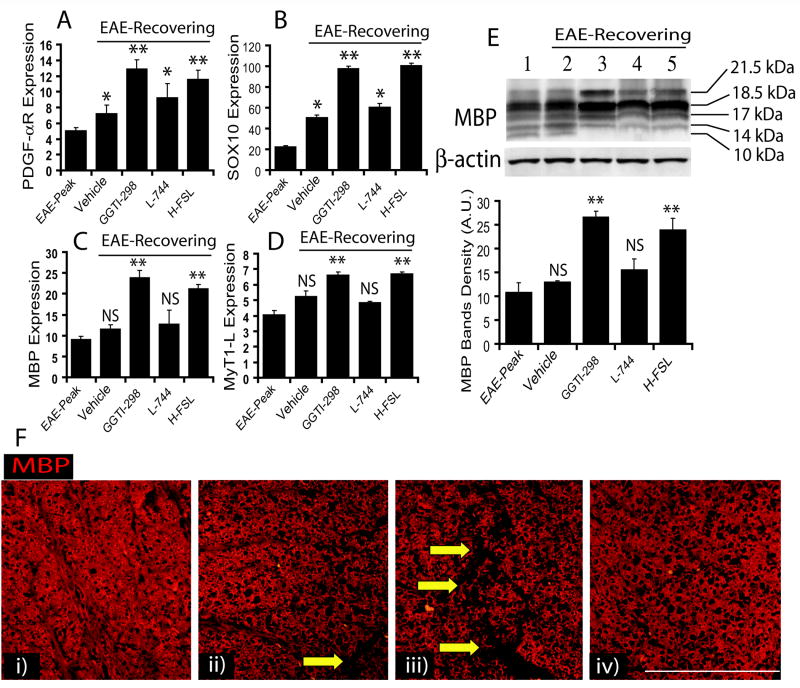
To further assess the induction of myelin repair as indicated by LFB staining of SC sections, we measure transcripts associated with myelin repair. Transcripts of OP-specific proteins (i.e., PDGF-αR and SOX10), and OL-specific proteins (i.e., MBP and MyT1-L) were significantly increased in the SC of recovering EAE animals treated with GGTI-298 or hydroxylfasudil compared to vehicle-treated EAE animals (Fig. 9A–D). Similar to vehicle-treated recovering EAE animals, a significant change in OP-specific transcripts not in OL-specific transcripts was observed in the SC of L-744,832 treated recovering EAE animals when compared with animals on peak clinical day (Fig. 9A–D). Correspondingly, protein level of MBP (Fig. 9E; inset) was significantly elevated in the SC of recovering EAE animals treated with GGTI-298 or hydroxylfasudil, compared to vehicle-treated EAE animals (Fig. 9E). Similar to vehicle-treated EAE animals, L-744,832 showed no significant change in the level of MBP in treated EAE animals compared with that observed on the peak clinical day (Fig. 9E). Immunohistochemical analysis of SC with anti-MBP antibodies further revealed that the integrity of SC white matter was restored by both GGTI-298 and hydroxylfasudil in recovering EAE animals, but not by L-744,832 (Fig. 9F).
Figure 9. Lovastatin promotes myelin-repair/remyelination via inhibition of the geranylgeranyl-PP arm of the mevalonate-pathway in EAE animals.
SC tissues of treated recovering EAE animals were processed for RNA isolation followed by cDNA synthesis using standard protocols described under Materials & Methods. Quantitative real-time PCR shows level of transcripts for PDGF-αR (A), SOX10 (B), MBP (C), and MyT1-L (D) in the SC of EAE animals. (E) Representative autoradiograph of immunoblotting depicts MBP isoforms including reference protein β-actin in the SC (inset) and plot depicts densitometeric analysis of total MBP level normalized with β-actin. (F) Immunohistochemistry shows representative fields of SC sections of recovering EAE animals immunostained with anti-MBP antibodies and counterstained with Hoechst dye for nuclei staining i.e., treated with LOV (i), GGTI-298 (ii), L-744 (iii) and H-FSL (iv). Arrows indicate the loss of myelin in the white matter as a result of inflammation in the lateral funiculi of SC. Results in plots are expressed as average of n = 3/group in three identical experiments. Statistical significance are shown as * p< 0.05, ** p<0.01 and NS (non-significant) versus vehicle treated EAE animals and # (non-significant) and ##p<0.05 versus EAE-Peak.
Depletion of geranylgeranyl-PP, independent of cholesterol lowering by lovastatin, promotes a promyelinating milieu in the SC of recovering EAE animals
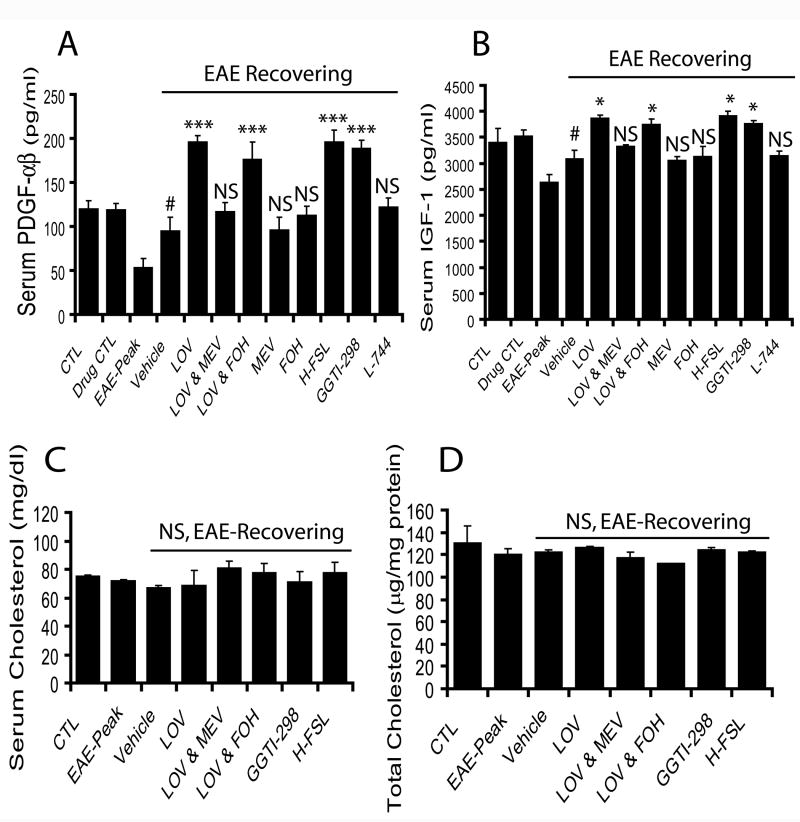
Next, to confirm our in vitro results that lovastatin induces expression of neurotrophic factors in Cyt-Mix-exposed mixed glial cells, we measured neurotrophic growth factors in the serum and SC tissue of EAE animals treated with lovastatin and aforementioned agents. Analysis of serum samples with ELISA-based kits indicated that lovastatin significantly increased the secretion of both PDGF-αβ and IGF-1 in the serum of recovering EAE animals compared to those treated with vehicle (Fig. 10A and B). Conversely, co-administration of lovastatin with mevalonolactone reversed the effect of lovastatin in recovering EAE animals, and this did not occur with farnesol co-administration (Fig. 10A and B). Similar to lovastatin, both GGTI-298 and hydroxylfasudil treated recovering EAE animals had a significant increase of these neurotrophic factors in serum compared to those animals treated with vehicle (Fig. 10A and B). Vehicle-treated recovering EAE animals, however, had more secretion of these neurotrophic factors than that observed on the peak clinical day, but it was less than those animals treated with lovastatin (Fig. 10A and B). Next to determine the effect of lovastatin on reduction of total cholesterol in treated EAE animals, we measured total cholesterol in the serum and SC tissues of treated EAE animals. Interestingly, no change in total cholesterol level was observed in either serum or SC tissues of EAE animals treated with lovastatin alone or with aforementioned agents when compared with controls (Fig. 10 C and D).
Figure 10. Lovastatin treatment increases serum neurotrophic factors in recovering EAE animals via depletion of geranylgeranyl-PP without lowering cholesterol.
Serum samples of treated/untreated recovering EAE animals with aforementioned agents were collected for determination of neurotrophic factors i.e., PDGF-αβ and IGF-1 using ELISA-based kits. Plot depicts serum level of PDGF-αβ (A) and IFG-1 (B) in EAE animals. Plots depict the level of total cholesterol in the serum samples (C) and SC tissues (D) of treated/untreated EAE animals. Results in plots are expressed as average n = 3/group in three identical experiments. Statistical significance are shown as * p<0.05, *** p<0.001 and NS (non-significant) versus vehicle treated EAE animals and # p< 0.05 versus EAE-Peak.
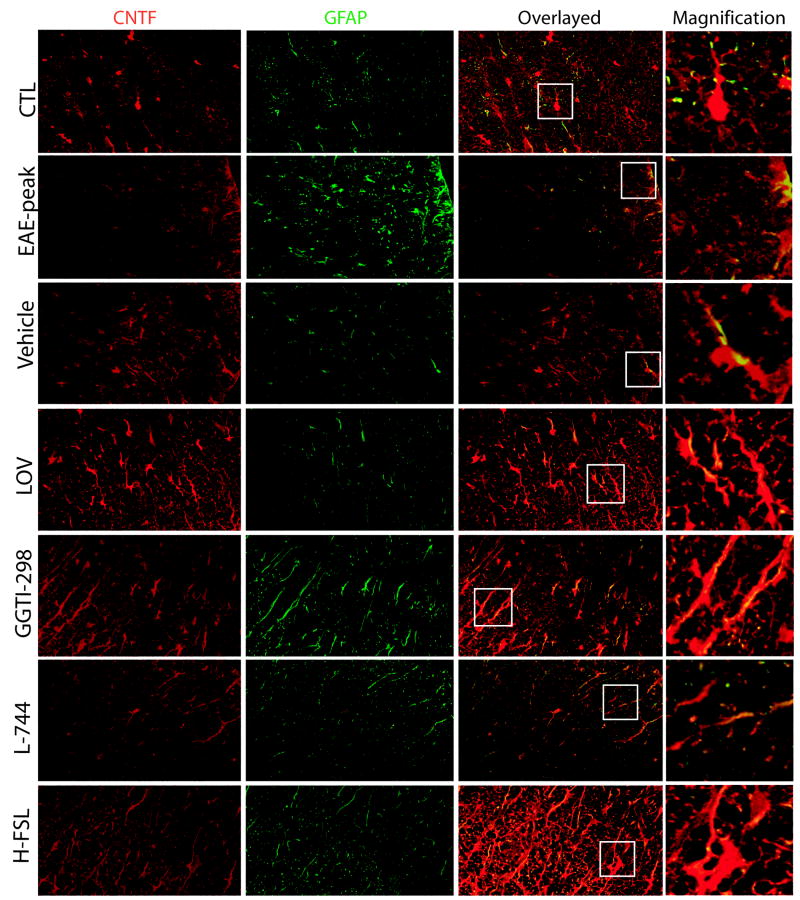
Immunohistochemistry of SC sections showed that CNTF immunostaining was relatively decreased with a corresponding increase in GFAP+ astrocytes (marker of astrogliosis) in the SC of EAE animals that was observed on the peak clinical day (Fig. 11; EAE-peak). Lovastatin treatment enhanced CNTF immunostaining in glial cells, especially astrocytes (GFAP+) in the SC of recovering EAE animals compared to those animals treated with vehicle (Fig. 11). A lovastatin-induced increase in CNTF-immunostaining in the SC of recovering EAE animals was mimicked by both GGTI-298 and hydroxylfasudil, but not by L-744,832 (Fig. 11). This effect of lovastatin on CNTF expression in the SC of recovering EAE animals was reversed by mevalonolactone co-administration, but not by farnesol (data not shown).
Figure 11. Lovastatin treatment enhances CNTF immunostaining in the SC of recovering EAE animals via depletion of geranylgeranyl-PP.
SC tissues of treated recovering EAE animals were used for immunohistochemistry studies. Representative Fields of the later funiculi of SC (as indicated) show immunostaining with ant-CNTF (red) and anti-GFAP (green) antibodies. Overlay of representative field show CNTF expressing astrocytes (GFAP+) in the ameliorating EAE animals. Squares in the overlayed sections depict magnified GFAP+/CNTF+ astrocytes in each field.
DISCUSSION
Statins have been described recently in terms of their anti-inflammatory properties as possible therapeutics for MS (Paintlia et al., 2004; Youssef et al., 2002). A small open-label clinical trial of simvastatin in relapsing-remitting MS patients showed reduction of new gadolinium-enhancing lesions by 44% (Vollmer et al., 2004). Likewise, atorvastatin, a related drug was promising in rheumatoid arthritis patients (McCarey et al., 2004). The disease modifying effects of statins in the animal model of MS are attributed to the following: inhibition of cellular infiltration (Paintlia et al., 2004), activation of immune cells (i.e., macrophages, T cells, endothelial cells) (Paintlia et al., 2004; Youssef et al., 2002), breakdown of the blood brain barrier (Greenwood et al., 2003), and neurodegeneration (Paintlia et al., 2005; Paintlia et al., 2006b).
The present study is the extension of our previous report documenting preservation of OPs and induction of myelin repair (remyelination) by lovastatin in EAE animals (Paintlia et al., 2005). Because statin induced pleiotropic effects are known to be mediated via reduction of isoprenoids rather than cholesterol (Cole et al., 2005), we anticipated that lovastatin may be altering in situ level of isoprenoids in glial cells during the recovery phase of EAE. Our in vitro studies established that lovastatin rescues OPs from inflammatory insult and promotes their proliferation and differentiation along with induction of a promyelinating milieu in mixed glial cultures. To replicate in vitro data, EAE animals exhibiting demyelination were treated with lovastatin and mevalonate-pathway related compounds, commencing on peak clinical day of the disease which is characterized by a compromised blood brain-barrier and severe cellular infiltration that is responsible for activation of resident glial cells in the SC. Lovastatin promoted the recovery rate via enhanced myelin repair and induction of a promyelinating milieu as established by histopathology, immunoblotting, ELISA and quantitative real-time PCR analyses. These effects of lovastatin both in vitro and in vivo were reversed by co-treatment with exogenous mevalonolactone or all-trans geranylgeranyl-PP, but not by farnesyl-PP or cholesterol suggesting that lovastatin-induced effects in glial cells are mediated by depletion of geranylgeranyl-PP as opposed to cholesterol. This notion was supported by the mimicking of lovastatin-induced effects both in vitro and in vivo by inhibitors of geranygeranyl transferase, Rho kinase and Rho family functions, but not by farnesyl transferase. This study provides evidence that specific depletion of geranylgeranyl-PP in glial cells by lovastatin promotes myelin repair (remyelination) via enhanced survival, proliferation and differentiation of OPs and induction of a promyelinating milieu in the CNS. Notably, these observed effects of statins in glial cells are in addition to their immunomodulatory effects observed in immune cells (Dunn et al., 2006; Greenwood et al., 2003; Veillard et al., 2006; Walters et al., 2002).
Statins are known to block the production of isoprenoids required for posttranslational modification of Ras/Rho family GTPases involved in the development of immune cells (Ghittoni et al., 2007). Statins-induced alterations in cellular isoprenoids and modulation of Rho family functions by depletion of geranylgeranyl-PP are reported to inhibit the migration and recruitment of mononuclear cells into the CNS (Greenwood et al., 2003; Walters et al., 2002) as well as activation of macrophages and endothelial cells (Veillard et al., 2006). In addition, statin-induced depletion of isoprenoids i.e., farnesyl-PP and geranylgeranyl-PP mediates its immunomudulatory effects with respect to the Th1 to Th2 shift in EAE (Dunn et al., 2006). Consistent with these studies the observed rapid recovery of EAE animals exhibiting cellular-infiltration and demyelination by lovastatin is attributed to the inhibition of cellular infiltration and activation of immune cells. The reversal of lovastatin-induced effects on myelin repair/remyelination by mevalonolactone, but not by farnesol, suggests that the inhibition of the geranylgeranyl-PP arm of the mevalonate-pathway is crucial for lovastatin-induced effects in glial cells. The depletion of farnesyl-PP by statins is known to hinder the proliferation of Th1 cells (Dunn et al., 2006) as the incorporation of this metabolite into farnesylated protein (i.e., Ras by farnesol) enhances the proliferation of immune cells resulting in severe EAE and demyelination. No reversal of lovastatin-induced effects by farnesol or farnesyl-PP co-treatment was observed in vitro and in vivo suggesting, that lovastatin most likely limits the conversion of these isoprenoids into geranylgeranyl-PP due to depletion of isopenetyl-PP in cells (Fig. 1A; mevalonate-pathway). Consistent with these effects of statins on immune cells, lovastatin’s ability to lower in situ isoprenoids protects OPs from inflammatory insult in glial cells (microglia and astrocytes). In addition, specific depletion of geranylgeranyl-PP and inactivation of Rho family GTPases by lovastatin in glial cells attenuates their activation and their inflammatory response in the CNS. In line with this, lovastatin was demonstrated to attenuate β-amyloid induced activation of microglia in the Alzheimer brain via inactivation of RhoA GTPases (Cordle and Landreth, 2005).
Posttranslational modification of a super family of small GTPase by isoprenylation are reported to play an essential role in the cellular processes relating to cell growth, differentiation, cytoskeleton function, and vesicle trafficking (Nobes and Hall, 1995; Ridley and Hall, 1992). The observed effects of lovastatin on terminal differentiation of OPs are consistent with reports suggesting that statins exert their effect via inhibition of the mevalonate-pathway and reduction of isoprenoids (Miron et al., 2007). Blocking the isoprenylation of Rho family GTPases i.e., RhoA causes its accumulation in the cytosol hence its inactivation, which prevents ROCK signaling and cell proliferation (Wolfrum et al., 2004). In line with this, statins are shown to induce cell differentiation and process extensions in OPs via RhoA inactivation (Miron et al., 2007). In agreement with these findings, an observed increase in differentiation of OPs by lovastatin and inhibitors of geranylgeranyl transferase, ROCK, and Rho family GTPase functions is suggestive of inhibition of RhoA family functions in OPs. This was further supported by treatment of primary OLs, microglia and astrocytes with lovastatin and metabolites of the mevalonate-pathway (Fig. 5). This suggests that lovastatin-mediated depletion of geranylgeranyl-PP is crucial for OL development and survival rather than farnesyl-PP under neuroinflammatory disease conditions. However, cholesterol is the major component in lipid rafts and lipid-raft signaling which is crucial for OL differentiation. We did not observe any change in total cholesterol in lovastatin-treated mixed glial cells or in recovering EAE animals, supporting the concept that the statin effect is mediated via lowering of isoprenoids rather than cholesterol. On the contrary, prolonged treatment (4 days) of purified OPs with simvastatin has been shown to induce cell death and that was rescued by cholesterol or isoprenoid co-treatment (Miron et al., 2007). Consistent with previous studies (Cole et al., 2005; Simons et al., 1998), we postulate that exogenous cholesterol available in the media or in the animal diet might restores the lovastatin-induced depletion of cholesterol. Also, mixed glial cultures likely have advantages over purified cultures of OPs as observed in neuron and astrocyte co-cultures treated with statins (Marz et al., 2007).
Brain glial cells secret neurotrophic factors important for proliferation and differentiation of neurons and OPs (Barres et al., 1993). Consistent with these studies, the observed increase in secretion and expression of neurotrophic factors by lovastatin treatment both in vitro and in vivo suggests that lovastatin promotes a promyelinating milieu via inhibition of Rho family GTPases in glial cells. These results are in agreement with our previous report documenting induction of a promyelinating milieu in the SC of lovastatin-treated recovering EAE animals (Paintlia et al., 2005). Neurotrophic factors are important for the survival and fate of glial cells. For instance, IGF-1 and PDGF are known to promote the survival of neurons and OPs (Fernandez-Galaz et al., 1997). Likewise, another neurotrophic factor, CNTF promotes the survival of both neurons and OLs (Linker et al., 2002). Importantly, Th2-biased lymphocytes are also known to secrete neurotrophic factors i.e., brain derived neurotrophic factor and leukemia inhibitory factor (Aharoni et al., 2005; Vanderlocht et al., 2006). In agreement with these results, an observed increase in OP proliferation by lovastatin both in vitro and in vivo conditions suggests that the induction of a promyelinating milieu is attributed to both immune and glial cells. It provide evidence that the immunomodulatory effect of lovastatin is beneficial to the survival, proliferation, and differentiation of OPs attributed to the secretion of anti-inflammatory cytokines (Molina-Holgado et al., 2001; Paintlia et al., 2006a) and neurotrophic factors (Aharoni et al., 2005; Vanderlocht et al., 2006). Also, these neurotrophic factors are reported to have ameliorating effects on EAE (Linker et al., 2002).
In conclusion, we report that the depletion of geranylgeranyl-PP is crucial in glial cells for the proliferation, terminal differentiation and survival of OPs in ameliorating EAE via inhibition of Rho family functions. Although, the direct effect of lovastatin on glial cells versus immune cells in the in vivo model is not discernible due its limitations, our in vitro studies and existing literature reports support our hypothesis that statins alter in situ level of isoprenoids thus Rho family functions in glial cells. This is the first report to describe the underlying mechanism(s) of statin-induced anti-inflammatory and neuroprotective effects in EAE animals. From these observations, we suggest that statins have therapeutic potential in MS in addition to possible uses in other related CNS-demyelinating-diseases.
Acknowledgments
We thank all members of our laboratory for their valuable comments and help during the course of this study. We thank especially Dr. Jennifer G. Schnellmann for critical reading of this manuscript and Ms. Joyce Brian and Ms. Carrie Barnes for their technical assistance.
Grant Support: This study was supported in part by grants from the National Institutes of Health: NS-22576, NS-34741, NS-37766, NS-40810, and NCRR grants C06 RR018823 and C06 RR015455 from the Extramural Research Facilities Program.
Abbreviations
- BrdU
5-bromo-2’-deoxyuridine
- CNS
central nervous system
- CNTF
ciliary neurotrophic factor
- Cyt-Mix
cytokine mixture
- DIV
days in vitro
- DMEM
dulbecco’s modified eagle’s medium
- EAE
experimental autoimmune encephalomyelitis
- FACS
Fluorescence-activated cell sorting
- Farnesyl-PP
farnesyl-pyrophosphate
- FTI
farnesyl transferase inhibitor
- GAPDH
glyceraldehyde-3-phosphate dehydrogenase
- Geranylgeranyl-PP
geranylgeranyl-pyrophosphate
- GFAP
glial fibrilary acidic protein
- GGTI
geranylgeranyl transferase inhibitor
- HMG-CoA
3-hydroxy-3-methylglutaryl-CoA
- IFN
interferon
- IGF-1
insulin like growth factor-1
- IL
interleukin
- LOV
lovastatin
- MBP
myelin basic protein
- MEV
mevalonolactone
- MS
multiple sclerosis
- MyT1-L
myelin transcription factor 1-like
- NG2
chondroitin sulfate proteoglycan-NG2
- OL
oligodendrocyte
- OPs
OL-progenitors
- O4
late OP marker
- PDGF
platelet-derived growth factor
- ROCK
rho kinase
- SC
spinal cord
- SOX10
sex determining region Y-box 10
- TNF
tumor necrotic factor
References
- Aharoni R, Eilam R, Domev H, Labunskay G, Sela M, Arnon R. The immunomodulator glatiramer acetate augments the expression of neurotrophic factors in brains of experimental autoimmune encephalomyelitis mice. Proc Natl Acad Sci U S A. 2005;102(52):19045–19050. doi: 10.1073/pnas.0509438102. [DOI] [PMC free article] [PubMed] [Google Scholar]
- Alegret M, Silvestre JS. Pleiotropic effects of statins and related pharmacological experimental approaches. Methods Find Exp Clin Pharmacol. 2006;28(9):627–656. doi: 10.1358/mf.2006.28.9.1003573. [DOI] [PubMed] [Google Scholar]
- Back SA, Han BH, Luo NL, Chricton CA, Xanthoudakis S, Tam J, Arvin KL, Holtzman DM. Selective vulnerability of late oligodendrocyte progenitors to hypoxia-ischemia. J Neurosci. 2002;22(2):455–463. doi: 10.1523/JNEUROSCI.22-02-00455.2002. [DOI] [PMC free article] [PubMed] [Google Scholar]
- Barres BA, Schmid R, Sendnter M, Raff MC. Multiple extracellular signals are required for long-term oligodendrocyte survival. Development. 1993;118(1):283–295. doi: 10.1242/dev.118.1.283. [DOI] [PubMed] [Google Scholar]
- Cao Q, Benton RL, Whittemore SR. Stem cell repair of central nervous system injury. J Neurosci Res. 2002;68(5):501–510. doi: 10.1002/jnr.10240. [DOI] [PubMed] [Google Scholar]
- Cole SL, Grudzien A, Manhart IO, Kelly BL, Oakley H, Vassar R. Statins cause intracellular accumulation of amyloid precursor protein, beta-secretase-cleaved fragments, and amyloid beta-peptide via an isoprenoid-dependent mechanism. J Biol Chem. 2005;280(19):18755–18770. doi: 10.1074/jbc.M413895200. [DOI] [PubMed] [Google Scholar]
- Cordle A, Landreth G. 3-Hydroxy-3-methylglutaryl-coenzyme A reductase inhibitors attenuate beta-amyloid-induced microglial inflammatory responses. J Neurosci. 2005;25(2):299–307. doi: 10.1523/JNEUROSCI.2544-04.2005. [DOI] [PMC free article] [PubMed] [Google Scholar]
- Druzhyna NM, Musiyenko SI, Wilson GL, LeDoux SP. Cytokines induce nitric oxide-mediated mtDNA damage and apoptosis in oligodendrocytes. Protective role of targeting 8-oxoguanine glycosylase to mitochondria. J Biol Chem. 2005;280(22):21673–21679. doi: 10.1074/jbc.M411531200. [DOI] [PubMed] [Google Scholar]
- Duda PW, Schmied MC, Cook SL, Krieger JI, Hafler DA. Glatiramer acetate (Copaxone) induces degenerate, Th2-polarized immune responses in patients with multiple sclerosis. J Clin Invest. 2000;105(7):967–976. doi: 10.1172/JCI8970. [DOI] [PMC free article] [PubMed] [Google Scholar]
- Dunn SE, Youssef S, Goldstein MJ, Prod’homme T, Weber MS, Zamvil SS, Steinman L. Isoprenoids determine Th1/Th2 fate in pathogenic T cells, providing a mechanism of modulation of autoimmunity by atorvastatin. J Exp Med. 2006;203(2):401–412. doi: 10.1084/jem.20051129. [DOI] [PMC free article] [PubMed] [Google Scholar]
- Fernandez-Galaz MC, Morschl E, Chowen JA, Torres-Aleman I, Naftolin F, Garcia-Segura LM. Role of astroglia and insulin-like growth factor-I in gonadal hormone-dependent synaptic plasticity. Brain Res Bull. 1997;44(4):525–531. doi: 10.1016/s0361-9230(97)00238-4. [DOI] [PubMed] [Google Scholar]
- Franklin RJ. Why does remyelination fail in multiple sclerosis? Nat Rev Neurosci. 2002;3(9):705–714. doi: 10.1038/nrn917. [DOI] [PubMed] [Google Scholar]
- Franklin RJ, Blakemore WF. Glial-cell transplantation and plasticity in the O-2A lineage--implications for CNS repair. Trends Neurosci. 1995;18(3):151–156. doi: 10.1016/0166-2236(95)93893-3. [DOI] [PubMed] [Google Scholar]
- Ghittoni R, Lazzerini PE, Pasini FL, Baldari CT. T lymphocytes as targets of statins: molecular mechanisms and therapeutic perspectives. Inflamm Allergy Drug Targets. 2007;6(1):3–16. doi: 10.2174/187152807780077291. [DOI] [PubMed] [Google Scholar]
- Greenwood J, Walters CE, Pryce G, Kanuga N, Beraud E, Baker D, Adamson P. Lovastatin inhibits brain endothelial cell Rho-mediated lymphocyte migration and attenuates experimental autoimmune encephalomyelitis. Faseb J. 2003;17(8):905–907. doi: 10.1096/fj.02-1014fje. [DOI] [PMC free article] [PubMed] [Google Scholar]
- Keilhoff G, Stang F, Goihl A, Wolf G, Fansa H. Transdifferentiated mesenchymal stem cells as alternative therapy in supporting nerve regeneration and myelination. Cell Mol Neurobiol. 2006;26(78):1235–1252. doi: 10.1007/s10571-006-9029-9. [DOI] [PubMed] [Google Scholar]
- Kraus J, Ling AK, Hamm S, Voigt K, Oschmann P, Engelhardt B. Interferon-beta stabilizes barrier characteristics of brain endothelial cells in vitro. Ann Neurol. 2004;56(2):192–205. doi: 10.1002/ana.20161. [DOI] [PubMed] [Google Scholar]
- Lassmann H, Bruck W, Lucchinetti C. Heterogeneity of multiple sclerosis pathogenesis: implications for diagnosis and therapy. Trends Mol Med. 2001;7(3):115–121. doi: 10.1016/s1471-4914(00)01909-2. [DOI] [PubMed] [Google Scholar]
- Liao JK. Isoprenoids as mediators of the biological effects of statins. J Clin Invest. 2002;110(3):285–288. doi: 10.1172/JCI16421. [DOI] [PMC free article] [PubMed] [Google Scholar]
- Linker RA, Maurer M, Gaupp S, Martini R, Holtmann B, Giess R, Rieckmann P, Lassmann H, Toyka KV, Sendtner M, Gold R. CNTF is a major protective factor in demyelinating CNS disease: a neurotrophic cytokine as modulator in neuroinflammation. Nat Med. 2002;8(6):620–624. doi: 10.1038/nm0602-620. [DOI] [PubMed] [Google Scholar]
- Marz P, Otten U, Miserez AR. Statins induce differentiation and cell death in neurons and astroglia. Glia. 2007;55(1):1–12. doi: 10.1002/glia.20422. [DOI] [PubMed] [Google Scholar]
- McCarey DW, McInnes IB, Madhok R, Hampson R, Scherbakov O, Ford I, Capell HA, Sattar N. Trial of Atorvastatin in Rheumatoid Arthritis (TARA): double-blind, randomised placebo-controlled trial. Lancet. 2004;363(9426):2015–2021. doi: 10.1016/S0140-6736(04)16449-0. [DOI] [PubMed] [Google Scholar]
- Miron VE, Rajasekharan S, Jarjour AA, Zamvil SS, Kennedy TE, Antel JP. Simvastatin regulates oligodendroglial process dynamics and survival. Glia. 2007;55(2):130–143. doi: 10.1002/glia.20441. [DOI] [PubMed] [Google Scholar]
- Molina-Holgado E, Vela JM, Arevalo-Martin A, Guaza C. LPS/IFN-gamma cytotoxicity in oligodendroglial cells: role of nitric oxide and protection by the anti-inflammatory cytokine IL-10. Eur J Neurosci. 2001;13(3):493–502. doi: 10.1046/j.0953-816x.2000.01412.x. [DOI] [PubMed] [Google Scholar]
- Nobes CD, Hall A. Rho, rac, and cdc42 GTPases regulate the assembly of multimolecular focal complexes associated with actin stress fibers, lamellipodia, and filopodia. Cell. 1995;81(1):53–62. doi: 10.1016/0092-8674(95)90370-4. [DOI] [PubMed] [Google Scholar]
- Paintlia AS, Paintlia MK, Khan M, Vollmer T, Singh AK, Singh I. HMG-CoA reductase inhibitor augments survival and differentiation of oligodendrocyte progenitors in animal model of multiple sclerosis. Faseb J. 2005;19(11):1407–1421. doi: 10.1096/fj.05-3861com. [DOI] [PubMed] [Google Scholar]
- Paintlia AS, Paintlia MK, Singh AK, Stanislaus R, Gilg AG, Barbosa E, Singh I. Regulation of gene expression associated with acute experimental autoimmune encephalomyelitis by Lovastatin. J Neurosci Res. 2004;77(1):63–81. doi: 10.1002/jnr.20130. [DOI] [PubMed] [Google Scholar]
- Paintlia AS, Paintlia MK, Singh I, Singh AK. IL-4-induced peroxisome proliferator-activated receptor gamma activation inhibits NF-kappaB trans activation in central nervous system (CNS) glial cells and protects oligodendrocyte progenitors under neuroinflammatory disease conditions: implication for CNS-demyelinating diseases. J Immunol. 2006a;176(7):4385–4398. doi: 10.4049/jimmunol.176.7.4385. [DOI] [PubMed] [Google Scholar]
- Paintlia AS, Paintlia MK, Singh I, Singh AK. Immunomodulatory effect of combination therapy with lovastatin and 5-aminoimidazole-4-carboxamide-1-beta-D-ribofuranoside alleviates neurodegeneration in experimental autoimmune encephalomyelitis. Am J Pathol. 2006b;169(3):1012–1025. doi: 10.2353/ajpath.2006.051309. [DOI] [PMC free article] [PubMed] [Google Scholar]
- Ridley AJ, Hall A. The small GTP-binding protein rho regulates the assembly of focal adhesions and actin stress fibers in response to growth factors. Cell. 1992;70(3):389–399. doi: 10.1016/0092-8674(92)90163-7. [DOI] [PubMed] [Google Scholar]
- Rizvi SA, Agius MA. Current approved options for treating patients with multiple sclerosis. Neurology. 2004;63(12 Suppl 6):S8–14. doi: 10.1212/wnl.63.12_suppl_6.s8. [DOI] [PubMed] [Google Scholar]
- Simons M, Keller P, De Strooper B, Beyreuther K, Dotti CG, Simons K. Cholesterol depletion inhibits the generation of beta-amyloid in hippocampal neurons. Proc Natl Acad Sci U S A. 1998;95(11):6460–6464. doi: 10.1073/pnas.95.11.6460. [DOI] [PMC free article] [PubMed] [Google Scholar]
- Vanderlocht J, Hendriks JJ, Venken K, Stinissen P, Hellings N. Effects of IFN-beta, leptin and simvastatin on LIF secretion by T lymphocytes of MS patients and healthy controls. J Neuroimmunol. 2006;177(12):189–200. doi: 10.1016/j.jneuroim.2006.04.012. [DOI] [PubMed] [Google Scholar]
- Veillard NR, Braunersreuther V, Arnaud C, Burger F, Pelli G, Steffens S, Mach F. Simvastatin modulates chemokine and chemokine receptor expression by geranylgeranyl isoprenoid pathway in human endothelial cells and macrophages. Atherosclerosis. 2006;188(1):51–58. doi: 10.1016/j.atherosclerosis.2005.10.015. [DOI] [PubMed] [Google Scholar]
- Vollmer T, Key L, Durkalski V, Tyor W, Corboy J, Markovic-Plese S, Preiningerova J, Rizzo M, Singh I. Oral simvastatin treatment in relapsing-remitting multiple sclerosis. Lancet. 2004;363(9421):1607–1608. doi: 10.1016/S0140-6736(04)16205-3. [DOI] [PubMed] [Google Scholar]
- Walters CE, Pryce G, Hankey DJ, Sebti SM, Hamilton AD, Baker D, Greenwood J, Adamson P. Inhibition of Rho GTPases with protein prenyltransferase inhibitors prevents leukocyte recruitment to the central nervous system and attenuates clinical signs of disease in an animal model of multiple sclerosis. J Immunol. 2002;168(8):4087–4094. doi: 10.4049/jimmunol.168.8.4087. [DOI] [PMC free article] [PubMed] [Google Scholar]
- Wolfrum S, Dendorfer A, Rikitake Y, Stalker TJ, Gong Y, Scalia R, Dominiak P, Liao JK. Inhibition of Rho-kinase leads to rapid activation of phosphatidylinositol 3-kinase/protein kinase Akt and cardiovascular protection. Arterioscler Thromb Vasc Biol. 2004;24(10):1842–1847. doi: 10.1161/01.ATV.0000142813.33538.82. [DOI] [PMC free article] [PubMed] [Google Scholar]
- Wolswijk G. Oligodendrocyte survival, loss and birth in lesions of chronic-stage multiple sclerosis. Brain. 2000;123(Pt 1):105–115. doi: 10.1093/brain/123.1.105. [DOI] [PubMed] [Google Scholar]
- Youssef S, Stuve O, Patarroyo JC, Ruiz PJ, Radosevich JL, Hur EM, Bravo M, Mitchell DJ, Sobel RA, Steinman L, Zamvil SS. The HMG-CoA reductase inhibitor, atorvastatin, promotes a Th2 bias and reverses paralysis in central nervous system autoimmune disease. Nature. 2002;420(6911):78–84. doi: 10.1038/nature01158. [DOI] [PubMed] [Google Scholar]
- Zamvil SS, Steinman L. Diverse targets for intervention during inflammatory and neurodegenerative phases of multiple sclerosis. Neuron. 2003;38(5):685–688. doi: 10.1016/s0896-6273(03)00326-x. [DOI] [PubMed] [Google Scholar]


