

Abstract
Genistein and ethinyl estradiol (EE2) were examined in multigenerational reproductive and chronic toxicity studies that had different treatment intervals among generations. Sprague-Dawley rats received genistein (0, 5, 100, or 500 ppm) or EE2 (0, 2, 10, or 50 ppb) in a low phytoestrogen diet. Nonneoplastic effects in females are summarized here. Genistein at 500 ppm and EE2 at 50 ppb produced similar effects in continuously exposed rats, including decreased body weights, accelerated vaginal opening, and altered estrous cycles in young animals. At the high dose, anogenital distance was subtly affected by both compounds, and a reduction in litter size was evident in genistein-treated animals. Genistein at 500 ppm induced an early onset of aberrant cycles relative to controls in the chronic studies. EE2 significantly increased the incidence of uterine lesions (atypical focal hyperplasia and squamous metaplasia). These compound-specific effects appeared to be enhanced in the offspring of prior exposed generations.
Keywords: genistein, ethinyl estradiol, rat, multigenerational, reproductive toxicity, estrous cycle, puberty acceleration, reproductive senescence, soy-free diet
INTRODUCTION
There is clear evidence from human and animal studies that exposure to the potent synthetic estrogen diethylstilbestrol (DES) during reproductive development has a variety of adverse effects in both sexes, including structural and functional reproductive tract effects and carcinogenesis, and that some of these effects can carry over into unexposed offspring (1–4). This has led to concerns that chemicals in the environment that have weaker estrogenic or other hormonal activities could be having similar adverse effects in human and wildlife populations (5, 6). This issue, often referred to as the “endocrine disruptor hypothesis”, has been an area of considerable research and regulatory concern in recent years. As part of its research effort, the National Toxicology Program (NTP) initiated multigenerational reproductive and chronic toxicity studies to address aspects of the hypothesis. The experimental design for these studies was a modification of standard multigenerational reproductive toxicity studies altered to determine if subtle effects observed after short term exposure in young animals would be magnified, sustained, diminished, or reversed in subsequent generations. It would also determine any carry over into unexposed generations or chronic toxicities, including neoplasms. In standard reproductive toxicity studies conducted for regulatory purposes, high doses are chosen to produce some maternal toxicity while the low dose is selected with the goal of not producing parental effects (7, 8). The high dose for chronic studies is set as the maximum tolerated dose. In the present studies, the goal was to select a high dose, based on the results of reproductive dose range-finding studies, that would not produce significant maternal toxicity but would produce reproductive tract lesions in the offspring, although to a degree that would not severely affect reproductive capacity in the first generation.
Genistein was selected for study as a representative phytoestrogen to which there is high human exposure in soy-based foods, dietary supplements, and infant formulas. Infants consuming soy formula, for example, have been reported to ingest 6–9 mg/kg of isoflavones/day and to have blood concentrations of total isoflavones as high as 5 to 10 μM (9). Diets with high levels of soy are proposed to have multiple beneficial effects, including chemopreventive activity against various cancers and alleviation of some of the adverse consequences of menopause, although the epidemiological evidence for many of these beneficial effects is minimal (10–16). Soy-containing diets have also been associated with reducing obesity and improving glucose control and insulin resistance (17–19) Diets high in soy contain multiple agents that may contribute to these effects, and consumption of these diets is also associated with lower calorie and fat intake. Nonetheless, much research attention has focused on the isoflavones, and particularly genistein, as the active components contributing to (or responsible for) the beneficial effects of soy. Soy isoflavones, particularly genistein, interact with estrogen receptors and affect hormone synthesis and metabolism, and sex hormone binding proteins. Genistein inhibits multiple enzymes involved in growth regulation, including tyrosine kinases, topoisomerases, and multiple other molecular targets (see above references and (20–23). While genistein has a preferential affinity for ERβ, it acts in vivo via both ERα and ERβ, with the dominant pathway in a particular cell type or tissue apparently influenced by the relative proportions of each receptor and the concentration of genistein (24, 25). Thus, in many cases genistein mimics more potent estrogens that bind preferentially to ERα, for example, stimulating uterine growth in immature or ovariectomized rodents (26), stimulating the growth of mammary tumor cells (27–29) inducing a similar pattern of gene expression as EE2 in the developing rat uterus (30), and testes and epididymides (31). Phytoestrogens, soy-containing foods, and soy components have been known for some time to produce adverse effects on reproductive processes in animals (32–35), and subcutaneous injections of genistein produce a spectrum of effects following dosing of neonatal female mice similar to those reported for DES (36–39).
EE2 is and has long been the predominant estrogen in oral contraceptives because of its significantly greater oral bioavailability in women relative to 17β-estradiol. Pregnancies do occur in women who are taking oral contraceptives; various studies have reported postconception use of oral contraceptives by 0.4–2.5% of oral contraceptive users (40), while Potter (41) estimated the mean pregnancy rate for oral contraceptive users to be 4 to 8%. The risks of obvious defects detectable at birth resulting from inadvertent exposure of the fetus to oral contraceptives appear to be low (42, 43), although potential subtle long-term consequences of such exposures have not been rigorously addressed. The detection of EE2 as an environmental contaminant has recently raised concerns about potential effects in aquatic wildlife (44). In contrast to genistein, EE2 shows a preferential affinity for ERα over ERβ (45, 46). While reports on the adverse effects of in utero and neonatal exposure to EE2 are fewer than those of DES, EE2 is reported to produce adverse effects following developmental as well as adult exposure in both sexes of mice and rats similar to those caused by DES (47–58).
To set the dose range to be used in the present studies, results from the short-term reproductive dose range-finding studies of genistein and EE2 in feed were conducted in the same test system used for the reproductive and chronic toxicity studies described here, that is, the NCTR CD Sprague-Dawley rat with dietary administration of test compounds in the soy- and alfalfa-free Purina 5K96 diet. Dietary exposures of 0, 5, 25, 100, 250, 625, or 1,250 ppm genistein and 0, 0.1, 1, 5, 25, 100, or 200 ppb EE2 were used in the reproductive toxicity dose range finding studies for the two compounds. The results of the genistein range-finding study have been reported previously (59, 60) and those for EE2 were included in the full study report for the multigenerational reproductive toxicology study (61). For both compounds, the high dose was clearly ruled out for further testing because of reproductive effects in both sexes and decreased body weight. Less severe effects at the 625 ppm (genistein) and 100 ppb (EE2) and lower dose levels, respectively, led to selection of 0, 5, 100, or 500 ppm genistein and 0, 2, 10, or 50 ppb EE2 for the multigenerational reproductive and chronic toxicity studies. This manuscript summarizes the major nonneoplastic effects of the soy phytoestrogen, genistein, and the potent estrogen, EE2, observed in females. Effects observed in males and neoplastic effects in both sexes will be presented in separate reports.
MATERIALS AND METHODS
The studies reported here were conducted in compliance with Food and Drug Administration Good Laboratory Practice Regulations (21 CFR, Part 58). All animal procedures were conducted under protocols approved by the NCTR Institutional Animal Care and Use Committee. Only data on endpoints showing significant treatment-related effects with one or both test compounds are reported here. The full detailed study reports, which include the data that are not shown in this manuscript, are available in National Toxicology Program (NTP) Technical Reports (61–4), which are available from the NTP website at ( http://ntp-server.niehs.nih.gov/index.cfm?objectid=084801F0-F43F-7B74-0BE549908B5E5C1C).
Background isoflavone content of the diet
The base diet used for the current study was an irradiated rodent feed free of soy and alfalfa (5K96, Purina Mills, Inc., Richmond, IN) in an attempt to maintain a consistently low background exposure to phytoestrogens. This feed maintains the nutritional specifications of the NIH-31 feed, which is the standard breeding and maintenance diet used in the NCTR rodent colony, but contains casein in place of the soy and alfalfa protein (www.labdiet.com). The control feed was routinely assayed for total isoflavone content after acid hydrolysis using HPLC/MS methods (65), which indicated levels of genistein and daidzein ≤0.5 ppm each. It should be noted that animals consuming control feed were ingesting a concentration of genistein approximately 10-fold lower than that of the groups exposed to the low dose (5 ppm) in the genistein studies. This background concentration iso consistent with the isoflavone intake of individuals consuming typical Western diets. The 5K96 diet underwent routine analyses for nutrient and contaminant levels according to standard NCTR procedures.
Test Compounds and Dose Formulations
Genistein (Toronto Research Chemicals, Inc., North York, Ontario, Canada) and EE2 (Sigma-Aldrich Corporation, St. Louis, MO) were determined to have purities of greater than 99% and 98.5%, respectively. Dosed feed was blended in a Patterson-Kelley twin-shell blender on an as needed basis, but not more than every 5 (genistein) or 9 (EE2) weeks. Genistein dosed feed was prepared by dry mixing, while a solution of EE2 in 95% ethanol was directly injected into Purina 5K96 in the blender to prepare the 10 and 50 ppb EE2 diets. Ethanol was removed from the EE2-dosed feed, and from the control feed that was mixed with 95 % ethanol alone, with heating under vacuum in the blender. The 2 ppb EE2 dose formulations were prepared by 1:5 dry dilutions of the 10 ppb dose feed. Blended dosed feed formulations were stored in stainless steel cans at 4° C. Purity of the bulk chemical was periodically confirmed over the course of the studies. Homogeneity of the blended dosed feed was confirmed, and stability in stainless steel storage cans was confirmed for up to 16 (EE2) or 17 (genistein) days at ambient temperature and for up to 24 (EE2) or 32 (genistein) weeks at 2° ± 8° C. Because of the very low concentrations of EE2, the technical difficulty of measuring such concentrations in the complex diet matrix was recognized; a somewhat greater degree of variability than that seen in studies with higher concentrations of test article was therefore anticipated and accepted prior to the start of the work. Analysis of blended dosed feeds indicated that genistein concentrations were ± 10% of the target dose, while EE2 concentrations were ± 30% of the target. These values were within the established study specifications.
Study Design – Multigenerational Reproductive Toxicology Study
The multigenerational reproductive toxicology and chronic study designs are outlined in Figure 1. The genistein and EE2 studies were conducted separately. It is important to note that exposure to the test compounds differed among generations, so that the meaning of the “dose” designation differs in different generations. The F0 generation was exposed to dosed feed from 6 weeks of age (PND 42) until termination at PND 140, while the F1 and F2 generations were exposed continuously from conception through termination at PND 140. The F3 generation was exposed from conception to weaning (PND 21) at which time they were placed on control feed for the remainder of the study. The F4 generation was not exposed to dosed feed and was included to test for transgenerational effects of compound exposure. Litter data were obtained for the F5 generation, which was also unexposed, and those litters were held with their dams until weaning and then terminated without further evaluation. Dose group designations for the nonexposed F4 and F5 generations indicate the exposure concentrations experienced by their parents and grandparents, respectively.
Figure 1.

Experimental design scheme for the multigenerational reproductive toxicology and the chronic toxicity studies of genistein and EE2. A detailed description of the protocol is found in Materials and Methods.
* F4 generation was mated following the same protocol as all previous generations to produce F5 litters
For the parental (F0) generation, 140 male and 140 female weanling NCTR CD rats (Strain Code 23) were obtained from the NCTR breeding colony and placed on control 5K96 feed. Until weaning at PND 21, these rats and their dams had been maintained on NIH-31 pellets. The NIH-31 diet has been reported to contain approximately 30 ppm of each of the soy-derived isoflavones genistein and daidzein, which are present predominantly in the form of the glucosides genistin and daidzin (66). The NCTR CD rat strain used in these studies was founded in 1972 from Sprague-Dawley rats from Charles River Laboratories and has been maintained in the NCTR breeding facility since that time. Rats of the F0 generation were acclimated to the Purina 5K96 diet for 3 weeks from PND 21 to PND 42 and were 6 weeks old at the beginning of the study. Animals in the F1 through F5 generations were on-study from conception. The health of the animals in all generations was monitored during the study according to the protocols of the NCTR’s Sentinel Animal Program.
Animals of the F0 generation were housed in pairs until assigned to exposure groups. On PND 42, animals were weighed and allocated to exposure groups of 35 males and 35 females by use of a stratified randomization procedure based on body weight. Animals were housed singly and identified by unique tail tattoos. Males were acclimated to wire breeding cages from PND 56 to PND 60. Pairings within exposure groups were randomly selected and females were introduced into breeding cages with the males. The F0 animals were no younger than PND 70 and no older than PND 84 at the time they were paired. When a vaginal plug was detected (in situ or in a pan below the cage), males and females were separated and housed individually for the remainder of the study. The date of plug detection was designated as the day of conception or Gestation Day 0 (GD 0). In pairs where no vaginal plug was detected, animals were separated after 14 days of cohabitation and data from any litters produced from such a mating were not used in evaluations of time-to-mating or gestation length.
On PND 2, litters were randomly standardized to four males and four females per litter. Animals were occasionally fostered within exposure groups to maintain constant litter size, but fostered pups were not used as breeders for the next generation and were not included among animals necropsied for histopathology. Pups to be used for breeding to produce the next generation were selected randomly, with the stipulations that the maximum number of available litters be represented and no more than two pups of each sex from any one litter be selected. Breeding pairs could not be siblings. One female from each litter was identified to be monitored for vaginal cytology for 14 consecutive days, starting 3 days after vaginal opening was observed. These vaginal cytology animals, which were not used as breeders, were identified by tail tattoo and pair-housed with another animal from the same exposure group. Breeder animals were housed individually and identified by unique tail tattoos. The procedures described above for mating and litter selection were followed for the F1 through F4 generations. Since additional animals for the chronic study (described below) were needed from the F3 generation, 40 pairs from the F2 generation were mated rather than 35 as in other generations. At weaning, all animals in the F3 generation were placed on 5K96 control feed.
Purina 5K96 feed and Millipore®-filtered tap water were available ad libitum until the day before termination when feed was withheld overnight.
In-life Examinations and Pathology
Twice-daily morbidity and mortality checks were performed, and any animals that were found moribund or dead were subjected to a complete necropsy. Body weights and feed consumption were monitored throughout the study with the frequency of measurement dependent upon the phase of the study.
For the F1 through F5 generations, the date on which pups were born was designated as PND 1. On PND 2, the number of pups alive or dead, sex ratio (ratio of males to females), and total live litter weight by sex were recorded, and any gross malformations were noted. The litters were randomly standardized to four male and four female pups per litter (pups with gross malformations were excluded), and the pups were marked with paw tattoos. After standardization, individual body weights of the retained pups were recorded. In addition, anogenital distances (AGDs) were measured with a dissecting microscope equipped with an ocular micrometer in the retained pups from 10 randomly selected litters. For the F1 through F4 generations, pups were weaned on PND 21 and given unique tail tattoo identification numbers.
For the F0 through F4 generations, mating and pregnancy parameters were measured for each litter. Vaginal cytology on one female animal from each litter was performed for 10 consecutive days prior to scheduled sacrifice on PND 140. Ovarian follicle counts were recorded from eight females in each exposure group at scheduled sacrifice. F5 generation litters (produced by breeding within the F4 generation) were euthanized at weaning following collection of basic litter information.
While in-life data were collected on all litters produced in the study, 25 litters and their associated dams and sires were randomly selected after all litters were born for continuation on the study and histopathological evaluation at termination on PND 140. At study termination, all surviving animals from the F0 through F4 generations were euthanized by exposure to carbon dioxide. Complete necropsies and microscopic examinations were performed. Tissues were examined grossly for visible lesions, removed, and fixed and preserved in 10% neutral buffered formalin with the exceptions of the reproductive organs and accessory glands, which were placed in Bouin’s fixative. Tissues were trimmed, processed, and embedded in Tissue Prep II, sectioned to a thickness of 4 to 6 microns, and stained with hematoxylin and eosin for microscopic examination. In addition, 5 step-sections of both ovaries from eight females per exposure group were used to obtain counts of small, growing, and antral follicles. Several pathologists from Toxicologic Pathology Associates (Jefferson, AR) were involved in reading the slides from these experiments and the chronic studies described below. To ensure consistency in the diagnostic terms used to describe lesions, all study results were subjected to peer review among the study pathologists.
Study Design – Chronic Study
Three exposure intervals were examined in the 2-year study: continuous exposure from conception through 2 years (F1C); exposure from conception through PND 140, followed by control diet until termination (F1T140); and exposure from conception through weaning at PND 21, followed by control diet until termination (F3T21). These exposure schedules for the three treatment arms of the study are shown graphically in Figure 1. The same sets of dams produced F1 offspring for both the F1C and F1T140 exposure groups. The F0 ancestral generation of the F3T21 animals in the chronic study were the same F0 animals used in the multigenerational reproductive toxicology study.
At weaning of the F1 generation, 50 control animals of each sex and 100 animals of each sex from the three treated groups were selected for continuation on the study and were housed individually until termination. Additional control animals were designated as sentinel animals, housed with the study animals, and removed for microbiological assessment periodically during the study. After weaning, animals were maintained on the same feed as their dams. At PND 140, one half of the animals in the treated groups were placed on control feed until termination of the study. Fifty animals from each of the dose groups in the F3 generation were placed on control feed at weaning until termination of the study. In all cases, study animals were selected so that a maximum number of litters was represented and no more than two animals of the same sex were taken from a single litter. For the genistein study, the number of litters from which the animals were derived in each exposure group ranged from 26 – 35 as follows: F1 0 ppm, 30 litters; F1 5 ppm, 26 litters; F1 100 ppm, 30 litters; F1 500 ppm, 27 litters; F3 0 ppm, 26 litters; F3 5 ppm, 31 litters; F3 100 ppm, 33 litters; F3 500 ppm, 36 litters. For the EE2 study, the number of litters from which the animals were derived in each exposure group were as follows: F1 0 ppb, 29 litters; F1 2 ppb, 32 litters; F1 10 ppb, 31 litters; F1 50 ppb, 34 litters; F3 0 ppb, 29 litters; F3 2 ppb, 31 litters; F3 10 ppb, 31 litters; F3 50 ppb, 35 litters.
Animals were observed twice daily and clinical findings were recorded weekly. Body weights and feed consumption were monitored throughout the studies. One half of the females in each exposure group were subjected to vaginal smears for 5 consecutive days once per month starting at month five. These smears were then evaluated by readers blinded to the treatment group for stage of the estrous cycle. If there was evidence that the animals were not cycling normally (i.e., 3 consecutive days of estrus or 4 consecutive days of diestrus) for 2 consecutive months, the animal was considered to have begun to show aberrant cycles during the first month in which abnormal cycling was observed. Complete necropsies and microscopic evaluations were performed on all F1C, F1T140, and F3T21 rats. Tissues were fixed in 10% neutral buffered formalin except for reproductive tissue, which was fixed in Bouin’s fixative.
Statistical Methods
The majority of data collected was analyzed by mixed models ANOVA. Except where noted below, the multigenerational reproductive toxicity experiment was evaluated as a two-way fixed effect treatment structure, with exposure concentration (“Dose”) and generation (“Generation”) as the treatments. The genistein and EE2 experiments were conducted independently, and statistical comparisons across the experiments were not conducted. Since all animals in the experiment were derived from 38 (genistein) or 37 (EE2) mated pairs from the NCTR breeding colony that gave rise to the F0 generation, random effects for the parents of the F0 animals (mother, father, and interaction) were included in the model if any of these effects were significant via a log likelihood ratio test at an α of 0.5 to account for any family line effects. For data collected from the 25 animals of each sex that were carried to terminal sacrifice from each dose level in all generations, no other ancestors were considered as possible sources of random effects in this study since for virtually all generations, only one animal per sex per litter was kept in the study.
For continuous data, probability-probability and quantile-quantile plots of residuals and residuals versus fitted values and predictors were used to assess normality and variance stability and to suggest transformations where necessary. Cook’s distance was examined to detect influential data points. Where data on a particular endpoint were collected from both sexes, analyses were conducted separately by sex. All statistical tests (except for the random effects described previously) were made at an αequal to the 0.05 level.
Two post hoc tests were performed. First, Dunnett’s tests (67) were done by generation or, in the case of repeated measures, generation and time interval, to compare treated groups against the control. Secondly, Holm’s adjusted independent t-tests (68) on generation were done by exposure concentration or, in the case of repeated measures, by exposure concentration and time interval. All possible pairwise comparisons of the different generations were made. Testing for linear and quadratic exposure concentration trends was accomplished using contrasts. Because the unequal spacing of the exposure concentrations could lead to undue influence of the highest exposure concentration on trend analyses, trend analyses for endpoints analyzed by ANOVA were also conducted using the natural log of the actual exposure concentration plus 1, which resulted in a more evenly spaced scale of 0, 1.8, 4.6, and 6.2 for genistein and 0, 1.1, 2.4, and 3.9 for EE2.
Nonparametric ANOVA was used in cases where data were not normally distributed (age at vaginal opening, vaginal cytology endpoints). Two-way nonparametric ANOVAs were performed, followed by one-way nonparametric ANOVAs (Kruskal-Wallis’ tests) (69) by generation and exposure concentration. For post hoc nonparametric pairwise comparisons of exposure concentrations within generation, Wilcoxon’s tests (70) were used, and for generations within exposure concentration, Holm’s corrections for multiple comparisons were included. Vaginal cytology was evaluated for percentage of days in each stage of the estrous cycle, number and percentage of abnormal cycles, and length of cycle. An abnormal cycle was defined as 3 or more consecutive days of estrus or 4 or more consecutive days of diestrus in a cycle (71). The Jonckheere-Terpstra (72, 73) nonparametric test for monotonic increasing or monotonic decreasing trend was also used to analyze effects of dose on length of estrous cycle.
In order to confirm the mixed-models ANOVA results, Kruskal-Wallis’ tests and logistic regression (74) were conducted and yielded equivalent statistical significances in the main effects and their interaction for the mating time and gestational length endpoints. Index data (mating index, pregnancy index, and fertility index) were analyzed by logistic regression. Here, the response variable was the proportion of animals observed positive for the endpoint. Poisson regressions (74) were also conducted for these three results using the raw count of the number of animals observed positive as the response variable. Both approaches yielded equivalent results for the main effects and their interaction for the fertility, mating, and pregnancy indices.
Vaginal cytology data, collected to evaluate whether or not exposure to the test compounds affected the time at which female rats began to show aberrant cycles prior to reproductive senescence, were analyzed by an accelerated failure time model. The data for this endpoint contained all three classical types of censoring, that is, left, right, and interval censoring. Left censoring occurred because some animals had begun to show aberrant cycles before observations were begun at 5 months of age. Right censoring occurred because some animals died or reached the end of the study without showing evidence of aberrant cycles. Finally, the intermittent nature of the data collection (one 5-day period every month) made it impossible to determine the exact time when aberrant cycles began, so the data exhibited interval censoring. An accelerated failure time Kaplan-Meier model that accommodated all three types of censoring was used to analyze these data. A generalized gamma model (75) was used as the distributional model.
Statistical Analysis of Histopathology Data (nonneoplastic lesions)
Observed nonneoplastic lesions were recorded with their severity scores and analyzed by a Jonckheere-Terpstra test for dose trend along with Shirley’s test (76, 77) for pairwise comparisons of exposed groups to the controls. These tests allow both incidence and severity information to be used. If the Jonckheere-Terpstra test indicated a positive trend, Shirley’s test was used to test for a monotonic increase in response. If the Jonckheere-Terpstra test indicated a negative trend, Shirley’s test was used to test for a monotonic decrease in response.
RESULTS
The approximate doses consumed by animals in each exposure group in the genistein and EE2 multigenerational reproductive toxicity and chronic studies are reported in Table 1. There were variations in feed intake over the various life stages covered by the studies, and the values given in Table 1 are averages over the entire studies. On a molar basis, the ingested doses of genistein were approximately 2750, 9600, and 9700 times higher than the ingested doses of EE2 at the low, middle, and high doses, respectively.
Table 1.
Ingested doses of genistein and EE2 by females in multigenerational reproductive and chronic dose feed studiesa
| Test Compound | Study Phase | Mean Dose (mg/kg/day) ± SEM | ||
|---|---|---|---|---|
| 5 ppm | 100 ppm | 500 ppm | ||
| Genistein | Multigenerational Reproductive Study | 0.5 ± 0.02 (45) | 10.0 ± 1.2 (45) | 50.6 ± 2.4 (46) |
| Chronic, Pre-PND 140 | 0.4 ± 0.02 (34) | 8.4 ± 0.4 (34) | 44.2 ± 2.0 (34) | |
| Chronic, Post-PND 140 (F1C) | 0.3 ± 0.0 (21) | 5.1 ± 0.1 (21) | 28.9 ± 0.7 (21) | |
| Test Compound | Study Phase | Mean Dose (μg/kg/day) ± SEM | ||
| 2 ppb | 10 ppb | 50 ppb | ||
| EE2 | Multigenerational Reproductive Study | 0.2 ± 0.01 (37) | 1.1 ± 0.1 (46) | 5.8 ± 0.3 (46) |
| Chronic, Pre-PND 140 | 0.2 ± 0.01 (34) | 0.9 ± 0.1 (34) | 4.9 ± 0.3 (34) | |
| Chronic, Post-PND 14 (F1C) | 0.1 ± 0.0 (21) | 0.6 ± 0.0 (21) | 3.3 ± 0.1 (17) | |
The mean ingested dose was calculated for each week that dosed feed was administered by multiplying the dietary level of test compound by the mean measured amount of food ingested weekly and dividing the result by the mean body weight for the week. These values were divided by 7 to give the mean daily dose given in the table. The number in parentheses is the number of weeks for which data were available for the calculation. The mean doses shown are for the entire feeding period. In the multigenerational reproductive study, the ingested doses were 140 – 150% greater for dams during the three week lactational period than for non-lactational periods.
Body Weights and Feed Consumption
In the multigenerational reproductive toxicity studies, both compounds caused reduction in body weight gains in females during times of direct consumption of dosed feed, that is, generations F0 through F2. Pup birth weight was not affected by treatment, but reduced weight gain was evident from approximately PND 14 in the F1 and F2 generations and persisted throughout the study. While detailed data on body weight gains are not reproduced here, the terminal body weights (Table 2) reflect the magnitude of this effect. In the genistein study, reduced weight gain was well correlated with reduced food consumption, although this correlation was not evident in the EE2 study (data not shown). Similar results were observed in the chronic studies (data to be reported elsewhere).
Table 2.
Terminal body weightsa in the multigenerational reproductive toxicology studies of genistein and EE2
| Genistein | ||||
|---|---|---|---|---|
| Generation | Dietary Genistein (ppm) | |||
| 0 | 5 | 100 | 500 | |
| F0*** | 268.7 ± 3.1 (100%) | 275.3 ± 3.1 (102%) | 266.3 ± 3.1 (99%) | 245.6 ± 3.7*** (91%) |
| F1*** | 272.6 ± 4.4 (100%) | 269.5 ± 4.0 (99%) | 262.7 ± 4.5 (96%) | 234.8 ± 3.0*** (86%) |
| F2* | 265.7 ± 2.6 (100%) | 263.8 ± 3.2 (99%) | 264.0 ± 2.8 (99%) | 250.4 ± 3.7* (94%) |
| F3 | 262.1 ± 3.2 (100%) | 264.2 ± 2.6 (101%) | 256.0 ± 2.8 (98%) | 255.2 ± 3.4 (97%) |
| F4 | 262.1 ± 3.9 (100%) | 261.4 ± 2.9 (100%) | 255.9 ± 2.8 (98%) | 251.2 ± 3.3 (96%) |
| EE2 | ||||
| Generation | Dietary EE2 (ppb) | |||
| 0 | 2 | 10 | 50 | |
| F0*** | 296.6 ± 7.1 (100%) | 284.6 ± 4.6 (96%) | 274.7 ± 3.9*** (93%) | 251.8 ± 4.0*** (85%) |
| F1*** | 281.3 ± 4.7 (100%) | 276.4 ± 3.2 (98%) | 269.2 ± 3.9 (96%) | 243.2 ± 2.8*** (86%) |
| F2*** | 281.0 ± 3.0 (100%) | 285.2 ± 3.3 (101%) | 280.4 ± 4.2 (100%) | 250.5 ± 3.7*** (89%) |
| F3 | 282.6 ± 3.3 (100%) | 283.7 ± 3.9 (100%) | 291.4 ± 3.8 (103%) | 291.3 ± 3.4 (103%) |
| F4 | 275.3 ± 3.2 (100%) | 287.7 ± 4.0 (104%) | 291.9 ± 3.3 (106%) | 286.9 ± 3.8 (104%) |
Mean (g) ± standard error. The numbers in parentheses are percentages of the control mean of that generation. Twenty-five animals in each group except for the genistein F1 controls, where n = 24. Asterisks in shaded cells in the generation column indicate significant dose trends within that generation; asterisks in shaded exposure group column cells indicate significant difference from controls in the same generation as determined by Dunnett’s test:
, P ≤0.05;
, P ≤0.01;
P ≤0.001.
Mating and Pregnancy
Neither genistein nor EE2 significantly affected the mating, fertility, or pregnancy indices or the mating and gestation times (data not shown). The only statistically significant effect found was for gestation time in the genistein study, where there was a significant difference among generations and significant linear dose trends in the F0 and F3 generations. However, the trends in these two generations were in opposite directions and the maximum mean difference between exposed and control groups in both generations was 0.3 days, or approximately 1.5% of the total mean gestation time, which is below the resolving power of the study.
Litter and Perinatal Pup Parameters
The effect of genistein on litter size varied across generations (Figure 2A). Statistically significant negative linear dose trends were detected for genistein in the F1 through F3 generations (the generations whose parents were fed genistein throughout adulthood) for total pups born and live births, and these trends appeared to be largely determined by the 12% to 31% reduction in litter size in the 500 ppm groups of those generations. The mean litter size of the 500 ppm F2 group was significantly less than that of the F2 control group and also significantly less than the litter size of the 500 ppm group of any other generation. Although the means in the 50 ppb EE2 exposure concentration group appeared to be slightly lower (5 – 9%) than controls in the F1–F3 generations (Figure 2B), EE2 did not have a statistically significant effect on litter size in any generation.
Figure 2.
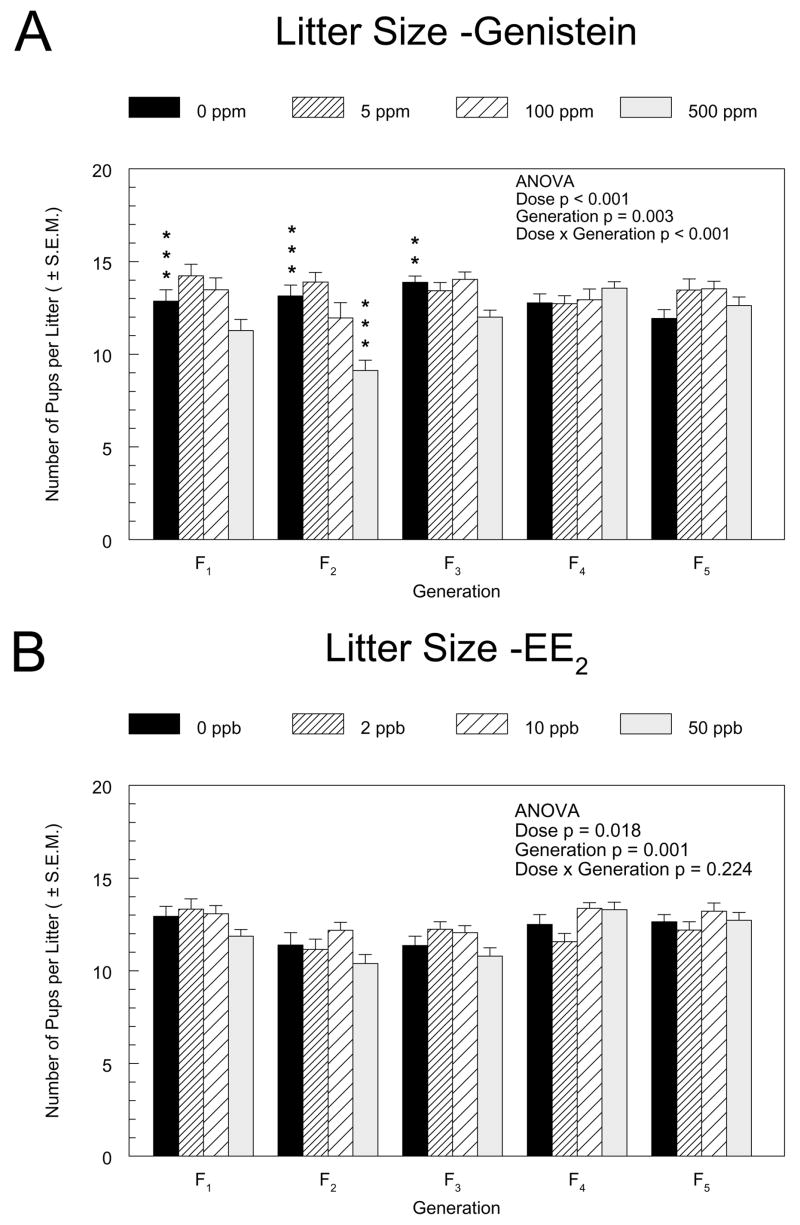
Litter sizes in the F1 through F5 generations of the genistein (A) and EE2 (B) multigenerational reproductive studies. The mean numbers of pups per litter ± standard error are shown. Square root transformation was used to stabilze variance. The results of a two-way ANOVA for the main factors, dose and generation, and their interaction are indicated. Asterisks (*) above the control group bar indicate a significant linear exposure concentration trend within the generation. Asterisks above the dosed group bars indicate a significant difference between the means of the marked group and the control group in that generation (Dunnett’s test). **, p ≤0.01; ***, p ≤0.001.
The effect of genistein exposure on mean AGD in females varied across generations, with a significant negative linear dose trend and smaller AGD (absolute, 7%; relative to body weight, 4%) relative to the controls in the 500 ppm group of the F1 generation (Figure 3A). Other significant differences between treatment groups and controls were dependent on the statistical model used, with the 500 ppm F2 and the 100 ppm F3 groups of females having significantly smaller AGDs than their respective control groups when analyzed by ANCOVA with body weight as covariate, but not when analyzed as the ratio of AGD to the cube root of body weight (data for the latter model not shown). The differences in mean AGDs among generations within dose groups were greater than the differences among exposed and control groups within a generation. For EE2, significant dose trends were observed for anogenital distance in the F2 and F3 generations with the 50 ppb groups significantly different from controls in both the ANCOVA and ratio statistical models. However, these differences were in opposite directions in the two generations (increased in F2, decreased in F3) and the magnitude of the differences was less than 10% (Figure 3B).
Figure 3.
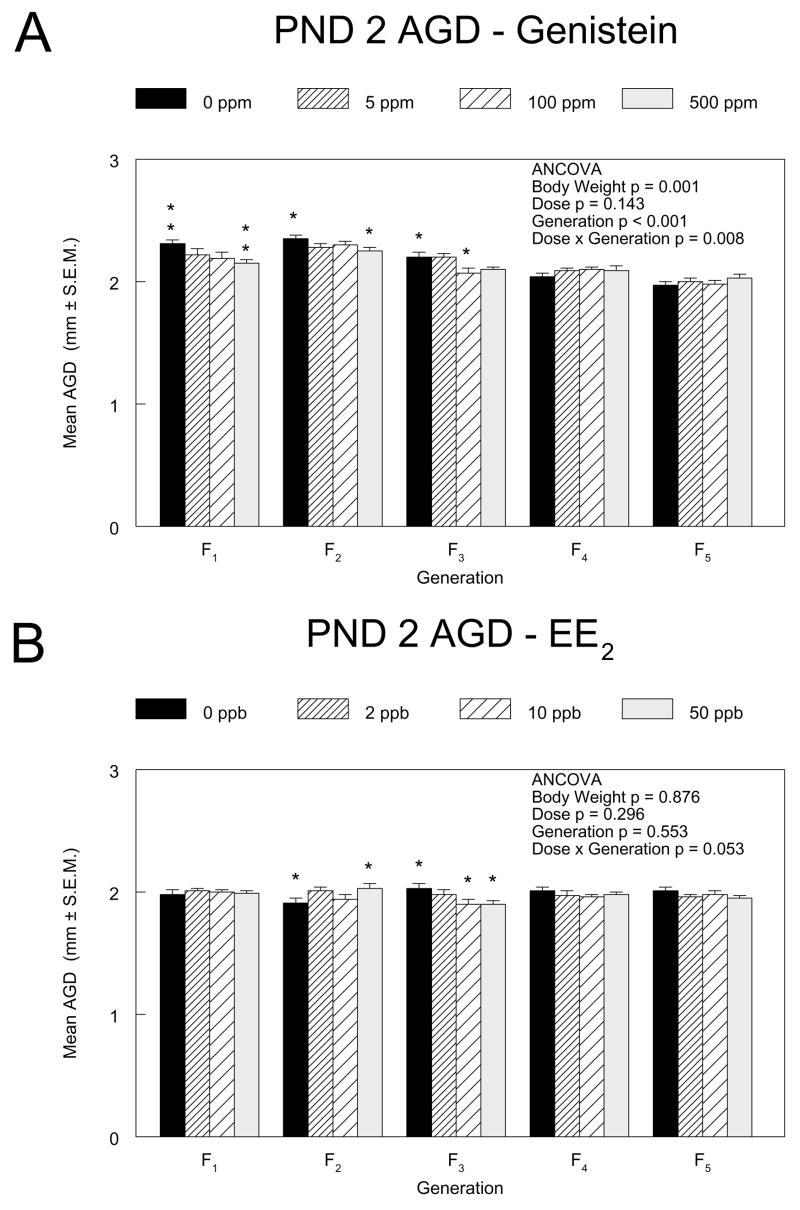
Anogenital distances of PND 2 female pups in the F1 through F5 generations of the genistein (3A) and EE2 (3B) multigenerational reproductive studies. Measurements were made on four pups (after standardization) from 10 litters in each exposure group. The mean AGDs (mm) ± standard errors are shown. The results from an analysis of covariance with body weight as the covariate are indicated. Asterisks above the control group bar indicate a significant linear exposure concentration trend within the generation. Asterisks above the dosed group bars indicate a significant difference between the means of the marked group and the control group in that generation (Dunnett’s test). *, p ≤0.05; **, p ≤0.01.
Vaginal opening
The ages at vaginal opening for females in the F1 through F4 generations of the genistein and EE2 studies are shown in Figure 4. For genistein, statistically significant overall effects of exposure concentration were found in the F1 through F3 generations, with vaginal opening occurring approximately 3 days earlier in 500 ppm F1 and F2 females than in their respective control groups. The age at vaginal opening in 5 ppm F3 females differed significantly from that in the controls by approximately one day. For EE2, there were significant overall dose effects in the F1, F2, and F3 generations, with vaginal opening occurring approximately 4, 6, and 3 days earlier in the 50 ppb groups than in the respective controls. Within the control groups across generations in the genistein and EE2 studies, the day of vaginal opening differed by up to 2.5 and 1 day, respectively. In both studies, a significantly lower body weight relative to controls at the time of vaginal opening was observed in exposure groups that had accelerated time of vaginal opening (data not shown) as well as in the F3 500 ppm genistein group (78.6 g in 500 ppm versus 92.9 g in controls), where time of vaginal opening was not significantly different from controls.
Figure 4.
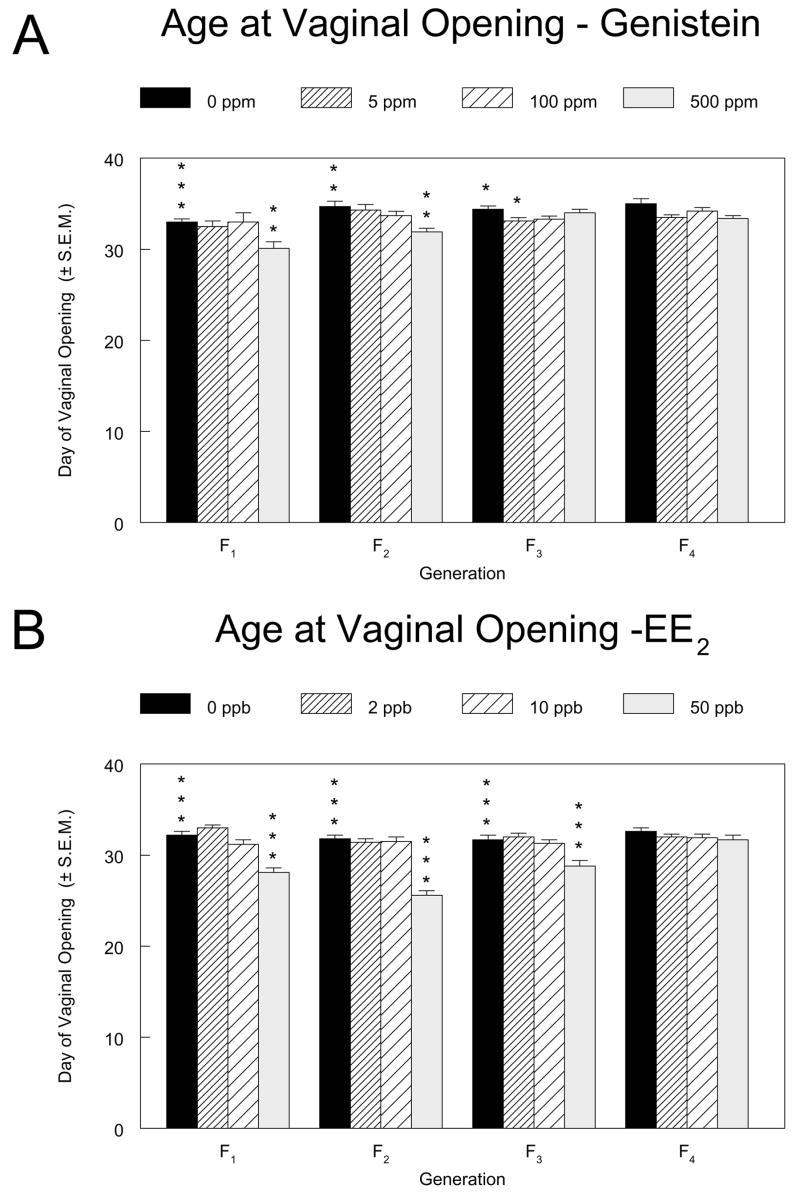
Age at vaginal opening for female pups in the F1 through F4 generations of the genistein (4A) and EE2 (4B) multigenerational reproductive studies. The mean day at which vaginal opening was observed ± standard error are shown. Asterisks above the control group bar indicate a significant overall Kruskal-Wallis’ test for the generation. Asterisks above the dosed group bars indicate a significant difference between the means of the marked group and the control group in that generation (Holm’s-adjusted Wilcoxon’s test). *, p ≤0.05; **, p ≤0.01; ***, p ≤0.001.
Estrous Cycle
Starting 3 days after the observation of vaginal opening, vaginal smears were taken for 14 consecutive days from 25 females per exposure group. These were littermates of breeding females in generations F1 through F4. Control animals at this age showed a variable incidence of abnormal cycles, ranging from approximately 2% – 15% (Figure 5A and B). In the genistein study, there was a statistically significant increase in the mean percentage of abnormal cycles in the 500 ppm group relative to the controls in the F1 generation (Figure 5A). The percentages of abnormal cycles due to prolonged diestrus and estrus were 48.7% and 18.0%, respectively, compared to 14.0% and 1.3% in controls. The apparent increased percentages of abnormal cycles in the F2 and F4 generations were not significant, although there was a significant overall dose effect when the analysis was limited to the mean number of abnormal cycles due to prolonged estrus in the F2 generation (not shown).
Figure 5.
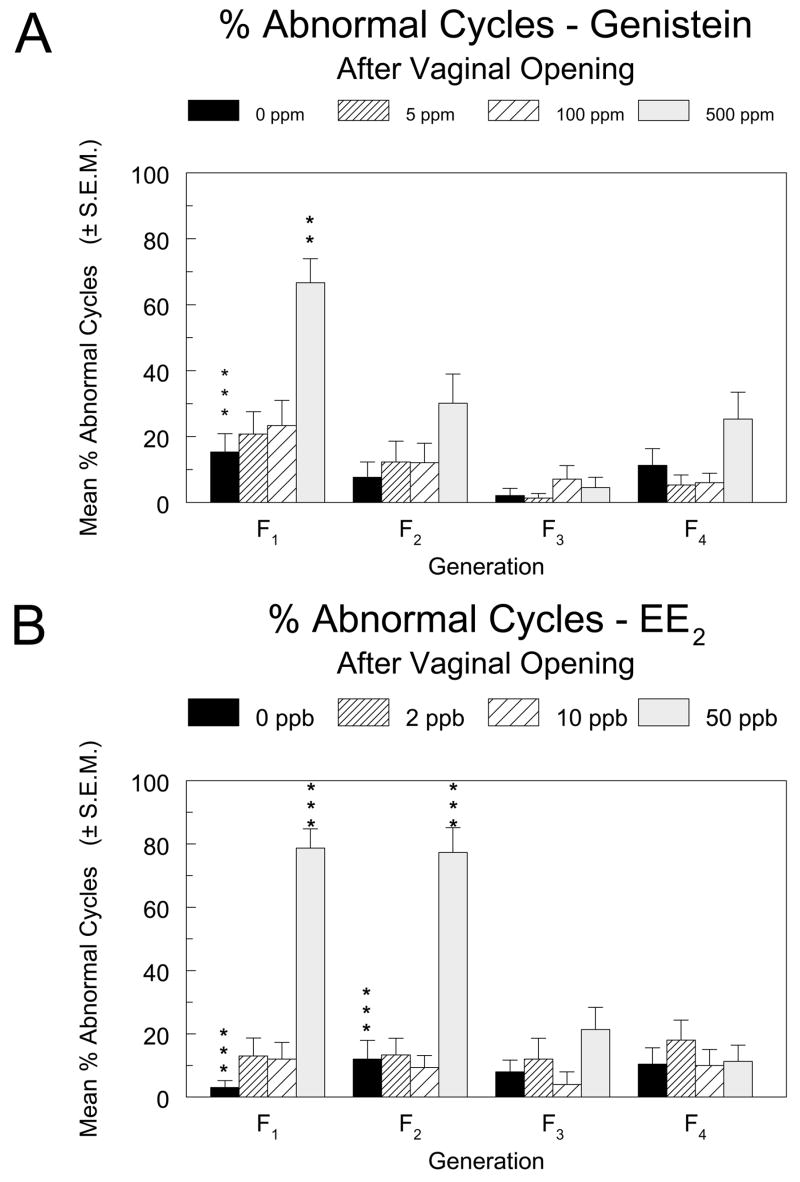
The percentage of abnormal estrous cycles in female pups in the F1 through F4 generations of the genistein (5A) and EE2 (5B) multigenerational reproductive studies. Vaginal smears were taken and examined for 14 consecutive days starting 3 days after vaginal opening was observed. Abnormal cycles were defined as 3 or more consecutive days of estrus or 4 or more consecutive days of diestrus. Asterisks above the control group bar indicate a significant overall Kruskal-Wallis’ test for the generation. Asterisks above the dosed group bars indicate a significant difference between the means of the marked group and the control group in that generation (Holm’s-adjusted Wilcoxon’s test). **, p ≤0.01; ***, p ≤0.001
In the EE2 study, effects on the estrous cycle in young animals were more pronounced. The percentages of abnormal cycles were significantly increased in the 50 ppb groups of the F1 and F2 generations relative to the respective controls (Figure 5B), due largely to prolonged estrus (45% and 44% of cycle time compared to 29% and 23% in controls of the F1 and F2 generations, respectively). There was also a significant increase in the percentage of cycles with prolonged diestrus in the 50 ppb group of the F1 generation, due in part to a particularly low incidence of cycles with prolonged diestrus in the controls of that generation (3% in F1 as compared to 12%, 8%, and 10% in the F2, F3, and F4 generations, respectively).
In the genistein study, mean cycle length was significantly increased in 500 ppm females in the continuously exposed F1 generation (3.2 days, or a 60% increase, Figure 6A). In F2 females, a significant increasing dose trend and increase in 500 ppm F2 females relative to controls (0.8 days, or a 15% increase) were significant only by the alternative Jonckheere-Terpstra and Shirley tests (not shown). In the EE2 study, length of cycle was significantly increased in the 50 ppb groups relative to controls in the continuously exposed generations F1 (5.6 days, a 122% increase) and F2 (5.4 days, a 100% increase) as well as in the 2 and 10 ppb groups of the F1 generation (0.7 and 1.1 days, or 16% and 24%, respectively).
Figure 6.
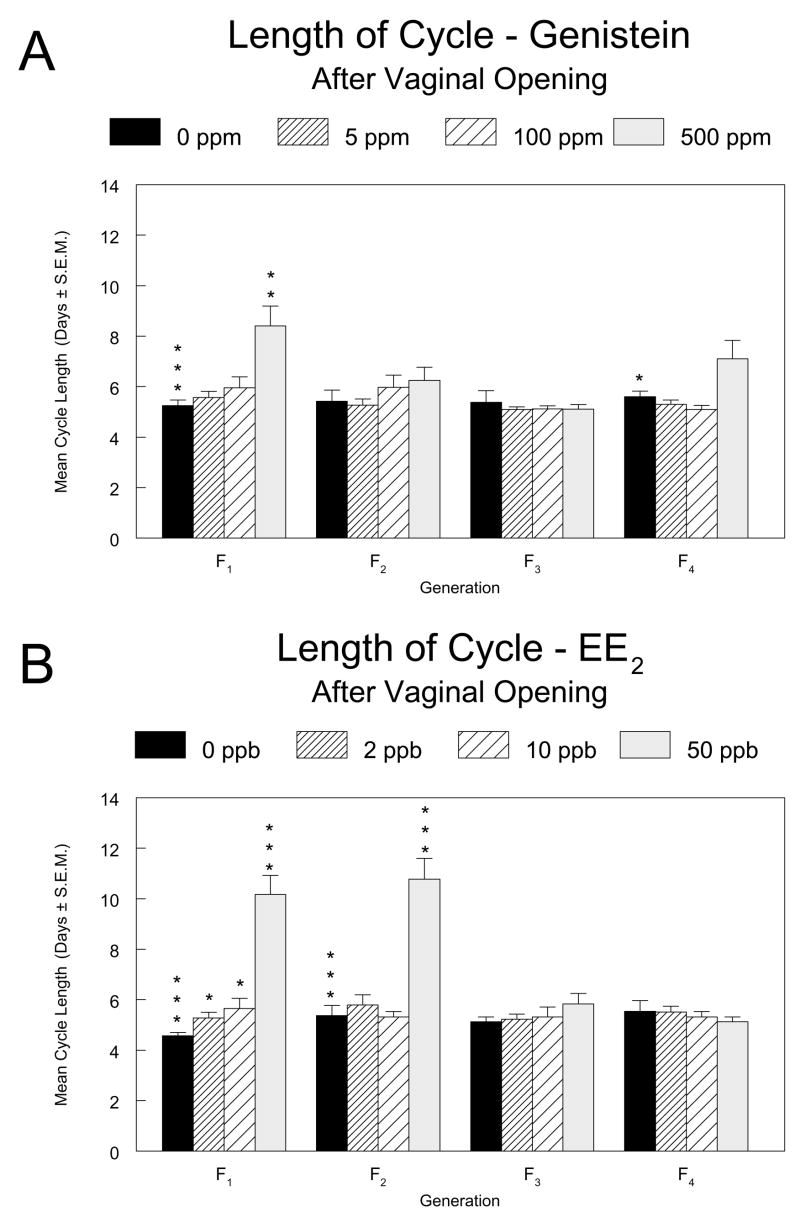
Mean length of the estrous cycle for female pups in the F1 through F4 generations of the genistein (6A) and EE2 (6B) multigenerational reproductive studies. Vaginal smears were taken and examined for 14 consecutive days starting 3 days after vaginal opening was observed. Asterisks above the control group bar indicate a significant overall Kruskal-Wallis’ test for the generation. Asterisks above the dosed group bars indicate a significant difference between the means of the marked group and the control group in that generation (Holm’s-adjusted Wilcoxon’s test). *, p ≤0.05; **, p ≤0.01; ***, p ≤0.001.
Vaginal smears were also obtained from breeder females from generations F0 through F4 for 10 consecutive days prior to necropsy, and the estrous cycle data were compiled and analyzed in the manner described above. The mean lengths of cycles did not differ significantly from the respective control in any exposure group for either compound. The sole only statistically (and biologically) significant effect was an increase in the number and percent of abnormal cycles. In the 500 ppm group of the F3 generation in the genistein study, when prolonged estrus and prolonged diestrus were combined, 29% of cycles were prolonged. The percentages for the 0, 5, and 100 ppm groups were 6, 2, 0, and 0%, respectively.
The ovary, uterus, and vagina taken from each animal at necropsy were also evaluated for stage of cycle and analyzed to determine if the organs were in synchrony. No significant effects of genistein or EE2 on estrous cycle synchrony were found in these organs (data not shown). In addition, while sporadic statistically significant effects on ovarian follicle populations were detected, no clear biologically significant treatment-related effects on ovarian follicle counts were discerned (data not shown).
Onset of Aberrant Estrous Cycles
Starting at 5 months of age, vaginal smears from 25 females per exposure group were taken for 5 consecutive days on a monthly basis and the stage of the estrous cycle was determined. Animals showing aberrant cycles (3 or more consecutive days of estrus or 4 or more consecutive days of diestrus) for 2 consecutive months were considered to be showing persistent aberrant cycles and were no longer sampled. Plots showing the time to onset of aberrant cycles for each study arm in the genistein and EE2 studies along with the results of fitted models based on the generalized gamma distribution function are shown in Figures 7 and 8, respectively. As is evident from the starting point of the curves in Figures 7 and 8, some animals, including some control animals, were determined to be having aberrant cycles at the start of monitoring at 5 months of age. There were no statistically significant treatment-related effects of EE2 on time of onset of aberrant cycles.
Figure 7.

Analysis of time to onset of aberrant cycles in aging females in the three arms of the chronic toxicity study of genistein. Starting at 5 months, vaginal smears were taken for 5 consecutive days each month. Animals that did not show normal cycles for two consecutive months were considered to be showing aberrant cycles and were no longer sampled. Kaplan-Meier curves are shown. The inset shows the overall p value (Wald chi-square test) as well as comparisons of each exposed group curve to the control group curve.
Figure 8.

Analysis of time to onset of aberrant cycles in aging females in the three arms of the chronic toxicity study of EE2. Starting at 5 months, vaginal smears were taken for 5 consecutive days each month. Animals that did not show normal cycles for two consecutive months were considered to be showing aberrant cycles and were no longer sampled. Kaplan-Meier curves are shown. The inset shows the overall p value (Wald chi-square test) as well as comparisons of each exposed group curve to the control group curve.
For the genistein study (Figure 7), exposure to 500 ppm in all treatment arms resulted in a reduction in the age of onset of aberrant cycles that was highly significant. In addition, for the F3T21 animals, all treated groups had a significantly earlier time of onset of aberrant cycles. The p values provided were not adjusted for multiple comparisons, and the effects at 5 and 100 ppm are thus marginal. The prevalent estral stage at the time of cessation of normal cycling was estrus, similar to observations in control animals (Table 3).
Table 3.
Estrous cycle stage in monitored female rats at the onset of aberrant estrous cycles in the genistein 2-year study
| Exposure Concentration (ppm) | Diestrus | Estrus | Metestrus | Totala |
|---|---|---|---|---|
| F1C | ||||
| 0 | 5 (22%) | 18 (78%) | 0 | 23 |
| 5 | 4 (16%) | 20 (80%) | 1 (4%) | 25 |
| 100 | 4 (17%) | 19 (79%) | 1 (4%) | 24 |
| 500 | 1 (4%) | 24 (96%) | 0 | 25 |
| F1T140 | ||||
| 0 | 5 (22%) | 18 (78%) | 0 | 23 |
| 5 | 6 (24%) | 17 (68%) | 2 (8%) | 25 |
| 100 | 5 (20%) | 17 (68%) | 3 (12%) | 25 |
| 500 | 2 (8%) | 23 (92%) | 0 | 25 |
| F3T21 | ||||
| 0 | 8 (32%) | 17 (68%) | 0 | 25 |
| 5 | 2 (8%) | 23 (92%) | 0 | 25 |
| 100 | 6 (24%) | 19 (76%) | 0 | 25 |
| 500 | 5 (20%) | 20 (80%) | 0 | 25 |
Number of females with complete vaginal cytology data. Three females that died early or became moribund were not included in the tabulation (2 from the 0 ppm F1C/F1T140 group (F1C and F1T140 shared the same control group); one from the 100 ppm F1C group).
Histopathology – Non-neoplastic lesions
No treatment-related microscopic non-neoplastic lesions were observed in reproductive or non-reproductive organs in the genistein or EE2-treated females evaluated at PND 140 in the multigenerational reproductive studies. However, in 2-year-old EE2-treated animals there were treatment-related increases in prevalence and/or severity of uterine lesions relative to controls (Table 4). In EE2-treated females, the uterine lesions included endometrial hyperplasia, atypical focal hyperplasia, and squamous metaplasia. Endometrial hyperplasia was characterized by proliferation of endometrial cells. These cells were increased in number and were situated either in the submucosa or were piled up on the surface of the uterine lumen. Cysts were often present. In atypical focal hyperplasia, foci of affected glands were lined by several layers of hyperplastic cells characterized by increased size and increased basophilic staining intensity. Nuclei of the hyperplastic cells were usually larger than normal and somewhat pleomorphic although a few nuclei were small and pyknotic. Cytoplasm of hyperplastic cells was often vacuolated. Squamous metaplasia was characterized by the proliferation of squamous cells in endometrial glands.
Table 4.
Incidences of nonneoplastic lesions of the uterus in female rats in the 2-year feed study of EE2
| Dietary EE2 (ppb) | ||||
|---|---|---|---|---|
| 0 ppb | 2 ppb | 10 ppb | 50 ppb | |
| F1Ca | ||||
| Number examined microscopically | 51 | 50 | 49 | 50 |
| Hyperplasia, endometriumb, c | 17 (33.3%)* [1.9] | 18 (36%) [2.0] | 22 (44.9%) [2.0] | 25 (50%)* [2.2] |
| Squamous metaplasia | 2 (3.9%)*** [1.0] | 6 (12%) [2.0] | 8 (16.3%)* [1.4] | 13 (26%)*** [1.6] |
| Atypical hyperplasia, focal | 6 (11.8%)*** [1.0] | 14 (28%)* [1.4] | 16 (32.7%)** [1.4] | 20 (40.0%)*** [1.6] |
| F1T140a | ||||
| Number examined microscopically | 51 | 50 | 50 | 50 |
| Hyperplasia, endometrium | 17 (33.3%) [1.9] | 24 (48%) [1.9] | 14 (28%) [1.9] | 24 (48%) [2.1] |
| Squamous metaplasia | 2 (3.9%) [1.0] | 6 (12.0%) [1.5] | 6 (12.0%) [1.0] | 1 (2%) [1.0] |
| Atypical hyperplasia, focal | 6 (11.8%) [1.0] | 10 (20.0%) [1.3] | 7 (14.0%) [1.6] | 9 (18.0%) [1.7] |
| F3T21 | ||||
| Number examined microscopically | 52 | 50 | 50 | 50 |
| Hyperplasia, endometrium | 20 (38.5%) [2.3] | 13 (26%) [2.1] | 16 (32%) [2.2] | 22 (44%) [2.4] |
| Squamous metaplasia | 1 (1.9%)*** [2.0] | 4 (8.0%) [1.5] | 3 (6.0%) [1.7] | 11 (22.0%)*** [1.7] |
| Atypical hyperplasia, focal | 6 (11.5%)*** [1.7] | 16 (32.0%)** [1.4] | 15 (30.0%)* [1.6] | 21 (42.0%)*** [1.5] |
F1C and F1T140 share a common control group.
Number of animals with lesion; numbers in parentheses, percentage of total animals examined with lesion; numbers in brackets, mean severity grade of lesions in affected animals: 1=minimal, 2=mild, 3=moderate, 4=marked
Asterisks in control (0 ppb) column indicate a significant trend by the Jonckheere-Terpstra test. Asterisks in columns for exposed groups (2, 10, and 50 ppb) indicate significant differences from control group by Shirley’s test.
, p ≤0.05;
, p ≤0.01;
p ≤0.001
In the EE2 study, there was an increased incidence of endometrial hyperplasia in the 50 ppb F1C group. There were dose-related increased incidences of atypical focal hyperplasia and squamous metaplasia in all exposed groups of F1C females, which were statistically significant at 10 and 50 ppb, increased incidences of atypical hyperplasia in all exposed groups of F3T21 females, and an increased incidence of squamous metaplasia in the 50 ppb F3T21 group. In the genistein study, increased endometrial hyperplasia was observed in all study arms, but there was no atypical hyperplasia observed in any dose group and squamous metaplasia was elevated in a non-dose-responsive manner only in the F3T21 animals (Table 5).
Table 5.
Incidences of nonneoplastic lesions of the uterus in female rats in the 2-year feed study of genistein
| Dietary Genistein (ppm) | ||||
|---|---|---|---|---|
| 0 ppm | 5 ppm | 100 ppm | 500 ppm | |
| F1Ca | ||||
| Number examined microscopically | 54 | 50 | 50 | 49 |
| Hyperplasia, endometriumb, c | 16 (29.6%) [1.8] | 24 (48.0%)d [1.7] | 16 (32.0%) [2.1] | 24 (49.0%)* [1.9] |
| Squamous metaplasia | 4 (7.4%) [1.7] | 5 (10.0%) [1.8] | 8 (16.0%) [1.3] | 5 (10.2%) [1.0] |
| Atypical hyperplasia, focal | 0 | 0 | 0 | 0 |
| F1T140a | ||||
| Number examined microscopically | 54 | 50 | 49 | 50 |
| Hyperplasia, endometrium | 16 (29.6%)*** [1.8] | 15 (30.0%) [1.6] | 26 (53.1%)* [1.4] | 33 (66.0%)*** [2.1] |
| Squamous metaplasia | 4 (7.4%) [1.7] | 1 (2.0%) [1.0] | 5 (10.2%) [1.8] | 7 (14.0%) [1.5] |
| Atypical hyperplasia, focal | 0 | 0 | 0 | 0 |
| F3T21 | ||||
| Number examined microscopically | 53 | 50 | 50 | 49 |
| Hyperplasia, endometrium | 16 (30.2%)* [1.4] | 24 (48.0%)* [1.9] | 24 (48.0%)* [2.0] | 24 (49.0%)* [2.4] |
| Squamous metaplasia | 1 (1.9%) [2.0] | 6 (12.0%)d [1.6] | 5 (10.0%) [1.4] | 6 (12.2%)* [1.6] |
| Atypical hyperplasia, focal | 0 | 0 | 0 | 0 |
F1C and F1T140 share a common control group.
Number of animals with lesion; numbers in parentheses, percentage of total animals examined with lesion; numbers in brackets, mean severity grade of lesions in affected animals: 1=minimal, 2=mild, 3=moderate, 4=marked
Asterisks in control (0 ppb) column indicate a significant trend by the Jonckheere-Terpstra test. Asterisks in columns for exposed groups (2, 10, and 50 ppb) indicate significant differences from control group by Shirley’s test.
, p≤0.05;
, p ≤0.01;
, p ≤0.001
p < 0.05 in comparison to control by Shirley’s test, but violates the monotonicity constraint of the test and is thus not significant.
Other than the uterus, statistically significant increases in lesions in the 2-year EE2 study were confined to incidences of liver eosinophilic and basophilic foci in 50 ppb F1C (5 of 50 versus 1 of 51 in controls) and F1T140 (6 of 50 versus 1 of 51in controls) animals, respectively, and increases in clitoral gland hyperplasia in 50 ppb F1T140 (8 of 49 versus 2 of 50 in controls) and F3T21 (3 of 48 versus 0 of 50 in controls) animals. There were no treatment-related non-neoplastic lesions noted in other reproductive or non-reproductive organs in the genistein 2-year study.
DISCUSSION
Dose levels and exposure
In interpreting the results of these studies, it is important to consider the level of exposure of the animals to the test compound during the various stages of the experiment. Table 1 shows the ingested doses of genistein and EE2 in female rats during dosing periods of the multigenerational reproductive and chronic toxicology studies described here. On a molar basis, the ingested daily dose of genistein was approximately 2750, 9600, and 9700 times that of EE2 for the low, middle, and high dose groups, respectively, which approximates the reported magnitude of difference in affinity of the two compounds for ERα(45, 46, 78–80). At the high dose level, the ingested doses (approximately 30 – 50 mg/kg for genistein and 3 – 6 μg/kg for EE2) are considerably greater than exposures in even the most heavily exposed humans. Infants consuming soy formula have been reported to ingest 6–9 mg isoflavones/kg/day (9), approximately half of which is genistin, the glycosylated form of genistein, while humans taking oral contraceptives containing 30 μg EE2 ingest approximately 0.5 μg EE2/kg/day. However, the uptake and metabolism of these compounds by rats and humans differ, with resulting differences in serum levels (81–84); thus, comparison of ingested levels may not provide a good indication of the rat exposure levels relative to human exposure levels.
In conjunction with the experiments reported here, blood and tissue concentrations of genistein were measured in adult (82), fetal (85), and nursing animals (86). These studies demonstrated that, under the conditions of the current study, fetal, weanling, and adult animals were exposed to internal (serum and tissue) concentrations of genistein that are achievable in humans ingesting soy products. However, genistein exposure was extremely limited in neonatal pups, less than in the fetal animals, and this is important to the interpretation of the data. On the one hand, effects attributable to early (preweaning) exposure are more likely to result from fetal (intrauterine) exposure, because of the higher in utero concentrations of the active estrogenic aglycone form of genistein, or from direct exposures during the preweaning period after the pups begin directly consuming dosed feed. On the other hand, the low exposure to genistein via nursing during the sensitive early postnatal period resulting from dietary exposure of the dams needs to be considered when making safety evaluations based on the results of these studies. The early neonatal period in rodents, which roughly corresponds to the second and third trimester of human gestation (87), is known to be a period of development that is highly sensitive to disruption by exposure to estrogenic agents, including genistein (36, 37, 39, 88–91). It is also important to consider that soy products consumed by humans are complex and that factors other than the serum and tissue concentrations of genistein can contribute to biological effects of soy (92), although the levels of circulating aglycone genistein have been shown to correlate well with some soy effects (93).
In the case of EE2, even the highest dose level (50 ppb) serum concentrations were below 34 pM, the limit of detection of the liquid chromatography-mass spectrophotometric method used for the analysis (94). This result is consistent with the low oral bioavailability of EE2 in rats relative to humans (83). For example, in contrast to the low serum concentrations of EE2 in rats in the current study, van den Heuvel et al. (95) reported maximum and average serum concentrations of 0.57 and 0.15 nM, respectively, over a 21-day observation period in women taking a combined oral contraceptive containing 30 μg EE2 (approximately 0.44 μg/kg body weight based on the average weight of 67.4 kg for women in the study). In addition to direct consumption of EE2 by the animals in the multigenerational reproductive toxicology study, there was presumed transplacental and lactational exposure (Figure 1). There are limited quantitative data available on the transplacental and lactational exposure of fetuses or neonates to EE2 administered to the mother. Slikker et al.(96) demonstrated the transfer of intact EE2 to the circulation of the fetus after intravenous administration to pregnant rhesus monkeys. In addition, multiple reports of measurable biological effects of EE2 in pups following administration of EE2 to pregnant rodents are consistent with transplacental transfer of the compound (50–58, 97). Studies conducted in humans (98, 99) and rats (100) suggest that the extent of transfer of EE2 to the newborn via milk is very limited. In summary, the serum levels of EE2 achieved in the dietary studies reported here were extremely low (< 34 pM), and lower than those achieved in the serum of women taking oral contraceptives, at all dose levels in all phases of the study.
Treatment effects summary
Both genistein and EE2 showed effects in females in these studies, with the majority of effects consistent with estrogenic action and confined to the high dose groups of animals continuously exposed to the test compounds. Both compounds reduced body weight gains, affected AGD to a minor extent, reduced the age at vaginal opening, and altered estrous cycles in young animals. EE2 generally caused larger changes than genistein. In addition, genistein produced changes not seen in the EE2 animals, including reduced litter sizes and an earlier onset of aberrant estrous cycles in aging rats. EE2 produced uterine lesions typical of chronic estrogen exposure in the 2-year study, while genistein did not. For most endpoints, there was no evidence for magnification of effects across generations or carryover of effects into unexposed generations. However, in the chronic study arm in which offspring of three compound-exposed generations were evaluated that were themselves exposed through weaning (F3T21), early onset of aberrant cycles was observed at a lower genistein dose than in F1 animals continuously exposed to genistein. In the EE2 study, uterine lesions were more prominent in treated F3T21 animals than in F1 animals removed from dose at PND 140. The reasons for these observations are unknown.
Body weight gain
Both genistein and EE2 caused reduced weight gain, most prominent in the high dose groups of the generations that were treated continuously (F0 through F2). The magnitude of the reduction was greater in the EE2-exposed animals. Reduced weight gain was expected, since estrogens are known to have an anorectic effect and to modulate energy utilization even without reduced food intake (101–103). Dietary genistein at concentrations of 500 to 1,500 ppm in intact or ovariectomized rodents produced decreases in feed consumption, body weight, and/or adipose deposition (104–106). The study of Naaz et al. (105) in ovariectomized mice suggested that the decrease in adipose deposition was dependent on ERα, although the data of Kishida et al. (107) suggested that the effect of mixed soy isoflovones on food intake in adult female rats may not be entirely due to estrogenic activity.
Mating and litter parameters
There were no statistically significant effects of genistein or EE2 on measures of mating success, but there were significant reductions of litter size in genistein-exposed animals. Litter size was reduced in the 500 ppm group of the F2 generation, together with significant decreasing dose trends for litter size in the F1 and F3 generations. However, the 500 ppm dose groups were not significantly different from controls in pairwise comparisons in the F1 and F3 generations. No significant effects of EE2 on litter size were observed. While several studies of developmental exposure to genistein have found no effect on litter size (108), other studies have reported such an effect. Takagi et al. (48) reported that dietary genistein significantly reduced litter size at 1,250 ppm. Using Wistar rats fed a low phytoestrogen diet under study conditions similar to those used in the present studies, McClain et al. (109) reported a reduction in litter size only at the much higher dose of 500 mg/kg. Jefferson et al. (37) reported that female CD-1 mice treated neonatally with subcutaneous doses of 5 mg genistein/kg body weight produced progressively smaller litters over time, while females dosed with 50 mg/kg produced no litters. The latter study, which involved subcutaneous injection of pups at an age at which the dietary exposures reported here were smaller, also demonstrated changes in structure and function of the ovaries that were not observed in the present rat studies (see below). With EE2, unlike the results of the present study, Fusani et al. (110) reported that oral dosing with 400 ng/kg/day during gestation and lactation increased litter size.
Both genistein and EE2 affected AGD in these studies. Mixed and relatively modest effects of genistein or soy on AGD in females have also been reported by others. AGD in neonates is dependent upon prenatal exposure to androgens, which stimulate the growth of the perineum (111–114) and thus AGD is greater in males than in females. This endpoint has generally been more of a focus of study in terms of the feminization of males than the hyperfeminization or masculinization of females. The administration of genistein in feed (1,000 ppm) from GD 1 to PND 56 (104) or of a soy-containing diet from GDs 0 to 20 (115) increased (i.e. masculinized) the AGD in female rat pups. Casanova et al. (104) also found a significantly increased AGD in female pups of dams fed a soy-containing diet versus a soy-free diet. On the other hand, Levy et al. (116) reported a decreased AGD in female rat pups born to dams that had been treated with 5 mg genistein by subcutaneous injection on GDs 16 to 20. In the present study, EE2 had small effects on female AGD in the F2 and F3 generations, with an increase at 50 ppb in F2 and decreases in the 10 and 50 ppb groups of F3. A two-generation study by Kang et al. (117) did not find a significant effect of 10 μg EE2 /kg/day, or of genistein at 0.4 or 4 mg/kg/day on AGD in either sex. In the present genistein and EE2 studies, the intermediate and high dose significantly decreased AGD in the female pups of the F3 generation suggesting a possible cumulative effect across generations, although there was no evidence of a carryover of effects into the unexposed F4 generation. The magnitude of the effect was small, with AGDs in affected dose groups within the range of values seen in control animals in other generations, thus the biological meaning of such small and sometimes transient effects on AGD reported here and in the literature is not clear.
Onset of puberty
In the current studies, exposure to 500 ppm genistein or 50 ppb EE2 caused vaginal opening at a younger age and/or at lower body weight in female pups of the F1 through F3 generations. The lower body weights coincident with vaginal opening suggest strongly that these were direct estrogenic effects of the compounds.
EE2 produced a larger reduction than did genistein in time to vaginal opening, and the effect did not carryover into the unexposed F4 generation with either compound. Both the effect and the exposure concentrations at which it was observed are generally consistent with other literature reports. Although Levy et al. (116) administered 5 or 25 mg genistein (about 12 or 60 mg/kg per day) by subcutaneous injection to pregnant dams on GDs 16 to 20 and found a delay in vaginal opening only at the lower dose, other studies in rats or mice with injected, gavaged, or dietary exposures to genistein or with dietary soy protein isolate have generally reported an acceleration of vaginal opening or no effect (104, 118–123). In two experiments using exposures somewhat different from those used in the current study, acceleration of vaginal opening was reported within the dose range of genistein used here (120, 121). Takagi et al. (48), on the other hand, observed no reduction in time to vaginal opening after feeding 1,250 ppm genistein to rats in a soy- and alfalfa-free diet from GD 15 through PND 11, and Nagao et al. (90) saw no reduction after gavage dosing of rat pups with up to 100 mg/kg on PNDs 1 to 5. In our dose range-finding study of genistein, which used only 5 litters per exposure group, the mean time of vaginal opening in the 1,250 ppm group was not significantly different from that in controls (60).
Effects on estrous cycle in young females
No effects of genistein or EE2 on ovarian histology were noted, although perturbations of the estrous cycle, including prolonged cycles, were noted in continuously exposed 500 ppm genistein and 50 ppb EE2 F1 and F2 animals soon after the time of vaginal opening. These disturbances may have been related to the compound-induced early onset of puberty and, as indicated above, they were not associated with reductions in fertility parameters. This contrasts with the report of Fusani et al. (110) who found significant persistent estrus in the offspring of dams that were treated orally during gestation and lactation with 400 ng/kg/day EE2 dissolved in peanut oil, and the female offspring did not produce live litters after mating. In the present study, estrous cycles in animals near the time of termination at 20 weeks, after delivery and nursing of litters, did not show significant treatment-related aberrations in estrous cycle. Prolonged cycles and increased time in estrus or diestrus have been observed in animals treated prepubertally with genistein (48, 120, 122–126). Genistein-induced ovarian degeneration and abnormal cycling were observed in rats fed 1,250 ppm in the earlier range-finding feed study when genistein was administered from GD 7 through PND 50 (60), and these effects have also been described following neonatal treatment of rats with high doses of genistein (three subcutaneous doses of 5 mg per animal on PNDs 2, 4, and 6) (124). Similar doses administered to older prepubertal animals and dietary administration of 25 or 250 ppm from conception through weaning did not result in ovarian toxicity, although mammary gland differentiation was affected by both treatments (127). On the other hand, Awoniyi et al. (128) reported that dietary exposure to 5 ppm genistein from GD 17 through weaning or continuing until PND 70 had lasting effects on the ovary of Sprague-Dawley rats, including degeneration of follicles and a persistent interstitial compartment; these effects were persistent in animals even when exposure to dosed feed ended at weaning, suggesting that in utero and/or lactational exposure was responsible for the effects. In a gavage study, Nagao et al. (90) dosed Sprague-Dawley rat pups on PNDs 1 to 5 with 12.5 to 100 mg genistein/kg per day and necropsied the animals at 21 days or 18 weeks of age. In the older animals, all dosed groups showed an increase of abnormal cycles and decreased fertility indices (number of animals pregnant/number of animals mated). Some animals in the 50 or 100 mg/kg per day groups showed atrophic ovaries with atretic follicles and no corpora lutea, but lesions were not observed in the lower dose groups. Lamartiniere et al. (118, 129) detected ovarian toxicity only at high doses of genistein (5 mg/rat) administered subcutaneously to neonatal rats, and Kang et al. (117) reported no ovarian lesions with maternal gavage exposures of 0.4 or 4 mg/kg body weight per day. Jefferson et al. (36) treated neonatal mice (PNDs 1 to 5) with subcutaneous injections of 1, 10, or 100 μg genistein per day and found induced expression of ERαand an increased number of ovulated oocytes at the lowest dose, and a decrease in the number of ovulated oocytes at the higher doses. A dose-related increase in multioocyte follicles was also observed, but, unlike the induction of ERα, this effect was not observed in ERβknockout mice. As mentioned previously, Jefferson et al. (37) reported that female CD-1 mice treated neonatally with subcutaneous doses of 5 mg genistein/kg body weight produced progressively smaller litters over time, while females dosed with 50 mg/kg produced no litters. These doses are close to the ingested doses of genistein in the current multigenerational rat study, and serum concentrations resulting from this dosing regimen in mice had previously been shown to approximate those produced by oral dosing (130). The observations by Jefferson et al. (37) of reduced fertility in mice were accompanied by altered estrous cycles, altered ovarian function, and early reproductive senescence, with some effects seen at doses of 0.5 mg/kg. There is thus some discrepancy in the literature regarding the extent of the ovarian toxicity of genistein, the timing and duration of exposures, and the doses that produce this toxicity. In studies that have reported ovarian toxicity, the neonatal period appears to be particularly sensitive. It is conceivable that the limited neonatal exposure achieved in the current multigenerational rat feed study contributed to the limited effects observed on ovarian and fertility endpoints. Nonetheless, it is difficult to reconcile the ovarian effects reported by Awoniyi et al. (128) in Sprague-Dawley rats fed 5 ppm genistein with the results of the current study.
Non-neoplastic uterine lesions after chronic treatment
The uterus showed significantly increased incidences of squamous metaplasia and atypical hyperplasia in the 2-year EE2 study that were consistent with elevated exposure to an estrogenic stimulus. These effects were observed in 50 ppb F1C animals, which were exposed to EE2 from conception to termination of the study. There were no significant effects in animals removed from dose and placed on control diet at PND 140 (F1T140). A strong response was observed in the F3T21 animals, which were the offspring of three prior exposed generations that were themselves removed from dose at weaning, suggesting that the multigenerational exposure of the F3 animals affected the responsiveness of their uteri to the preweaning estrogen exposure or that the multigenerational exposure produced a transgenerational effect. Effects of the same magnitude on squamous metaplasia and atypical hyperplasia were not observed in the genistein study, although significant increases in endometrial hyperplasia were seen in all three arms of the study (F1C, F1T140, and F3T21). The fact that the effect on endometrial hyperplasia, a lesion with a high background incidence, was stronger in the F1T140 animals than in the continuously dosed F1C animals suggests that this may not be a true treatment-related effect. Atypical hyperplasia was not seen in any dose group in the genistein study, although there was a non-dose-responsive increase in squamous metaplasia in the F3T21 animals.
Effects on the onset of aberrent estrous cycles in aging rats
In the chronic studies, the estrous cycles of nonparous female rats were monitored starting at 5 months of age to provide an estimate of when the animals began to show aberrant cycles, a condition known to precede reproductive senescence. While exposure to potent estrogens early in development is well-known to produce persistent estrus in adult animals, under the conditions of the present study, EE2 did not affect the timing of onset of aberrant cycles. On the other hand, in all three arms of the current genistein study, the 500 ppm groups were found to have earlier onsets of aberrant estrous cycles than control animals. Some animals, including some animals in the control groups, showed aberrant cycles at the earliest observation time. Sprague-Dawley rats are known to show relatively early declines in the control of estrous cycles, and unstable cycles in control animals have been reported in animals as early as 5–6 months (131). Historical control data are not available for the NCTR CD rat on this endpoint. Factors such as single housing and virginity, both of which apply in the current study, can accelerate the process of reproductive aging in rats (132–134). Nonetheless, the effect of the genistein-containing diets in accelerating the onset of aberrant cycles was clear. The observation in the multigenerational reproductive toxicology study that genistein induced alterations of the estrous cycle in rats immediately after vaginal opening but not in older rats immediately prior to termination of the study at PND 140 may indicate that the older rats were conditioned by their prior pregnancy and nursing experience. Genistein at 500 ppm accelerated the onset of aberrant estrous cycles in all three arms of the study, and there was also some evidence for a similar effect at the 100 and 5 ppm exposure concentrations in the F3T21 study arm. Although placental transfer of genistein under the conditions of this study has been demonstrated (85), exposure of the pups via the dam’s milk under the conditions of this study was low (86). The neonatal period is known to be a sensitive window for the effects of estrogenic agents in rodents and Jefferson et al. (37) recently demonstrated the induction of early reproductive senescence in female mice treated neonatally with subcutaneous injection of 0.5 to 50 mg/kg genistein. Earlier experiments examining the effects of prenatal and neonatal exposure of rats to genistein had indicated that the effect of genistein on pituitary gland responsiveness to gonadotropin releasing hormone was complex with regard to timing of exposure and exposure concentration (88, 116). Pituitary gland responsiveness was decreased in ovariectomized female rats exposed to genistein as neonates (88), but not in rats exposed in utero (116). It is thus not clear why the effects of 5 and 100 ppm genistein would be evident only when exposure was restricted to the in utero and preweaning period, and the fact that the animals showing these lower dose effects were the offspring of prior exposed generations may be an important factor. The differential preferences of genistein and EE2 for ERαand ERβ(45, 46, 104) may be among the factors involved in the discrepant effects of these compounds in the present study. Studies with pure estrogen receptor subtype agonists may aid in addressing that issue. In contrast to the primacy of the depletion of ovarian follicles in the onset of reproductive senescence in women, alterations of the hypothalamic-pituitary-ovarian axis are predominant in reproductive senescence in the rat. While the differences in the nature of reproductive senescence in women and in rats, and Sprague-Dawley rats in particular, have led to arguments disputing the relevance of events in the rat to those in humans, the discovery of similarities in central nervous system events in women in the perimenopause and rats undergoing senescence have generated interest in the possible relevance of aspects of the rat model to the onset of menopause (134–136). The earlier onset of aberrant estrus cycles in aging rats in the present genistein study, together with the data of Jefferson et al. (37) in mice, warrant further mechanistic studies to determine their potential relevance to humans consuming isoflavone-enriched products.
Summary
The results of the experiments described here on genistein and EE2 in a unique experimental design serve to confirm and define better the estrogenic properties of genistein in female rats. They also indicate the possibility of several unique actions of genistein and EE2 that may warrant further mechanistic study to establish their relevance to other endocrine disruptors with estrogenic activity and, more importantly, their relevance to human exposure scenarios.
Acknowledgments
This work was supported by Interagency Agreement IAG 224-07-007 between the U.S. Food and Drug Administration and the National Institute for Environmental Health Sciences. The extensive and expert technical assistance of the NCTR support staff in providing diet preparation, chemical analysis, animal care, computer support, necropsy, and tissue processing services for these studies is gratefully acknowledged. The views presented in this article do not necessarily reflect those of the U.S. Food and Drug Administration.
Footnotes
Publisher's Disclaimer: This is a PDF file of an unedited manuscript that has been accepted for publication. As a service to our customers we are providing this early version of the manuscript. The manuscript will undergo copyediting, typesetting, and review of the resulting proof before it is published in its final citable form. Please note that during the production process errors may be discovered which could affect the content, and all legal disclaimers that apply to the journal pertain.
References
- 1.Bern HA. The fragile fetus. Advances in Modern Environmental Toxicology. In: Colborn T, Clement C, editors. Chemically-Induced Alterations in Sexual and Functional Development :The Wildlife/Human Connection. XXI. Princeton, NJ: Princeton Scientific Publishing Co; 1992. pp. 9–15. [Google Scholar]
- 2.Newbold R. Cellular and molecular effects of developmental exposure to diethylstilbestrol: implications for other environmental estrogens. Environ Health Perspect. 1995;103 (Suppl 7):83–7. doi: 10.1289/ehp.95103s783. [DOI] [PMC free article] [PubMed] [Google Scholar]
- 3.Newbold RR, Padilla-Banks E, Jefferson WN. Adverse effects of the model environmental estrogen diethylstilbestrol are transmitted to subsequent generations. Endocrinology. 2006;147(6 Suppl):S11–7. doi: 10.1210/en.2005-1164. [DOI] [PubMed] [Google Scholar]
- 4.NIH. DES Research Update: Current Knowledge, Future Directions. Bethesda: National Institutes of Health; 1999. [Google Scholar]
- 5.Colborn T, Clement C, editors. Chemically-Induced Alterations in Sexual and Functional Development: The Wildlife/Human Connection. Princeton, NJ: Princeton Scientific Publishing Company, Inc.; 1992. [Google Scholar]
- 6.NRC. Hormonally Active Agents in the Environment. Washington, D.C.: National Academy Press; 1999. [PubMed] [Google Scholar]
- 7.CFSAN. Redbook 2000 - Toxicological Principles for the Safety Assessment of Food Ingredients. Rockville, MD: U.S. Food and Drug Administration; 2006. [Google Scholar]
- 8.OECD. Draft Guidance Document on Reproductive Toxicity Testing and Assessment. In: Publication No. 43. Paris, France: Organization for Economic Cooperation and Development; 2004.
- 9.Setchell KD, Zimmer-Nechemias L, Cai J, Heubi JE. Exposure of infants to phyto-oestrogens from soy-based infant formula. Lancet. 1997;350:23–7. doi: 10.1016/S0140-6736(96)09480-9. [DOI] [PubMed] [Google Scholar]
- 10.Adlercreutz H. Phyto-oestrogens and cancer. Lancet Oncology. 2002;3(6):364–373. doi: 10.1016/s1470-2045(02)00777-5. [DOI] [PubMed] [Google Scholar]
- 11.Messina M, Kucuk O, Lampe JW. An overview of the health effects of isoflavones with an emphasis on prostate cancer risk and prostate-specific antigen levels. J AOAC Int. 2006;89(4):1121–34. [PubMed] [Google Scholar]
- 12.Sacks FM, Lichtenstein A, Van Horn L, Harris W, Kris-Etherton P, Winston M. Soy protein, isoflavones, and cardiovascular health: an American Heart Association Science Advisory for professionals from the Nutrition Committee. Circulation. 2006;113(7):1034–44. doi: 10.1161/CIRCULATIONAHA.106.171052. [DOI] [PubMed] [Google Scholar]
- 13.Trock BJ, Hilakivi-Clarke L, Clarke R. Meta-analysis of soy intake and breast cancer risk. J Natl Cancer Inst. 2006;98(7):459–71. doi: 10.1093/jnci/djj102. [DOI] [PubMed] [Google Scholar]
- 14.Messina MJ, Wood CE. Soy isoflavones, estrogen therapy, and breast cancer risk: Analysis and commentary. Nutr J. 2008;7(1):17. doi: 10.1186/1475-2891-7-17. [DOI] [PMC free article] [PubMed] [Google Scholar]
- 15.Williamson-Hughes PS, Flickinger BD, Messina MJ, Empie MW. Isoflavone supplements containing predominantly genistein reduce hot flash symptoms: a critical review of published studies. Menopause. 2006;13(5):831–9. doi: 10.1097/01.gme.0000227330.49081.9e. [DOI] [PubMed] [Google Scholar]
- 16.Duffy C, Perez K, Partridge A. Implications of phytoestrogen intake for breast cancer. CA Cancer J Clin. 2007;57(5):260–77. doi: 10.3322/CA.57.5.260. [DOI] [PubMed] [Google Scholar]
- 17.Cederroth CR, Vinciguerra M, Gjinovci A, Kuhne F, Klein M, Cederroth M, et al. Dietary phytoestrogens activate AMP-activated protein kinase with improvement in lipid and glucose metabolism. Diabetes. 2008;57(5):1176–85. doi: 10.2337/db07-0630. [DOI] [PubMed] [Google Scholar]
- 18.Orgaard A, Jensen L. The effects of soy isoflavones on obesity. Exp Biol Med. 2008;233(9):1066–80. doi: 10.3181/0712-MR-347. [DOI] [PubMed] [Google Scholar]
- 19.Thigpen JE, Haseman JK, Saunders H, Locklear J, Caviness G, Grant M, et al. Dietary factors affecting uterine weights of immature CD-1 mice used in uterotrophic bioassays. Cancer Detect Prev. 2002;26(5):381–93. doi: 10.1016/s0361-090x(02)00122-8. [DOI] [PubMed] [Google Scholar]
- 20.Dang ZC, Audinot V, Papapoulos SE, Boutin JA, Lowik CW. Peroxisome proliferator-activated receptor gamma (PPARgamma ) as a molecular target for the soy phytoestrogen genistein. J Biol Chem. 2003;278(2):962–7. doi: 10.1074/jbc.M209483200. [DOI] [PubMed] [Google Scholar]
- 21.Mezei O, Banz WJ, Steger RW, Peluso MR, Winters TA, Shay N. Soy Isoflavones Exert Antidiabetic and Hypolipidemic Effects through the PPAR Pathways in Obese Zucker Rats and Murine RAW 264.7 Cells. J Nutr. 2003;133(5):1238–43. doi: 10.1093/jn/133.5.1238. [DOI] [PubMed] [Google Scholar]
- 22.Takahashi Y, Lavigne JA, Hursting SD, Chandramouli GV, Perkins SN, Barrett JC, et al. Using DNA microarray analyses to elucidate the effects of genistein in androgen-responsive prostate cancer cells: identification of novel targets. Mol Carcinog. 2004;41(2):108–19. doi: 10.1002/mc.20045. [DOI] [PubMed] [Google Scholar]
- 23.Kim S, Sohn I, Lee YS. Hepatic gene expression profiles are altered by genistein supplementation in mice with diet-induced obesity. J Nutr. 2005;135(1):33–41. doi: 10.1093/jn/135.1.33. [DOI] [PubMed] [Google Scholar]
- 24.Henley DV, Korach KS. Endocrine-disrupting chemicals use distinct mechanisms of action to modulate endocrine system function. Endocrinology. 2006;147(6 Suppl):S25–32. doi: 10.1210/en.2005-1117. [DOI] [PubMed] [Google Scholar]
- 25.Chang EC, Charn TH, Park SH, Helferich WG, Komm B, Katzenellenbogen JA, et al. Estrogen Receptors alpha and beta as determinants of gene expression: influence of ligand, dose, and chromatin binding. Mol Endocrinol. 2008;22(5):1032–43. doi: 10.1210/me.2007-0356. [DOI] [PMC free article] [PubMed] [Google Scholar]
- 26.Kanno J, Onyon L, Peddada S, Ashby J, Jacob E, Owens W. The OECD program to validate the rat uterotrophic bioassay. Phase 2: dose-response studies. Environ Health Perspect. 2003;111(12):1530–49. doi: 10.1289/ehp.5780. [DOI] [PMC free article] [PubMed] [Google Scholar]
- 27.Hsieh CY, Santell RC, Haslam SZ, Helferich WG. Estrogenic effects of genistein on the growth of estrogen receptor-positive human breast cancer (MCF-7) cells in vitro and in vivo [published erratum appears in Cancer Res 1999 Mar 15;59(6):1388] Cancer Research. 1998;58(17):3833–8. [PubMed] [Google Scholar]
- 28.Allred CD, Allred KF, Ju YH, Clausen LM, Doerge DR, Schantz SL, et al. Dietary genistein results in larger MNU-induced, estrogen-dependent mammary tumors following ovariectomy of Sprague-Dawley rats. Carcinogenesis. 2004;25(2):211–8. doi: 10.1093/carcin/bgg198. [DOI] [PubMed] [Google Scholar]
- 29.Allred CD, Allred KF, Ju YH, Virant SM, Helferich WG. Soy diets containing varying amounts of genistein stimulate growth of estrogen-dependent (MCF-7) tumors in a dose-dependent manner. Cancer Research. 2001;61(13):5045–50. [PubMed] [Google Scholar]
- 30.Naciff JM, Jump ML, Torontali SM, Carr GJ, Tiesman JP, Overmann GJ, et al. Gene expression profile induced by 17alpha-ethynyl estradiol, bisphenol A, and genistein in the developing female reproductive system of the rat. Toxicol Sci. 2002;68(1):184–99. doi: 10.1093/toxsci/68.1.184. [DOI] [PubMed] [Google Scholar]
- 31.Naciff JM, Torontali SM, Overmann GI, Carr GJ, Tiesman JP, Daston GP. Evaluation of the gene expression changes induced by 17-alpha-ethynyl estradiol in the immature uterus/ovaries of the rat using high density oligonucleotide arrays. Birth Defects Res B Dev Reprod Toxicol. 2005;74(2):164–84. doi: 10.1002/bdrb.20032. [DOI] [PubMed] [Google Scholar]
- 32.Setchell KD, Gosselin SJ, Welsh MB, Johnston JO, Balistreri WF, Kramer LW, et al. Dietary estrogens--a probable cause of infertility and liver disease in captive cheetahs. Gastroenterology. 1987;93(2):225–33. doi: 10.1016/0016-5085(87)91006-7. [DOI] [PubMed] [Google Scholar]
- 33.East J. The effect of genistein on the fertility of mice. Journal of Endocrinology. 1955;13:94–100. doi: 10.1677/joe.0.0130094. [DOI] [PubMed] [Google Scholar]
- 34.Stob M. Naturally occurring food toxicants: estrogens. In: Rechcigl M Jr, editor. Handbook of Naturally Occurring Food Toxicants: Estrogens. Boca Raton, FL: CRC Press; 1983. pp. 81–100. [Google Scholar]
- 35.Price KR, Fenwick GR. Naturally occurring oestrogens in foods--a review. Food Additives & Contaminants. 1985;2(2):73–106. doi: 10.1080/02652038509373531. [DOI] [PubMed] [Google Scholar]
- 36.Jefferson WN, Couse JF, Padilla-Banks E, Korach KS, Newbold RR. Neonatal exposure to genistein induces estrogen receptor (ER)alpha expression and multioocyte follicles in the maturing mouse ovary: evidence for ERbeta-mediated and nonestrogenic actions. Biol Reprod. 2002;67(4):1285–96. doi: 10.1095/biolreprod67.4.1285. [DOI] [PubMed] [Google Scholar]
- 37.Jefferson WN, Padilla-Banks E, Newbold RR. Adverse Effects on Female Development and Reproduction in CD-1 Mice Following Neonatal Exposure to the Phytoestrogen Genistein at Environmentally Relevant Doses. Biol Reprod. 2005;73(4):798–806. doi: 10.1095/biolreprod.105.041277. [DOI] [PubMed] [Google Scholar]
- 38.Jefferson WN, Padilla-Banks E, Newbold RR. Disruption of the developing female reproductive system by phytoestrogens: genistein as an example. Mol Nutr Food Res. 2007;51(7):832–44. doi: 10.1002/mnfr.200600258. [DOI] [PubMed] [Google Scholar]
- 39.Newbold RR, Banks EP, Bullock B, Jefferson WN. Uterine adenocarcinoma in mice treated neonatally with genistein. Cancer Research. 2001;61(11):4325–8. [PubMed] [Google Scholar]
- 40.Li DK, Daling JR, Mueller BA, Hickok DE, Fantel AG, Weiss NS. Oral contraceptive use after conception in relation to the risk of congenital urinary tract anomalies. Teratology. 1995;51(1):30–6. doi: 10.1002/tera.1420510105. [DOI] [PubMed] [Google Scholar]
- 41.Potter LS. How effective are contraceptives? The determination and measurement of pregnancy rates. Obstetrics and Gynecology. 1996;88(3 Suppl):13S–23S. doi: 10.1016/0029-7844(96)00246-3. [DOI] [PubMed] [Google Scholar]
- 42.USFDA. Guidance for Industry: Labeling for Combined Oral Contraceptives. Rockville, MD: U.S. Department of Health and Human Services, Food and Drug Administration, Center for Drug Evaluation and Research; 2004. [Google Scholar]
- 43.WHO. Medical Eligibility Criteria for Contraceptive Use. 3rd ed. Geneva, Switzerland: Reproductive Health and Research, World Health Organization; 2004. [Google Scholar]
- 44.Kidd KA, Blanchfield PJ, Mills KH, Palace VP, Evans RE, Lazorchak JM, et al. Collapse of a fish population after exposure to a synthetic estrogen. Proc Natl Acad Sci U S A. 2007;104(21):8897–901. doi: 10.1073/pnas.0609568104. [DOI] [PMC free article] [PubMed] [Google Scholar]
- 45.Barkhem T, Carlsson B, Nilsson Y, Enmark E, Gustafsson J, Nilsson S. Differential response of estrogen receptor alpha and estrogen receptor beta to partial estrogen agonists/antagonists. Molecular Pharmacology. 1998;54(1):105–12. doi: 10.1124/mol.54.1.105. [DOI] [PubMed] [Google Scholar]
- 46.Gutendorf B, Westendorf J. Comparison of an array of in vitro assays for the assessment of the estrogenic potential of natural and synthetic estrogens, phytoestrogens and xenoestrogens. Toxicology. 2001;166(1–2):79–89. doi: 10.1016/s0300-483x(01)00437-1. [DOI] [PubMed] [Google Scholar]
- 47.Masutomi N, Shibutani M, Takagi H, Uneyama C, Hirose M. Dietary influence on the impact of ethinylestradiol-induced alterations in the endocrine/reproductive system with perinatal maternal exposure. Reprod Toxicol. 2004;18(1):23–33. doi: 10.1016/j.reprotox.2003.10.004. [DOI] [PubMed] [Google Scholar]
- 48.Takagi H, Shibutani M, Lee KY, Lee HC, Nishihara M, Uneyama C, et al. Lack of modifying effects of genistein on disruption of the reproductive system by perinatal dietary exposure to ethinylestradiol in rats. Reprod Toxicol. 2004;18(5):687–700. doi: 10.1016/j.reprotox.2004.03.002. [DOI] [PubMed] [Google Scholar]
- 49.Timms BG, Howdeshell KL, Barton L, Bradley S, Richter CA, vom Saal FS. Estrogenic chemicals in plastic and oral contraceptives disrupt development of the fetal mouse prostate and urethra. Proc Natl Acad Sci U S A. 2005;102(19):7014–19. doi: 10.1073/pnas.0502544102. [DOI] [PMC free article] [PubMed] [Google Scholar]
- 50.Yasuda Y, Kihara T, Nishimura H. Effect of prenatal treatment with ethinyl estradiol on the mouse uterus and ovary. American Journal of Obstetrics & Gynecology. 1977;127(8):832–6. doi: 10.1016/0002-9378(77)90114-4. [DOI] [PubMed] [Google Scholar]
- 51.Yasuda Y, Kihara T, Nishimura H. Effect of ethinyl estradiol on development of mouse fetuses. Teratology. 1981;23(2):233–9. doi: 10.1002/tera.1420230208. [DOI] [PubMed] [Google Scholar]
- 52.Yasuda Y, Kihara T, Nishimura H. Transplacental effect of ethinyl estradiol on mouse vaginal epithelium. Dev Growth Differ. 1977;19:241–7. doi: 10.1111/j.1440-169X.1977.00241.x. [DOI] [PubMed] [Google Scholar]
- 53.Yasuda Y, Kihara T, Tanimura T. Effect of ethinyl estradiol on the differentiation of mouse fetal testis. Teratology. 1985;32(1):113–8. doi: 10.1002/tera.1420320115. [DOI] [PubMed] [Google Scholar]
- 54.Yasuda Y, Kihara T, Tanimura T, Nishimura H. Gonadal dysgenesis induced by prenatal exposure to ethinyl estradiol in mice. Teratology. 1985;32(2):219–27. doi: 10.1002/tera.1420320210. [DOI] [PubMed] [Google Scholar]
- 55.Yasuda Y, Konish H, Tanimura T. Ovarian follicular cell hyperplasia in fetal mice treated transplacentally with ethinyl estradiol. Teratology. 1987;36(1):35–43. doi: 10.1002/tera.1420360106. [DOI] [PubMed] [Google Scholar]
- 56.Yasuda Y, Konishi H, Matuso T, Tanimura T. Accelerated differentiation in seminiferous tubules of fetal mice prenatally exposed to ethinyl estradiol. Anatomy & Embryology. 1986;174(3):289–99. doi: 10.1007/BF00698779. [DOI] [PubMed] [Google Scholar]
- 57.Yasuda Y, Konishi H, Tanimura T. Leydig cell hyperplasia in fetal mice treated transplacentally with ethinyl estradiol. Teratology. 1986;33(3):281–8. doi: 10.1002/tera.1420330305. [DOI] [PubMed] [Google Scholar]
- 58.Yasuda Y, Ohara I, Konishi H, Tanimura T. Long-term effects on male reproductive organs of prenatal exposure to ethinyl estradiol. American Journal of Obstetrics & Gynecology. 1988;159(5):1246–50. doi: 10.1016/0002-9378(88)90458-9. [DOI] [PubMed] [Google Scholar]
- 59.Delclos KB, Bucci TJ, Lomax LG, Latendresse JR, Warbritton A, Weis CC, et al. Effects of dietary genistein exposure during development on male and female CD (Sprague-Dawley) rats. Reproductive Toxicology. 2001;15:1–17. doi: 10.1016/s0890-6238(01)00177-0. [DOI] [PubMed] [Google Scholar]
- 60.NTP. NTP Technical Report on the Reproductive Dose Range-Finding Toxicity Study of Genistein (CAS No. 446-72-0) Administered in Feed to Sprague-Dawley Rats (Feed Study). Toxicity Report Series No. 79. NIH Publication No. 07-4477. Research Triangle Park, NC: National Institutes of Health, Public Health Service, U.S. Department of Health and Human Services; 2007. [Google Scholar]
- 61.NTP. Multigenerational Reproductive Toxicology Study of Ethinyl Estradiol (CAS No. 57-63-6) in Sprague-Dawley Rats (Feed Study). Report No.: No. 547, NIH Publication No. 07-5888. Research Triangle Park, NC: National Institutes of Health, Public Health Service, U.S. Department of Health and Human Services; 2007. [Google Scholar]
- 62.NTP. Toxicology and Carcinogenesis Study of Ethinyl Estradiol (CAS No. 57-63-6) in Sprague-Dawley Rats (Feed Study). Report No.: No. 548, NIH Publication No. 07-5889. Research Triangle Park, N.C.: National Institutes of Health, Public Health Service, U.S. Department of Health and Human Services; 2007. [Google Scholar]
- 63.NTP. Multigenerational Reproductive Toxicology Study of Genistein (CAS No. 446-72-0) in Sprague-Dawley Rats (Feed Study). Report No.: No. 548, NIH Publication No. 07-5889. Research Triangle Park, N.C.: National Institutes of Health, Public Health Service, U.S. Department of Health and Human Services; 2007. [Google Scholar]
- 64.NTP. Toxicology and Carcinogenesis Study of Genistein (CAS No. 446-72-0) in Sprague-Dawley Rats (Feed Study). Report No.: No. 545, NIH Publication 07-4430. Research Triangle Park, N.C.: National Institutes of Health, Public Health Service, U.S. Department of Health and Human Services; 2007. [Google Scholar]
- 65.Doerge DR, Chang HC, Churchwell MI, Holder CL. Analysis of soy isoflavone conjugation in vitro and in human blood using liquid chromatography-mass spectrometry. Drug Metabolism & Disposition. 2000;28(3):298–307. [PubMed] [Google Scholar]
- 66.Thigpen JE, Setchell KD, Ahlmark KB, Locklear J, Spahr T, Caviness GF, et al. Phytoestrogen content of purified, open- and closed-formula laboratory animal diets. Laboratory Animal Science. 1999;49(5):530–6. [PubMed] [Google Scholar]
- 67.Dunnett CW. A multiple comparison procedure for comparing several treatments with a control. Journal of the American Statistical Association. 1955;50:1096–121. [Google Scholar]
- 68.Holm S. A simple sequentially rejective multiple test procedure. Scand J Stat. 1979;6:65–70. [Google Scholar]
- 69.Kruskal WH, Wallis WA. Use of ranks in one-criterion analysis of variance. J Am Stat Assoc. 1952;47:583–621. [Google Scholar]
- 70.Wilcoxon F. Individual comparisons by ranking methods. Biometrics. 1945;1:80–83. [Google Scholar]
- 71.Cooper RL, Goldman JM. VI. Vaginal cytology. In: Daston G, Kimmel C, editors. An Evaluation and Interpretation of Reproductive Endpoints for Human Health Risk Assessment. Washington, D.C.: International Life Sciences Institute Press; 1999. pp. 42–56. [Google Scholar]
- 72.Jonckheere AR. A distribution-free k-sample test against ordered alternatives. Biometrika. 1954;41:133–45. [Google Scholar]
- 73.Hollander M, Wolfe DA. Nonparametric Statistical Methods. New York: John Wiley and Sons; 1973. [Google Scholar]
- 74.Myers RH, Montgomery DC, Vining GG. Generalized Linear Models: With Applications in Engineering and Sciences. New York: John Wiley and Sons; 2001. [Google Scholar]
- 75.Weibull W. A statistical distribution function of wide applicability. J Appl Mechanics. 1951;18:292–7. [Google Scholar]
- 76.Shirley E. A non-parametric equivalent of Williams’ test for contrasting increasing dose levels of a treatment. Biometrics. 1977;33(2):386–9. [PubMed] [Google Scholar]
- 77.Williams DA. A note on Shirley’s nonparametric test for comparing several dose levels with a zero-dose control. Biometrics. 1986;42:183–6. [PubMed] [Google Scholar]
- 78.Blair RM, Fang H, Branham WS, Hass BS, Dial SL, Moland CL, et al. The estrogen receptor relative binding affinities of 188 natural and xenochemicals: Structural diversity of ligands. Toxicological Sciences. 2000;54(1):138–53. doi: 10.1093/toxsci/54.1.138. [DOI] [PubMed] [Google Scholar]
- 79.Kuiper GG, Carlsson B, Grandien K, Enmark E, Haggblad J, Nilsson S, et al. Comparison of the ligand binding specificity and transcript tissue distribution of estrogen receptors alpha and beta. Endocrinology. 1997;138(3):863–70. doi: 10.1210/endo.138.3.4979. [DOI] [PubMed] [Google Scholar]
- 80.Kuiper GG, Lemmen JG, Carlsson B, Corton JC, Safe SH, van der Saag PT, et al. Interaction of estrogenic chemicals and phytoestrogens with estrogen receptor beta. Endocrinology. 1998;139(10):4252–63. doi: 10.1210/endo.139.10.6216. [DOI] [PubMed] [Google Scholar]
- 81.Holder CL, Churchwell MI, Doerge DR. Quantification of soy isoflavones, genistein and daidzein, and conjugates in rat blood using LC/ES-MS. J Agric Food Chem. 1999;47(9):3764–70. doi: 10.1021/jf9902651. [DOI] [PubMed] [Google Scholar]
- 82.Chang HC, Churchwell MI, Delclos KB, Newbold RR, Doerge DR. Mass spectrometric determination of Genistein tissue distribution in diet-exposed Sprague-Dawley rats. Journal of Nutrition. 2000;130(8):1963–70. doi: 10.1093/jn/130.8.1963. [DOI] [PubMed] [Google Scholar]
- 83.Dusterberg B, Kuhne G, Tauber U. Half-lives in plasma and bioavailability of ethinylestradiol in laboratory animals. Arzneimittelforschung. 1986;36(8):1187–90. [PubMed] [Google Scholar]
- 84.Whitten PL, Patisaul HB. Cross-species and interassay comparisons of phytoestrogen action. Environ Health Perspect. 2001;109 (Suppl 1):5–20. doi: 10.1289/ehp.01109s15. [DOI] [PMC free article] [PubMed] [Google Scholar]
- 85.Doerge DR, Churchwell MI, Chang HC, Newbold RR, Delclos KB. Placental transfer of the soy isoflavone genistein following dietary and gavage administration to Sprague Dawley rats. Reproductive Toxicology. 2001;15(2):105–10. doi: 10.1016/s0890-6238(01)00108-3. [DOI] [PubMed] [Google Scholar]
- 86.Doerge DR, Twaddle NC, Churchwell MI, Newbold RR, Delclos KB. Lactational transfer of the soy isoflavone, genistein, in Sprague-Dawley rats consuming dietary genistein. Reprod Toxicol. 2006;21(3):307–12. doi: 10.1016/j.reprotox.2005.09.007. [DOI] [PubMed] [Google Scholar]
- 87.Pryor JL, Hughes C, Foster W, Hales BF, Robaire B. Critical windows of exposure for children’s health: the reproductive system in animals and humans. Environmental Health Perspectives. 2000;108(Suppl 3):491–503. doi: 10.1289/ehp.00108s3491. [DOI] [PMC free article] [PubMed] [Google Scholar]
- 88.Faber KA, Hughes CL., Jr Dose-response characteristics of neonatal exposure to genistein on pituitary responsiveness to gonadotropin releasing hormone and volume of the sexually dimorphic nucleus of the preoptic area (SDN-POA) in postpubertal castrated female rats. Reproductive Toxicology. 1993;7(1):35–9. doi: 10.1016/0890-6238(93)90007-t. [DOI] [PubMed] [Google Scholar]
- 89.Yang J, Nakagawa H, Tsuta K, Tsubura A. Influence of perinatal genistein exposure on the development of MNU-induced mammary carcinoma in female Sprague-Dawley rats. Cancer Letters. 2000;149(1–2):171–9. doi: 10.1016/s0304-3835(99)00357-2. [DOI] [PubMed] [Google Scholar]
- 90.Nagao T, Yoshimura S, Saito Y, Nakagomi M, Usumi K, Ono H. Reproductive effects in male and female rats of neonatal exposure to genistein. Reproductive Toxicology. 2001;15(4):399–411. doi: 10.1016/s0890-6238(01)00141-1. [DOI] [PubMed] [Google Scholar]
- 91.Foster WG, Younglai EV, Boutross-Tadross O, Hughes CL, Wade MG. Mammary gland morphology in Sprague-Dawley rats following treatment with an organochlorine mixture in utero and neonatal genistein. Toxicol Sci. 2004;77(1):91–100. doi: 10.1093/toxsci/kfg247. [DOI] [PubMed] [Google Scholar]
- 92.Erdman JW, Jr, Badger TM, Lampe JW, Setchell KD, Messina M. Not all soy products are created equal: caution needed in interpretation of research results. J Nutr. 2004;134(5):1229S–33S. doi: 10.1093/jn/134.5.1229S. [DOI] [PubMed] [Google Scholar]
- 93.Allred CD, Allred KF, Ju YH, Goeppinger TS, Doerge DR, Helferich WG. Soy processing influences growth of estrogen-dependent breast cancer tumors in mice. Carcinogenesis. 2004;25(9):1649–57. doi: 10.1093/carcin/bgh178. [DOI] [PubMed] [Google Scholar]
- 94.Twaddle NC, Churchwell MI, Newbold RR, Delclos KB, Doerge DR. Determination using liquid-chromatography-electrospray tandem mass spectroscopy of ethinylestradiol serum pharmacokinetics in adult Sprague-Dawley rats. J Chromatogr B Analyt Technol Biomed Life Sci. 2003;793(2):309–15. doi: 10.1016/s1570-0232(03)00331-3. [DOI] [PubMed] [Google Scholar]
- 95.van den Heuvel MW, van Bragt AJ, Alnabawy AK, Kaptein MC. Comparison of ethinylestradiol pharmacokinetics in three hormonal contraceptive formulations: the vaginal ring, the transdermal patch and an oral contraceptive. Contraception. 2005;72(3):168–74. doi: 10.1016/j.contraception.2005.03.005. [DOI] [PubMed] [Google Scholar]
- 96.Slikker W, Jr, Bailey JR, Newport D, Lipe GW, Hill DE. Placental transfer and metabolism of 17 alpha-ethynylestradiol-17 beta and estradiol-17 beta in the rhesus monkey. J Pharmacol Exp Ther. 1982;223(2):483–9. [PubMed] [Google Scholar]
- 97.Thayer KA, Ruhlen RL, Howdeshell KL, Buchanan DL, Cooke PS, Preziosi D, et al. Altered prostate growth and daily sperm production in male mice exposed prenatally to subclinical doses of 17alpha-ethinyl oestradiol. Hum Reprod. 2001;16(5):988–96. doi: 10.1093/humrep/16.5.988. [DOI] [PubMed] [Google Scholar]
- 98.Nilsson S, Nygren KG, Johansson ED. Ethinyl estradiol in human milk and plasma after oral administration. Contraception. 1978;17(2):131–9. doi: 10.1016/0010-7824(78)90069-0. [DOI] [PubMed] [Google Scholar]
- 99.Betrabet SS, Shikary ZK, Toddywalla VS, Patel D, Vaidya P, Saxena BN. ICMR Task Force Study on hormonal contraception. Biological activity of ethinyl estradiol present in the breast milk. Contraception. 1986;34(2):169–75. doi: 10.1016/0010-7824(86)90069-7. [DOI] [PubMed] [Google Scholar]
- 100.Cargill DI, Meli A, Giannina T, Steinetz BG. Secretion of ethynylestradiol and its 3-cyclopentyl ether in the milk of lactating rats. Proc Soc Exp Biol Med. 1969;131(4):1362–65. doi: 10.3181/00379727-131-34107. [DOI] [PubMed] [Google Scholar]
- 101.Wade GN, Schneider JE. Metabolic fuels and reproduction in female mammals. Neuroscience & Biobehavioral Reviews. 1992;16(2):235–72. doi: 10.1016/s0149-7634(05)80183-6. [DOI] [PubMed] [Google Scholar]
- 102.Toth MJ, Poehlman ET, Matthews DE, Tchernof A, MacCoss MJ. Effects of estradiol and progesterone on body composition, protein synthesis, and lipoprotein lipase in rats. Am J Physiol Endocrinol Metab. 2001;280(3):E496–501. doi: 10.1152/ajpendo.2001.280.3.E496. [DOI] [PubMed] [Google Scholar]
- 103.Wallen WJ, Belanger MP, Wittnich C. Sex hormones and the selective estrogen receptor modulator tamoxifen modulate weekly body weights and food intakes in adolescent and adult rats. J Nutr. 2001;131(9):2351–7. doi: 10.1093/jn/131.9.2351. [DOI] [PubMed] [Google Scholar]
- 104.Casanova M, You L, Gaido KW, Archibeque-Engle S, Janszen DB, Heck HA. Developmental effects of dietary phytoestrogens in Sprague-Dawley rats and interactions of genistein and daidzein with rat estrogen receptors alpha and beta in vitro. Toxicological Sciences. 1999;51(2):236–44. doi: 10.1093/toxsci/51.2.236. [DOI] [PubMed] [Google Scholar]
- 105.Naaz A, Yellayi S, Zakroczymski MA, Bunick D, Doerge DR, Lubahn DB, et al. The soy isoflavone genistein decreases adipose deposition in mice. Endocrinology. 2003;144(8):3315–20. doi: 10.1210/en.2003-0076. [DOI] [PubMed] [Google Scholar]
- 106.Kim HK, Nelson-Dooley C, Della-Fera MA, Yang JY, Zhang W, Duan J, et al. Genistein decreases food intake, body weight, and fat pad weight and causes adipose tissue apoptosis in ovariectomized female mice. J Nutr. 2006;136(2):409–14. doi: 10.1093/jn/136.2.409. [DOI] [PubMed] [Google Scholar]
- 107.Kishida T, Mizushige T, Ohtsu Y, Ishikawa S, Nagamoto M, Izumi T, et al. Dietary soy isoflavone-aglycone lowers food intake in female rats with and without ovariectomy. Obesity (Silver Spring) 2008;16(2):290–7. doi: 10.1038/oby.2007.68. [DOI] [PubMed] [Google Scholar]
- 108.Rozman KK, Bhatia J, Calafat AM, Chambers C, Culty M, Etzel RA, et al. NTP-CERHR expert panel report on the reproductive and developmental toxicity of genistein. Birth Defects Res B Dev Reprod Toxicol. 2006;77(6):485–638. doi: 10.1002/bdrb.20087. [DOI] [PMC free article] [PubMed] [Google Scholar]
- 109.McClain RM, Wolz E, Davidovich A, Edwards J, Bausch J. Reproductive safety studies with genistein in rats. Food Chem Toxicol. 2007;45(8):1319–32. doi: 10.1016/j.fct.2007.01.009. [DOI] [PubMed] [Google Scholar]
- 110.Fusani L, Della Seta D, Dessi-Fulgheri F, Farabollini F. Altered reproductive success in rat pairs after environmental-like exposure to xenoestrogen. Proc Biol Sci. 2007;274(1618):1631–6. doi: 10.1098/rspb.2007.0064. [DOI] [PMC free article] [PubMed] [Google Scholar]
- 111.Clark RL. Endpoints of reproductive system development. In: Daston G, Kimmel C, editors. An Evaluation and Interpretation of Reproductive Endpoints for Human Health Risk Assessment. Washington, D.C.: International Life Sciences Institute Press; 1999. pp. 10–27. [Google Scholar]
- 112.McIntyre BS, Barlow NJ, Foster PMD. Androgen-mediated development in male rat offspring exposed to flutamide in utero: Permanence and correlation of early postnatal changes in anogenital distance and nipple retention with malformations in androgen-dependent tissues. Toxicological Sciences. 2001;62(2):236–49. doi: 10.1093/toxsci/62.2.236. [DOI] [PubMed] [Google Scholar]
- 113.Zehr JL, Gans SE, McClintock MK. Variation in reproductive traits is associated with short anogenital distance in female rats. Dev Psychobiol. 2001;38(4):229–38. doi: 10.1002/dev.1017. [DOI] [PubMed] [Google Scholar]
- 114.Bowman CJ, Barlow NJ, Turner KJ, Wallace DG, Foster PM. Effects of in utero exposure to finasteride on androgen-dependent reproductive development in the male rat. Toxicol Sci. 2003;74(2):393–406. doi: 10.1093/toxsci/kfg128. [DOI] [PubMed] [Google Scholar]
- 115.Weber KS, Setchell KD, Lephart ED. Maternal and perinatal brain aromatase: effects of dietary soy phytoestrogens. Brain Research Developmental Brain Research. 2001;126(2):217–21. doi: 10.1016/s0165-3806(00)00138-3. [DOI] [PubMed] [Google Scholar]
- 116.Levy JR, Faber KA, Ayyash L, Hughes CL. The effect of prenatal exposure to the phytoestrogen genistein on sexual differentiation in rats. Experimental Biology & Medicine. 1995;208(1):60–6. doi: 10.3181/00379727-208-43832. [DOI] [PubMed] [Google Scholar]
- 117.Kang KS, Che JH, Lee YS. Lack of adverse effects in the F1 offspring maternally exposed to genistein at human intake dose level. Food & Chemical Toxicology. 2002;40(1):43–51. doi: 10.1016/s0278-6915(01)00091-6. [DOI] [PubMed] [Google Scholar]
- 118.Lamartiniere CA, Zhang JX, Cotroneo MS. Genistein studies in rats: potential for breast cancer prevention and reproductive and developmental toxicity. American Journal of Clinical Nutrition. 1998;68(6 Suppl):1400–5S. doi: 10.1093/ajcn/68.6.1400S. [DOI] [PubMed] [Google Scholar]
- 119.Badger TM, Ronis MJJ, Hakkak R. Developmental effects and health aspects of soy protein isolate, casein, and whey in male and female rats. Internatl J Tox. 2001;20:165–174. doi: 10.1080/109158101317097755. [DOI] [PubMed] [Google Scholar]
- 120.You L, Casanova M, Bartolucci EJ, Fryczynski MW, Dorman DC, Everitt JI, et al. Combined effects of dietary phytoestrogen and synthetic endocrine-active compound on reproductive development in Sprague-Dawley rats: Genistein and methoxychlor. Toxicological Sciences. 2002;66(1):91–104. doi: 10.1093/toxsci/66.1.91. [DOI] [PubMed] [Google Scholar]
- 121.Lewis RW, Brooks N, Milburn GM, Soames A, Stone S, Hall M, et al. The effects of the phytoestrogen genistein on the postnatal development of the rat. Toxicol Sci. 2003;71(1):74–83. doi: 10.1093/toxsci/71.1.74. [DOI] [PubMed] [Google Scholar]
- 122.Nikaido Y, Danbara N, Tsujita-Kyutoku M, Yuri T, Uehara N, Tsubura A. Effects of prepubertal exposure to xenoestrogen on development of estrogen target organs in female CD-1 mice. In Vivo. 2005;19(3):487–94. [PubMed] [Google Scholar]
- 123.Nikaido Y, Yoshizawa K, Danbara N, Tsujita-Kyutoku M, Yuri T, Uehara N, et al. Effects of maternal xenoestrogen exposure on development of the reproductive tract and mammary gland in female CD-1 mouse offspring. Reprod Toxicol. 2004;18(6):803–11. doi: 10.1016/j.reprotox.2004.05.002. [DOI] [PubMed] [Google Scholar]
- 124.Lamartiniere CA, Moore JB, Brown NM, Thompson R, Hardin MJ, Barnes S. Genistein suppresses mammary cancer in rats. Carcinogenesis. 1995;16:2833–40. doi: 10.1093/carcin/16.11.2833. [DOI] [PubMed] [Google Scholar]
- 125.Murrill WB, Brown NM, Zhang JX, Manzolillo PA, Barnes S, Lamartiniere CA. Prepubertal genistein exposure suppresses mammary cancer and enhances gland differentiation in rats. Carcinogenesis. 1996;17(7):1451–7. doi: 10.1093/carcin/17.7.1451. [DOI] [PubMed] [Google Scholar]
- 126.Kouki T, Kishitake M, Okamoto M, Oosuka I, Takebe M, Yamanouchi K. Effects of neonatal treatment with phytoestrogens, genistein and daidzein, on sex difference in female rat brain function: estrous cycle and lordosis. Horm Behav. 2003;44(2):140–5. doi: 10.1016/s0018-506x(03)00122-3. [DOI] [PubMed] [Google Scholar]
- 127.Fritz WA, Coward L, Wang J, Lamartiniere CA. Dietary genistein: perinatal mammary cancer prevention, bioavailability and toxicity testing in the rat. Carcinogenesis. 1998;19(12):2151–8. doi: 10.1093/carcin/19.12.2151. [DOI] [PubMed] [Google Scholar]
- 128.Awoniyi CA, Roberts D, Veeramachaneni DN, Hurst BS, Tucker KE, Schlaff WD. Reproductive sequelae in female rats after in utero and neonatal exposure to the phytoestrogen genistein. Fertility & Sterility. 1998;70(3):440–7. doi: 10.1016/s0015-0282(98)00185-x. [DOI] [PubMed] [Google Scholar]
- 129.Lamartiniere CA, Murrill WB, Manzolillo PA, Zhang JX, Barnes S, Zhang X, et al. Genistein alters the ontogeny of mammary gland development and protects against chemically-induced mammary cancer in rats. Proc Soc Exp Biol Med. 1998;217(3):358–64. doi: 10.3181/00379727-217-44245. [DOI] [PubMed] [Google Scholar]
- 130.Doerge DR, Twaddle NC, Banks EP, Jefferson WN, Newbold RR. Pharmacokinetic analysis in serum of genistein administered subcutaneously to neonatal mice. Cancer Letters. 2002;184(1):21–7. doi: 10.1016/s0304-3835(02)00200-8. [DOI] [PubMed] [Google Scholar]
- 131.Eldridge JC, Wetzel LT, Tyrey L. Estrous cycle patterns of Sprague-Dawley rats during acute and chronic atrazine administration. Reproductive Toxicology. 1999;13(6):491–9. doi: 10.1016/s0890-6238(99)00056-8. [DOI] [PubMed] [Google Scholar]
- 132.Matt DW, Sarver PL, Lu JK. Relation of parity and estrous cyclicity to the biology of pregnancy in aging female rats. Biol Reprod. 1987;37(2):421–30. doi: 10.1095/biolreprod37.2.421. [DOI] [PubMed] [Google Scholar]
- 133.LeFevre J, McClintock MK. Isolation accelerates reproductive senescence and alters its predictors in female rats. Hormones & Behavior. 1991;25(2):258–272. doi: 10.1016/0018-506x(91)90055-m. [DOI] [PubMed] [Google Scholar]
- 134.Rubin BS. Hypothalamic alterations and reproductive aging in female rats: evidence of altered luteinizing hormone-releasing hormone neuronal function. Biology of Reproduction. 2000;63(4):968–76. doi: 10.1095/biolreprod63.4.968. [DOI] [PubMed] [Google Scholar]
- 135.Wise PM, Krajnak KM, Kashon ML. Menopause: the aging of multiple pacemakers. Science. 1996;273(5271):67–70. doi: 10.1126/science.273.5271.67. [DOI] [PubMed] [Google Scholar]
- 136.Weiss G, Skurnick JH, Goldsmith LT, Santoro NF, Park SJ. Menopause and hypothalamic-pituitary sensitivity to estrogen. JAMA. 2004;292(24):2991–6. doi: 10.1001/jama.292.24.2991. [DOI] [PubMed] [Google Scholar]