Abstract
Differences in breast tissue composition are important determinants in assessing risk, identifying disease in images and following changes over time. This paper presents an algorithm for tissue classification that separates breast tissue into its three primary constituents of skin, fat and glandular tissue. We have designed and built a dedicated breast CT scanner. Fifty-five normal volunteers and patients with mammographically identified breast lesions were scanned. Breast CT voxel data were filtered using a 5 pt median filter and the image histogram was computed. A two compartment Gaussian fit of histogram data was used to provide an initial estimate of tissue compartments. After histogram analysis, data were input to region-growing algorithms and classified as to belonging to skin, fat or gland based on their value and architectural features. Once tissues were classified, a more detailed analysis of glandular tissue patterns and a more quantitative analysis of breast composition was made. Algorithm performance assessment demonstrated very good or excellent agreement between algorithm and radiologist observers in 97.7% of the segmented data. We observed that even in dense breasts the fraction of glandular tissue seldom exceeded 50%. For most individuals the composition is better characterized as being a 70% (fat)−30% (gland) composition than a 50% (fat)−50% (gland) composition.
Keywords: breast, computed tomography, segmentation, classification
I. INTRODUCTION
Breast cancer is a high-prevalence disease that will affect the lives of one of every eight women in the United States. Breast cancer arises in the glandular and ductal tissues and generally becomes detectable by mammography when the size of the lesion approaches 1 cm in size.1 Early identification of breast cancer is the most important consideration determining prognosis. X-ray mammography is the principal screening tool for breast cancer detection world-wide.2–4
A difficulty with mammography is the superposition of overlaying glandular structures, which can obscure visualization of a breast tumor. Conventional computed tomography (CT), while producing adequate images of the breast, lacks the fine detail in spatial resolution and slice thickness to optimally identify breast tissues. Conventional CT also suffers from the additional radiation dose to the chest organs and artifacts from cardiac and respiratory motion. Magnetic resonance imaging (MRI) shows promise for specialized breast imaging and biopsy guidance5–8 but availability and cost considerations limit its widespread application. Producing tomographic breast images with a dedicated x-ray breast computed tomography (breast CT) scanner can eliminate the influence of overlapping tissues.
Breast CT also provides high-quality volume data that enhances visualization of breast glandular tissue and architecture compared to other breast imaging methods9–12 providing mammographers with a clear view of breast architecture and glandular tissues. Breast CT data also lends itself to detailed quantitative analysis of breast tissue composition and structural organization. Differences in breast tissue composition are important determinants in assessing risk, identifying disease in images and following changes over time.13–22
I.A. Breast tissue architecture
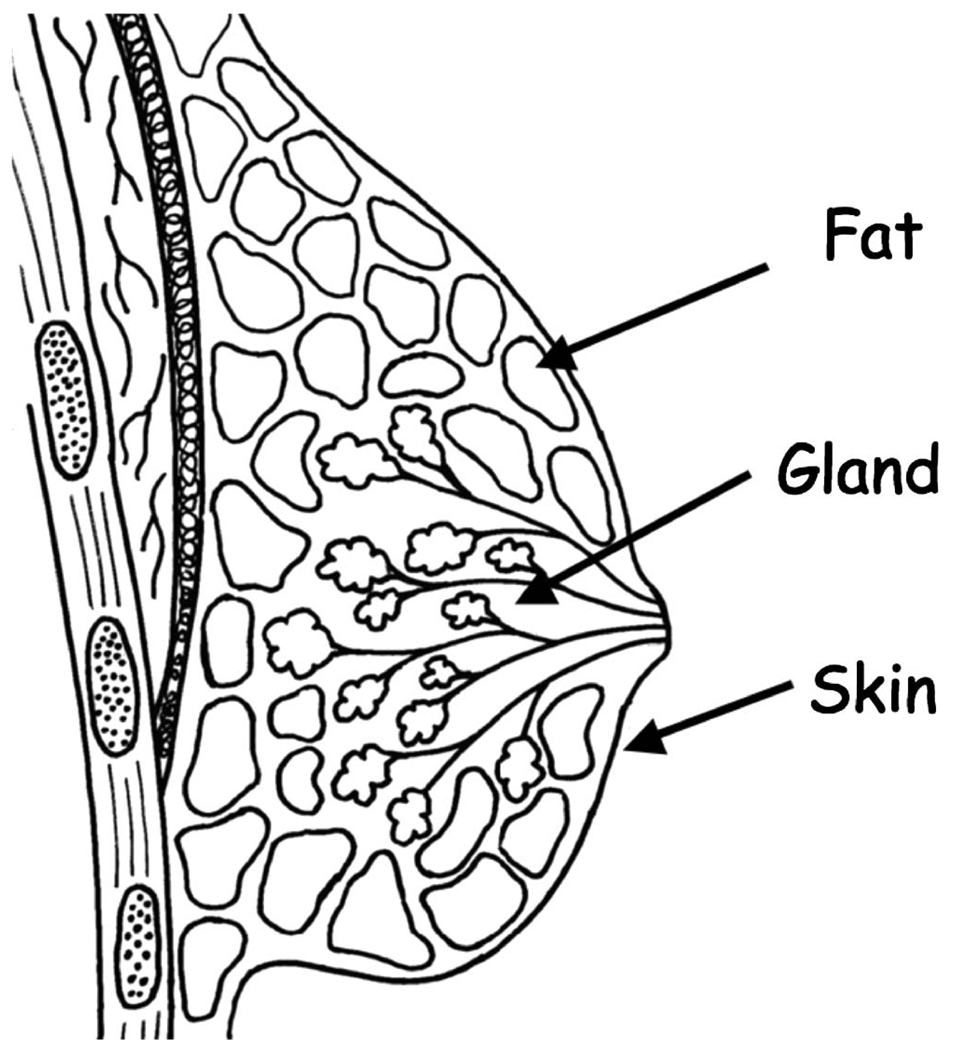
The normal breast has a complex tree-like architecture consisting of glandular tissue supported by a network of connective tissues cushioned by fat and contained within a shroud of skin (Fig. 1). At puberty the rapid proliferation of glandular tissues gives the breast its characteristic conical shape. With age, especially after menopause, the relative distribution of breast tissues reflects the transition from predominately glandular tissues to predominately fatty replacement tissues. Connective tissues also slacken contributing to an overall reduction in structural support with age.
FIG 1.
Three component model of breast tissues (fat, skin, gland).
I.B. Breast tissue composition
Even though the breast is composed of a variety of tissues (e.g., skin, fat, gland), a commonly held assumption in mammography is that the breast is composed of approximately 50% fat and 50% glandular tissue.12 This assumption, while not precise, serves as the basis for dosimetry estimates and technique chart optimization. Mammography does not readily permit tissue classification due to the significant superposition problem inherent in a projection imaging technique.
Although various approaches have been tried to develop computer algorithms to classify breast tissues,23–26 and identify micro-calcifications and tumors,27–29 accurate information regarding breast tissue composition has been difficult to obtain. Breast tumors furthermore exhibit similar radiographic characteristics to glandular tissue. Even so there have been attempts to estimate breast tissue composition by analysis of mammograms30–37 and MRI data.5–8,38
Breast CT is capable of producing high-resolution volumetric images of pendant breasts.10 Breast CT images are subjectively of higher quality than the images from projection mammography.39 Breast CT images provide both high spatial and contrast resolution that facilitates identification and classification of breast tissue.
I.C. Breast tissue classification
Analysis of breast tissue raises the question of defining how many components are sufficient to describe the tissue in question. It is common to approximate the breast as partially homogeneous wherein the fat and glandular tissue have one set of mechanical properties and the skin a second.40 For this work, we use a classification model of the breast consisting of three tissues: skin, fat, and glandular tissue. One method of classification is intensity (or CT number) thresholding. For the breast this is not sufficient as our measurements demonstrate that skin and glandular tissue have similar CT values.
In this article, we present an automated algorithm for tissue classification that separates breast tissue into its three primary constituents of skin, fat and glandular tissue. Once tissues have been classified, a more detailed analysis of glandular tissue patterns and a more quantitative analysis of breast composition may be made. After a discussion of the methodology, we present data from a series of patients to demonstrate algorithm performance.
II. METHODS
II.A. Breast CT scanner
A dedicated breast CT scanner has been developed that produces high-resolution volumetric breast images.9–12,41 Each breast was scanned individually without compression in the pendant position while the patient lay prone in the scanning table. Patient scans were made at 80 kVp (0.5 mm Al HVL) using 50–120 mAs depending on breast size. Scanning acquired approximately 500 projection images through a complete scanner gantry revolution over a period of 16 s. The average glandular dose was approximately 6.4 mGy per breast, comparable to a standard two-view mammogram.11
II.B. Image reconstruction
Acquisition image data were reconstructed using a modified Feldkamp cone-beam algorithm42 resulting in a series of approximately 300 5122 image slices depending on breast size with a nominal resolution of 250 µm by 250 µm by 300 µm. The resulting image slices were embedded into a 5123 cubic volume. Variations in CT number across the field of view and through the volume due to cone-beam artifacts required normalization between slices by aligning the pixel histograms for each slice. Future enhancement in reconstruction software including improved field flattening correction and regional analysis should eliminate these difficulties.
Volume data were analyzed and displayed on a specially designed interactive volume workstation. Volume data could be viewed as individual slices, thick slices and volume rendered images using blending, maximum-intensity-projection and x-ray projection algorithms. Interactive review or original and segmented data was possible for the entire volume. Classification analysis was performed offline.
II.C. Patient scanning
All patient studies were performed according to protocols approved by the institutional review board with informed consent obtained from each subject. The study was conducted in compliance with HIPAA regulations. Typical uncompressed original breast slice images are shown in Fig. 2.
FIG 2.
Selected original mid-breast images from breast data CT scan for a typical breast.
We used the following mammography terminology for breast density: fatty replaced (0%–25% glandular tissue), scattered fibroglandular density (25%–50% glandular tissue), heterogeneously dense (50%–75% glandular tissue) and dense (over 75% glandular tissue). The classifications were based on mammographically assessed breast density and for our subject distribution was fatty replaced (4.5%), scattered fibroglandular (44.3%), heterogeneously dense (23.9%) and dense (27.3%).
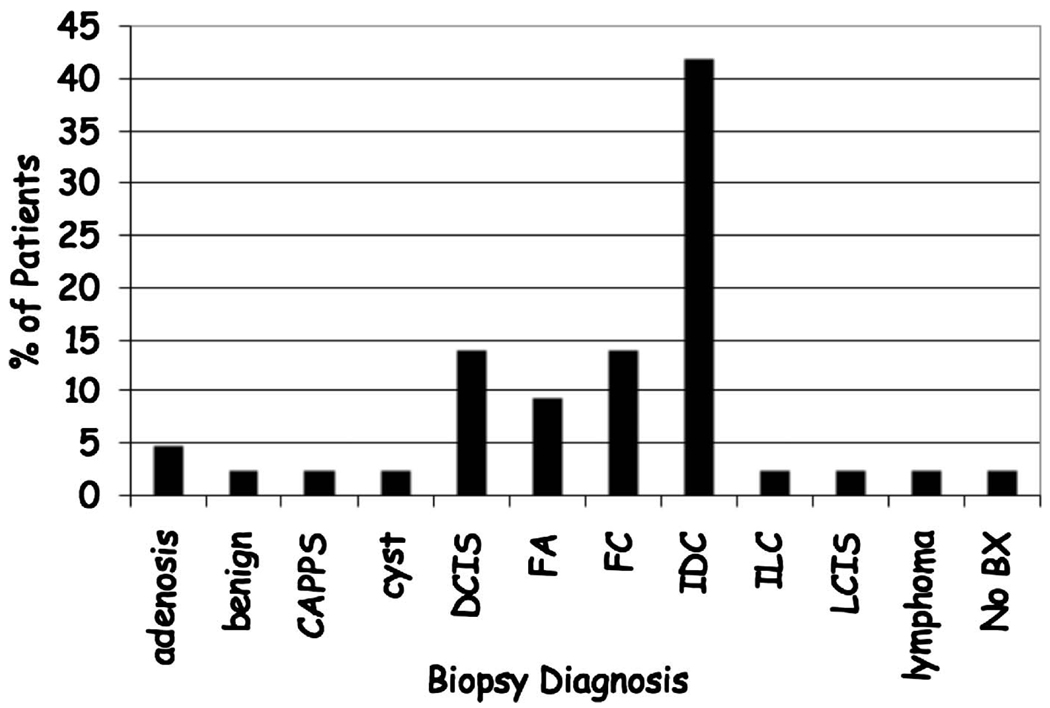
An initial pilot study imaged ten normal volunteers. Subsequently, we imaged 45 women with mammographically identified suspicious lesions who underwent bilateral, unenhanced, dedicated breast CT imaging prior to core biopsy. The same imaging techniques were used with both sets of individuals. All subjects were asked to hold their breath during the 16 s scan time to minimize motion. The distribution of biopsy confirmed diagnoses is shown in Fig. 3.
FIG 3.
Distribution of biopsy confirmed breast diagnoses. Benign lesions (Adenosis; Columnar alteration with prominent apical snouts and secretions (CAPSS); fibrocystic changes (FC); fibroadenoma (FA); lobular carcinoma in situ (LCIS); benign) and Malignant Lesions (ductal carcinoma in situ (DCIS); invasive ductal carcinoma (IDC); invasive lobular carcinoma (ILC); lymphoma).
The breast CT images were compared to images from conventional film screen mammography using the craniocaudal and mediolateral oblique views by an experienced mammographer to assess overall clinical image quality.39 No other diagnostic imaging studies were included in the comparison. An estimate of breast density was obtained from the mammography report for comparison to breast CT estimates of percent glandular tissue. Breast implants posed additional difficulties and patients with them were excluded from the present analysis.
II.D. Tissue classification
Voxel data were input to an automated segmentation algorithm for classification into skin, fat and glandular tissues. Image slices were filtered using a 5 pt median filter and an image slice histogram was computed. Since skin and glandular tissue had similar CT values we used a two compartment Gaussian fit of slice histogram data to separate fat and skin/ glandular tissue. Skin and glandular tissue were differentiated based on their geographic location using the general assumption that skin is always exterior and that gland is interior.
The Gaussian fit provided an initial estimate of the different tissue compartments in the slice and provided a threshold voxel value. After the histogram classifier, a seed point was identified for input to region-growing algorithms. Voxels in each slice were classified as belonging to skin, fat or gland based on their voxel values and architectural features.
The specific details of the tissue classification algorithm are as follows:
Three-dimensional voxel data were obtained from the breast CT scanner.
Each 5122 image slice was filtered using a 5 pt median filter
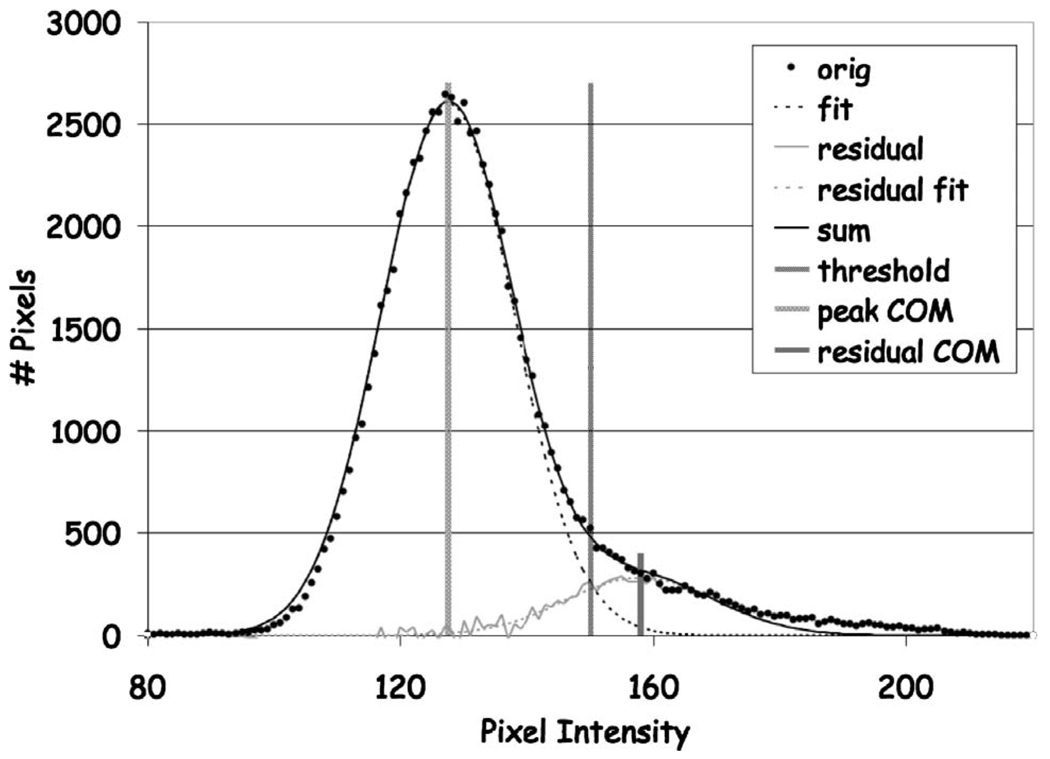
The image slice histogram was computed (Fig. 4).
The histogram peak maximum value was determined.
- The 1st histogram peak was fit using a Gaussian curve of the form
(1) The histogram residual was computed by subtracting the Gaussian fit curve.
The center of mass of the residual was computed and compared to the center of mass of the Gaussian peak to determine the predominant tissue type present (i.e., gland or fat).
An initial segmentation threshold was set at 0.05 of the Gaussian peak maximum on the residual side of the peak based on the center-of-mass location for the Gaussian peak and the center of mass of the residual.
Histogram values under the Gaussian peak were assigned to either fat or gland based on the relative center-of-mass locations to accommodate both dense and fatty breast compositions.
A seed point on the skin surface was automatically identified by searching inward from the border of the image until the first voxel having a skin value based on the histogram analysis was identified. During the search, image voxels exterior to the breast and outside the histogram tissue values were identified and flagged.
A region growing algorithm beginning at the skin seed point identified the skin voxel values as determined by the skin/gland histogram segmentation threshold.
After the skin region growing was completed, a new seed point was identified in the fat pixels adjacent to the skin segmented voxels and interior to the skin by searching for an arbitrary voxel value corresponding to a value assigned to fat based on the histogram. The particular location of the seed point was not crucial other than providing a starting point for the region growing algorithm.
A second region growing algorithm beginning at the fat seed point identified all fat interior voxels using values determined by the fat histogram segmentation threshold.
After identification of voxels corresponding to skin and fat the remaining unassigned interior voxels were assigned to gland.
Upon completion, the algorithm automatically compared the classification tissue type (skin, fat, gland) of each voxel to the original histogram. In situations where the voxel value was incorrectly assigned, such as might occur if voxels representing fatty tissue are interior to a large glandular structure, the voxel values were reassigned automatically by the algorithm to the correct tissue type as defined by the histogram and threshold to yield the final classification (Fig. 5). Since glandular tissue was interior and skin was exterior this was a reasonable strategy to refine the segmentation. However, since skin and glandular tissue have similar values it was possible for misclassification to occur near skin/gland boundaries such as might be found near the nipple. We are exploring additional strategies to address this issue.
The number of voxels for each tissue type was computed for each individual slice and then summed for all breast CT slices in the volume to obtain global tissue fractional composition in each breast.
FIG 4.
Voxel histogram for image slice used for tissue classification showing the original histogram and the Gaussian fit curves for the fat and skingland components plus the automatically determined threshold value.
FIG 5.
Corresponding segmented images from slices shown in Fig. 2. Note the excellent agreement between the images and original breast CT slices.
II.E. Segmentation validation
Algorithm performance was validated using example slices derived from actual breast CT data. We assessed algorithm performance using two approaches, one to assess performance in the presence of noise and one to assess accuracy of classification:
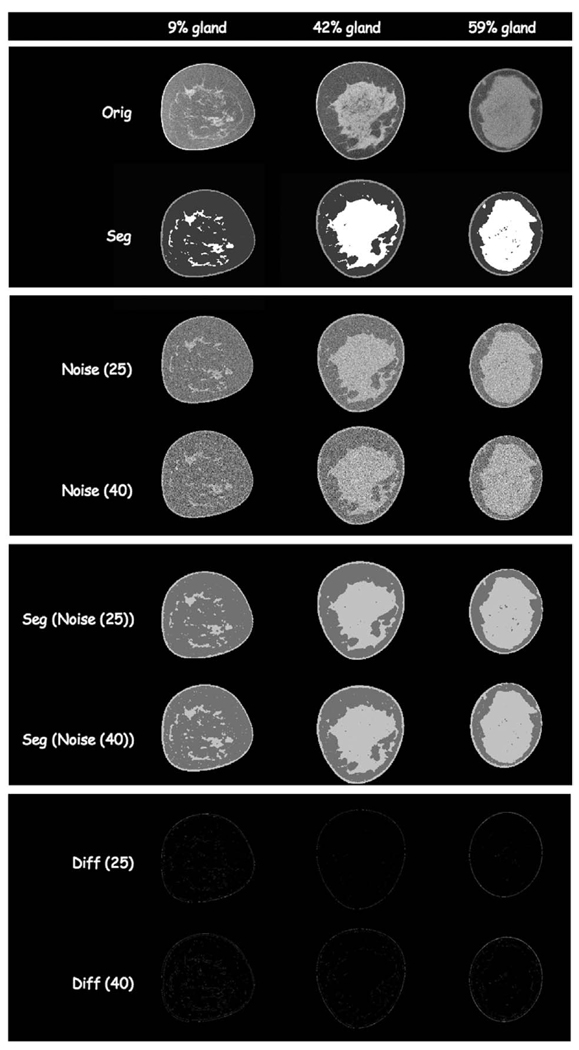
First, we selected five mid-breast CT slices and their corresponding segmented slices, from studies covering the range of breast densities (% glandular fraction) [2-fatty replaced (0%–25% glandular tissue); 2-scattered fibroglandular dense (25%–50% glandular tissue); and 1-heterogeneously dense (50–75% glandular tissue)] in our patient population. The segmented slice data were used as reference standard images to assess algorithm performance using a realistic breast tissue architecture. Next, we set the pixels in the segmented images to values corresponding to skin, fat and gland tissue as determined from region-of-interest measurements in the original breast CT breast slices for each tissue type. The skin and gland tissue typically had a value of 152±9 CT units while the fat had a value of 126±7 CT units for a net difference of approximately 26 CT units. Finally we added increasing amounts of Gaussian noise to each slice (e.g., mean values of the noise distribution were: 10, 15, 20, 25, 30, 40, 50 CT units).
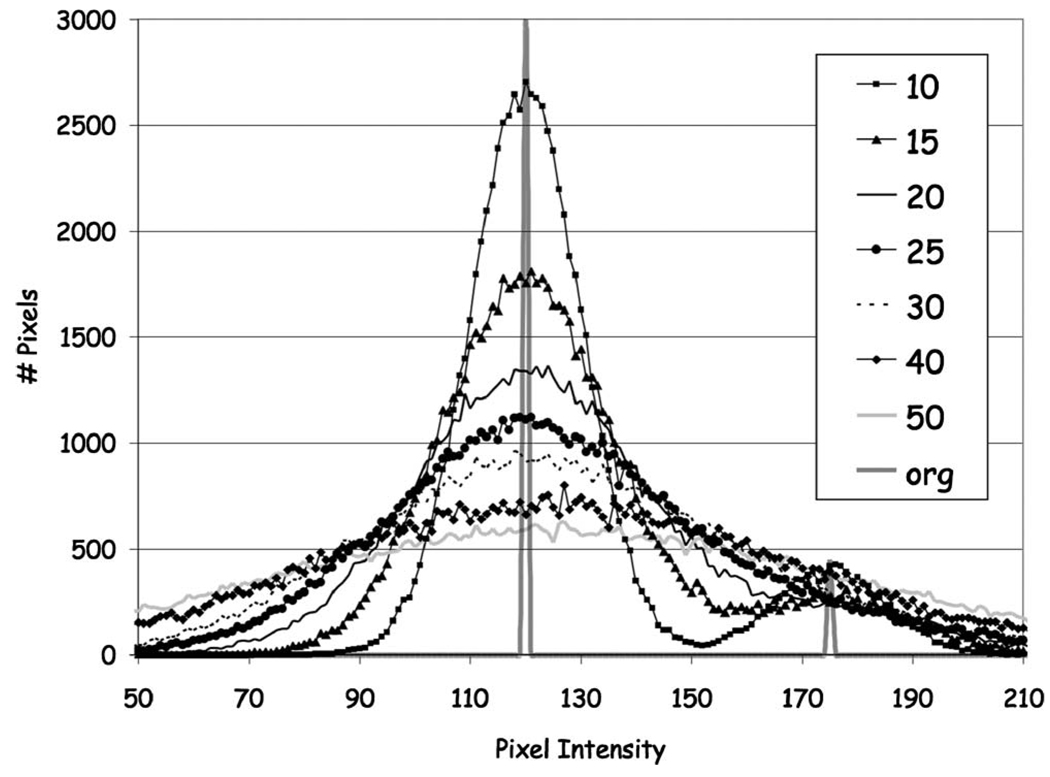
Different noise levels had the effect of broadening the pixel intensity distribution (Fig. 6). The range of pixel values for each tissue in these test cases covered, and generally exceeded, those found in the original breast CT images permitting us to assess algorithm performance in a noisy environment. Finally, the classification algorithm was applied to these noise added images.
FIG 6.
Histogram distribution of pixel intensity in original slice and test cases derived from segmented slice with Gaussian noise added. Gaussian noise with mean CT number values ranging from 10 to 50 were segmented with the algorithm. The segmented original image served as the reference image to compare algorithm performance. Image histograms demonstrate varying degrees of pixel distribution across the images.
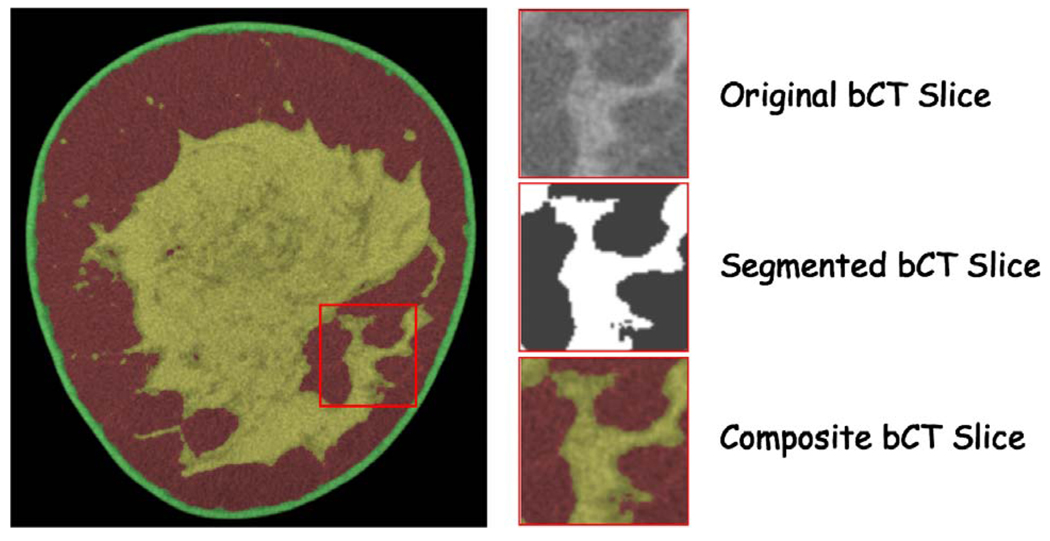
Our second approach initially considered using a skilled mammographer to manually outline the breast glandular tissues. However, the significant time (∼30 min/slice) required precluded this approach for practical considerations. Instead, we used an alternate approach based on a series of subimages taken from the original and segmented breast CT data that were presented to the radiologist (Fig. 7).
FIG 7.
Radiologist breast CT slice evaluation image set. The radiologist was presented with three subimages: the first was the original breast CT slice, the second was the segmented slice and the third was a composite color coded slice showing the segmented regions superimposed on the original breast CT slice.
Typically between 70 and 100 sub-image sets for each breast CT slice were presented to the radiologist for evaluation depending on breast size. The radiologist was asked to rate the segmentation against what they would draw using a 5 pt scale as follows [1-(Poor) (<60% pixels properly segmented); 2-(OK) (60%–70% pixels properly segmented); 3-(Good) (70%–80% pixels properly segmented); 4-(Very Good) (80%–90% pixels properly segmented); and 5-(Excellent) (>90% pixels properly segmented)].
Three radiologists (two mammographers and one body imager) participated in the review. The tabulated results were summed across all reviewers as a measure of the algorithm performance.
III. RESULTS
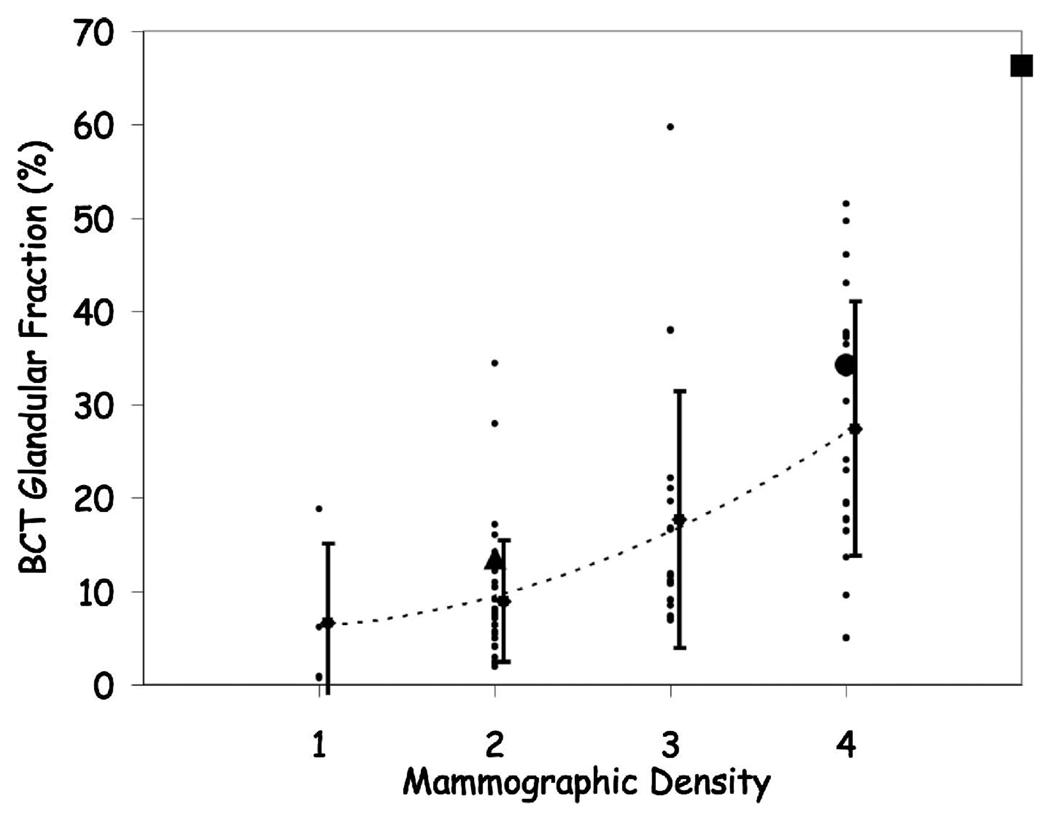
All 55 subjects (mean age 56.1±13.4 years) were able to maintain the 16 s breath-hold. There were no problems with breast positioning or patient tolerance of the examination. Overall the breast CT scans demonstrated excellent image quality.39 Estimation of breast density from film-screen mammography was compared to breast CT % glandular tissue measurements in a total of 105 breasts in 55 patients (Fig. 8).
FIG 8.
Patient breast density (mean ± standard deviation) as rated by a mammographer vs the fractional glandular tissue composition from breast CT. The large symbols correspond to the breast CT images presented later [Fig. 14, fatty replacement (triangle); Fig. 15 scattered fibroglandular (circle); and Fig. 16 heterogeneously dense (square)]. The large overlap between mammographic estimates of breast densities suggests the difficulty in assessing glandular tissue composition in mammograms.
Breast tissue classification required approximately 20 min per breast running on a dual 2.7 GHz PowerPC G5 with 4 GByte DDR SDRAM (Apple, Cupertino, CA). Overall the algorithm performed well as described below. However, the greatest challenge with respect to algorithm performance was field non-uniformity due to cone-beam geometry. Image noise, from using low radiation dose techniques, also ultimately limited breast CT number resolution.
III.A. Segmentation validation
Algorithm validation was based both on accuracy of classification and noise tolerance. The results for the algorithm validation using noise-added images are shown in Fig. 9. The segmented slices with noise added agreed with the original reference segmented slices to within 1% for each fraction of segmented tissues using a voxel to voxel comparison. These results demonstrate the robust noise tolerant performance of the algorithm which is important, particularly when using low radiation dose techniques.
FIG 9.
Selected slices from algorithm validation slices. Each column represents a different percentage of breast glandular tissue in that slice for the breast CT data presented later (Fig. 14, fatty replacement; Fig. 15 scattered fibroglandular; and Fig. 16 heterogeneously dense). The row sequence is as follows: breast CT slice; segmented breast CT slice; segmented slice with Gaussian noise of mean 25 CT units added; segmented slice with Gaussian noise of mean 40 CT units added; classification results for noise added images for 25 CT units; classification results for noise added image for 40 CT units; difference image between segmented noise image (25 CT units) and original segmentation; difference image between segmented noise image (40 CT units) and original segmentation.
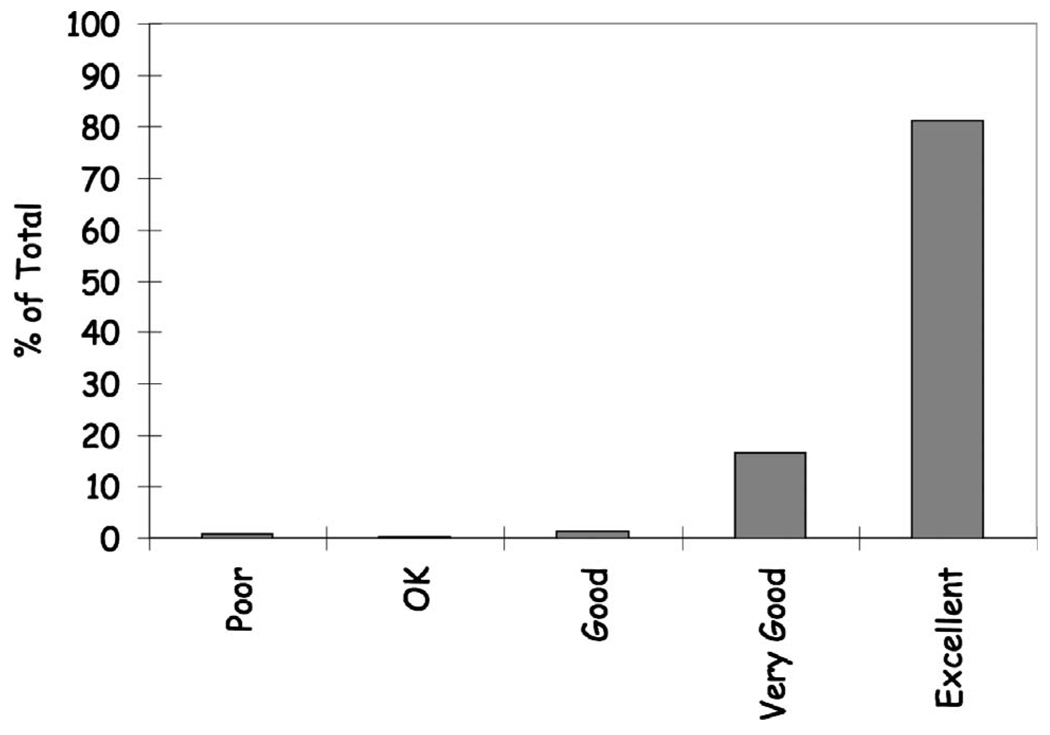
The results for the radiologist assessment of classification performance validation are shown in Fig. 10 and demonstrate overall excellent performance with 97.7% of the classifications judged to be very good or better (81.1% excellent; 16.6% very good). On average it required approximately 6 min per slice for their analysis. The majority of the poor evaluations were from one slice that experienced marked slice non-uniformity that affected the histogram threshold on a global basis. A more regional histogram analysis could be used to address this issue and is being investigated.
FIG 10.
Histogram showing radiologist rating of algorithm classification performance. 97.7% of the classifications were judged to be very good or better (81.1% excellent; 16.6% very good; 1.3% good; 0.2% OK; 0.8% poor).
III.B. Population results
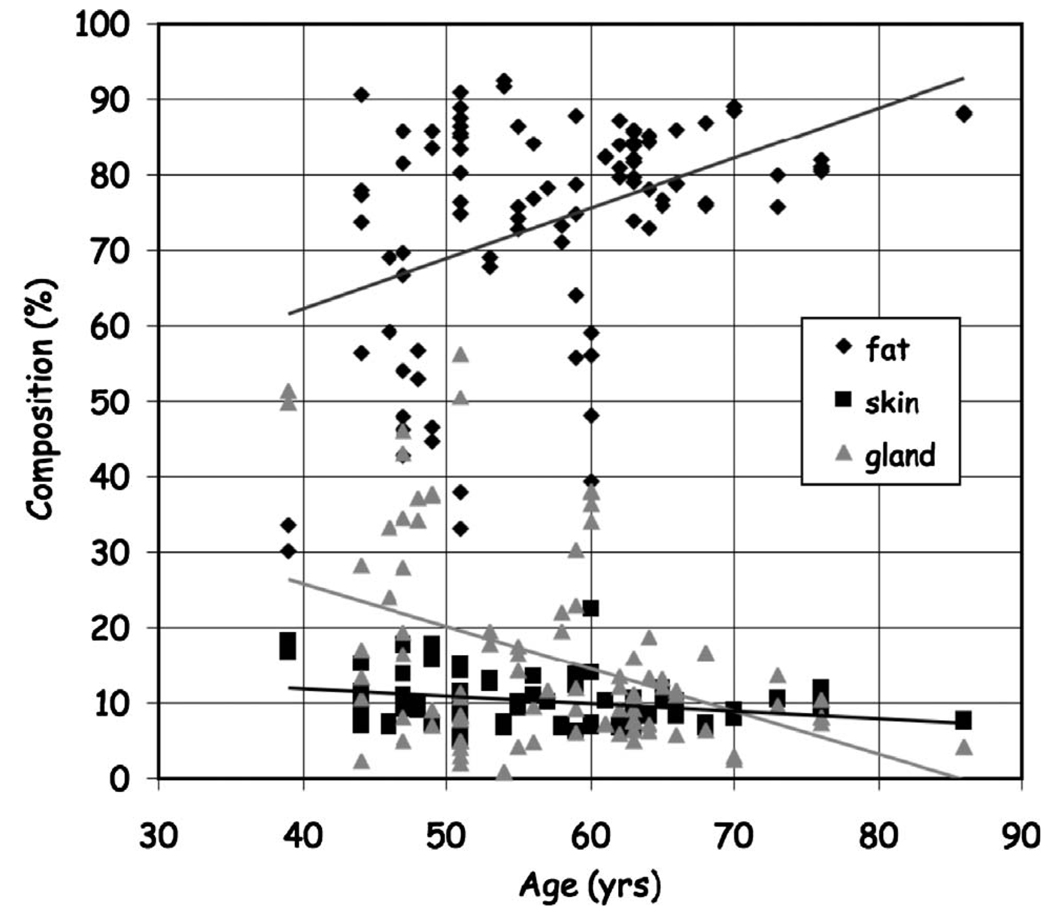
The algorithm was able to successfully classify breast tissues into skin, fat and glandular tissues and quantify breast composition. Figure 11 shows the distribution in fractional breast tissue composition as a function of age with a general decline in breast glandular tissue with age.
FIG 11.
Distribution of fractional breast composition as a function of age.
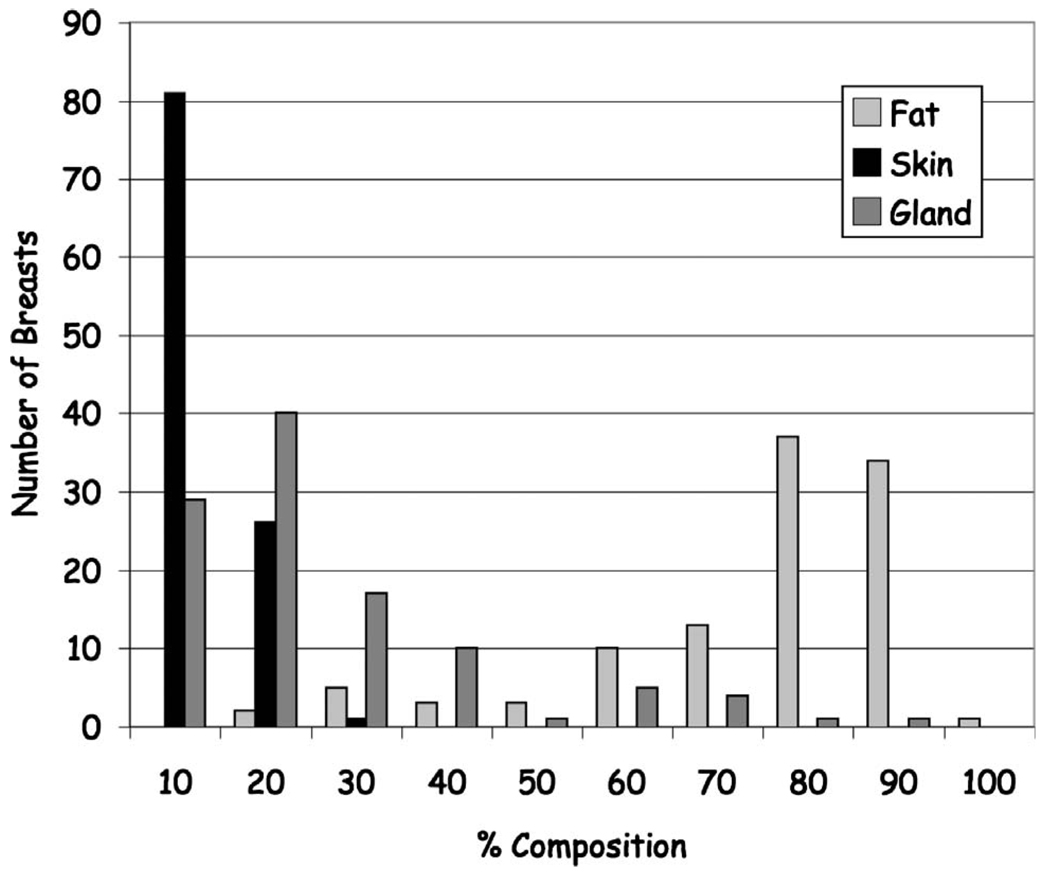
A better sense of the overall tissue composition is given in Fig. 12 that shows the relative distribution of tissues across all subjects. Note that the majority of individuals imaged had breasts predominately composed of fat (mean composition: gland 17.1%± 15.2%; fat 72.8%±17.1%; skin 10.1%±3.3%).
FIG 12.
Histogram of the patient distribution of the fractional breast composition showing the majority of breasts composition is fat with a relatively smaller distribution being predominantly glandular.
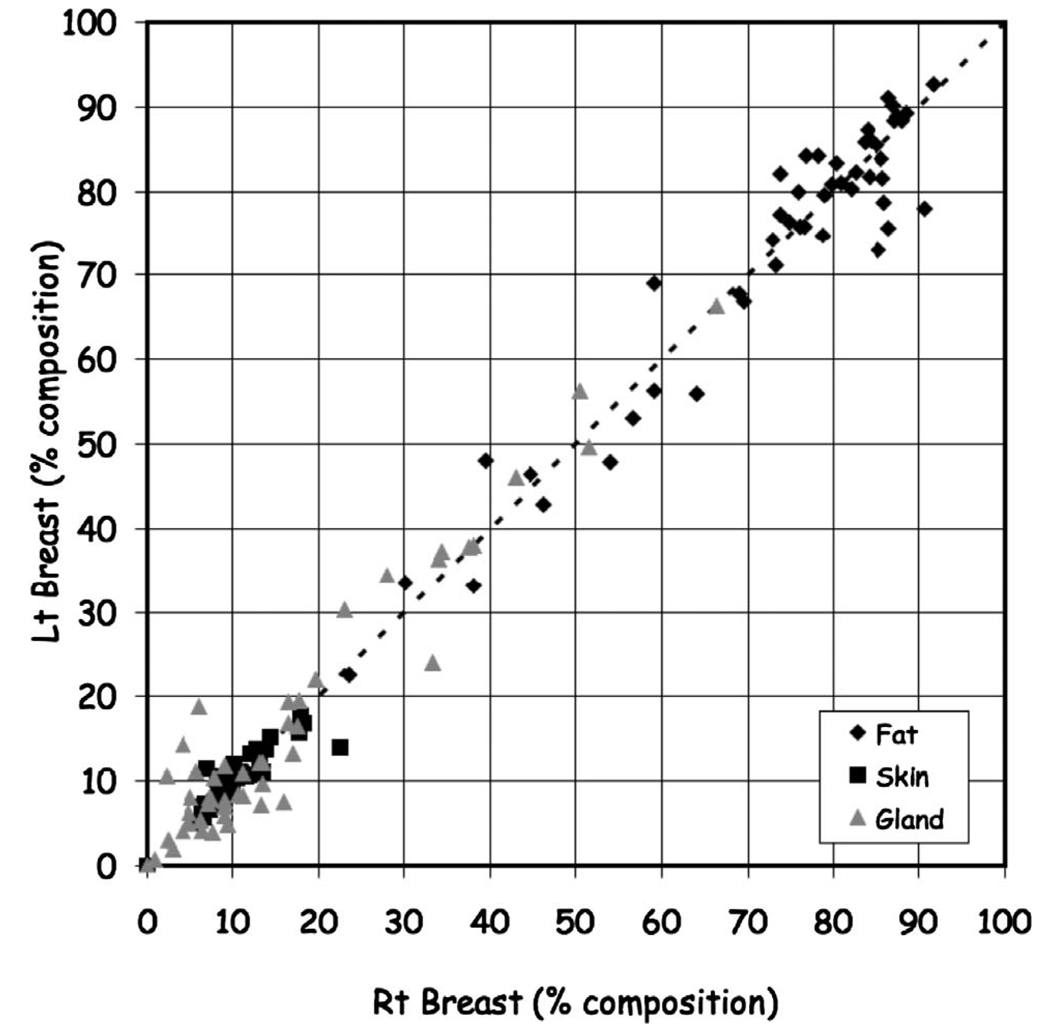
Also, we compared the tissue composition between the right and left breasts. Figure 13 shows the variation between the right and left breasts for gland (ratio=1.14±0.75, ρ=0.96; fat (ratio=1.00±0.08, ρ=0.97), and skin [ratio=1.00±0.14, ρ=0.90]).
FIG 13.
Comparison of right and left composition by tissue classification.
III.C. Case examples
Comparison of breast CT tissue classification to mammographer-based density classification suggests that it is difficult to accurately estimate breast glandular tissue fraction from projection imaging. Tomographic imaging facilitates this task. We present several representative examples from the subject population with different breast densities showing the variability in breast tissue distribution and composition.
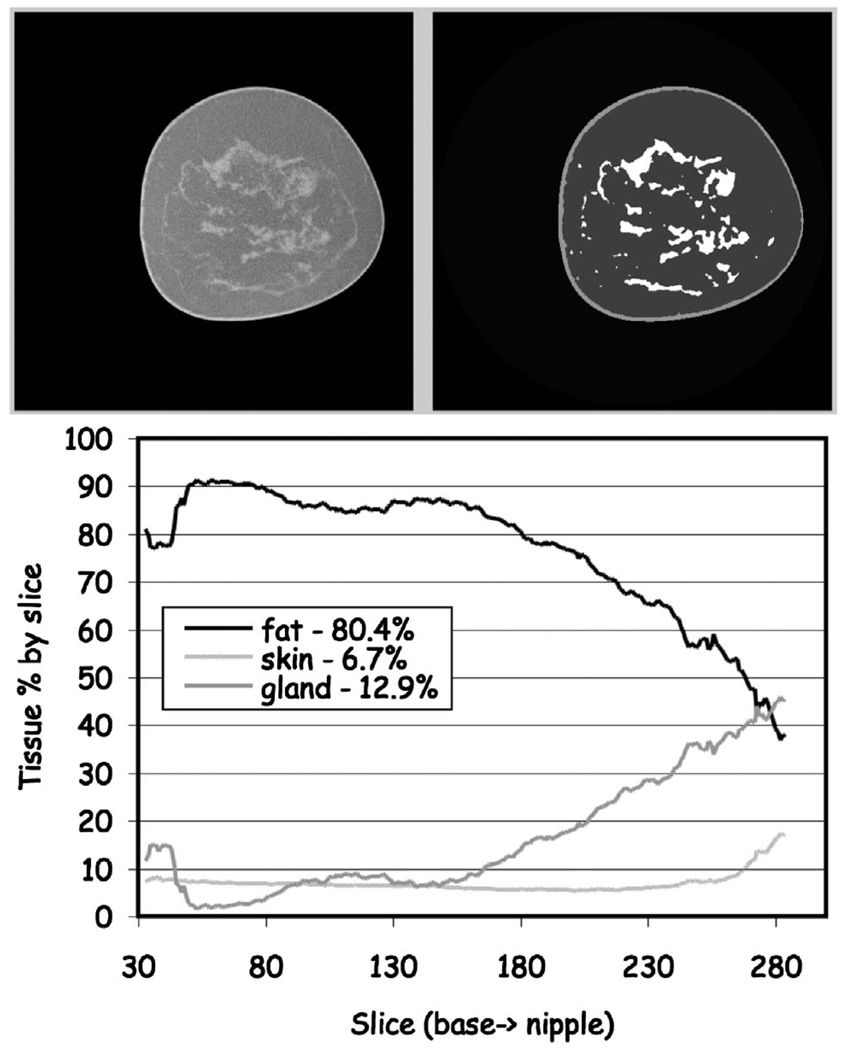
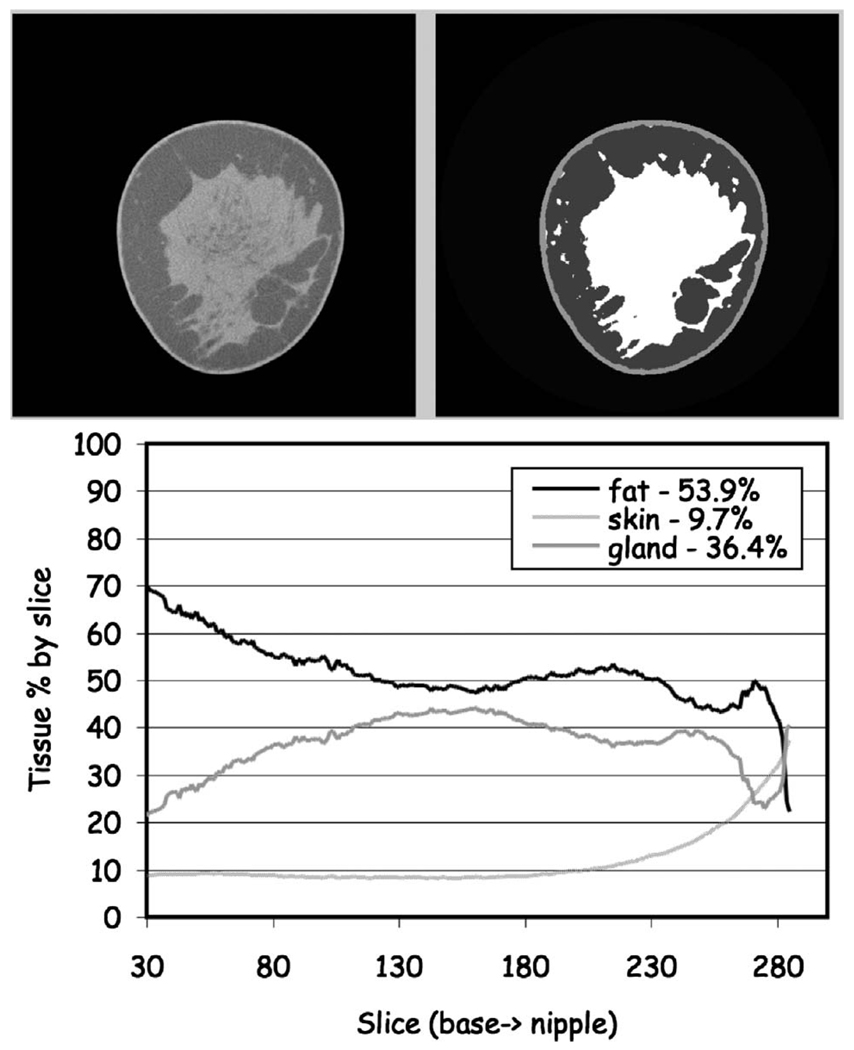
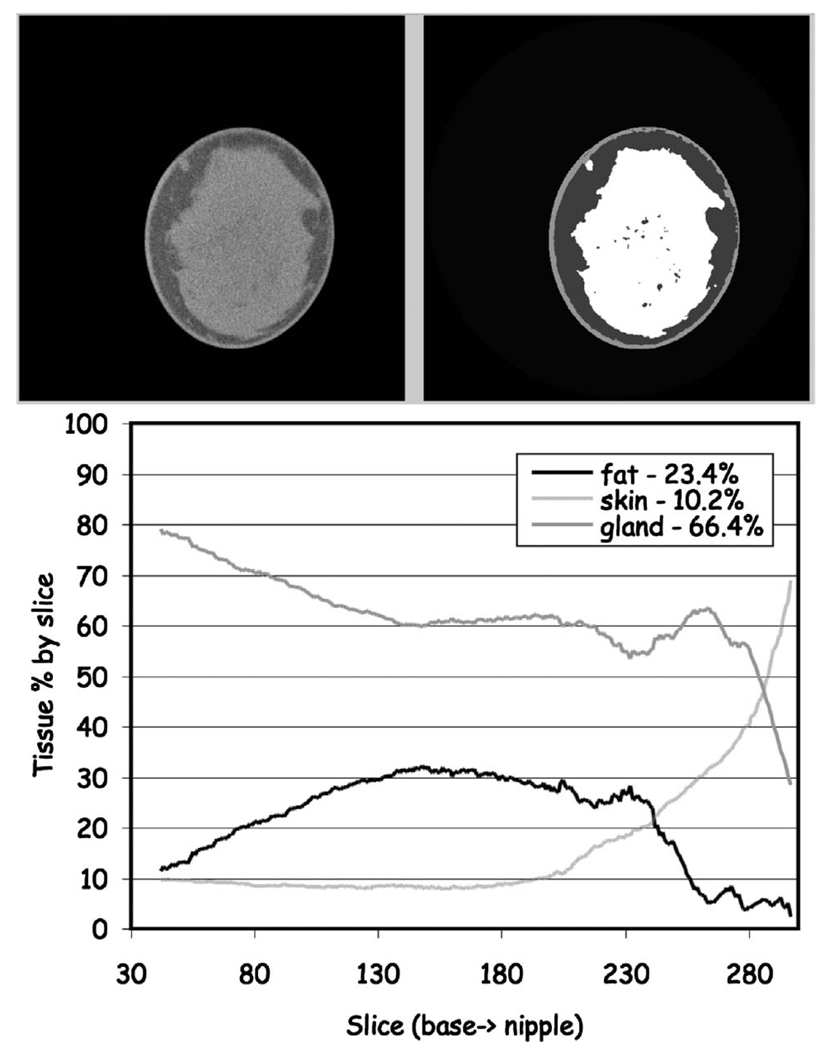
First, Fig. 14 is a fatty replacement breast; second, Fig. 15 is a fibroglandular breast; and third, Fig. 16 is a dense breast.
FIG 14.
Classification of fatty replacement breast. (Upper) One mid-breast slice of the breast CT with the corresponding segmented image. (Lower) The composition analysis through all slices. The total breast volume was 350 ml with a volume fractional composition of 6.5% skin, 80.4% fat and 12.9% gland.
FIG 15.
Classification of a scattered fibroglandular breast. (Upper) One mid-breast slice of the breast CT with the corresponding segmented image. (Lower) The composition analysis through all slices. The total breast volume was 353 ml with a volume fractional composition of 9.7% skin, 53.9% fat and 36.4% gland.
FIG 16.
Classification of a heterogeneously dense breast. (Upper) One mid-breast slice of the breast CT with the corresponding segmented image. (Lower) The composition analysis through all slices. The total breast volume was 248 ml with a volume fractional composition of 10.2% skin, 23.4% fat and 66.4% gland.
In each of the examples, the fractional composition plotted is computed by slice whereas the percentage of each tissue number represents the total breast composition.
Our results suggest that even in denser breasts the fraction of glandular tissue seldom exceeds 50%. For most individuals the composition is better characterized as being a 70% (fat)−30% (gland) composition rather than a 50% (fat)−50% (gland) composition12 consistent with the results of others.5 While glandular patterns are generally similar between the right and left side, glandular patterns varied widely between individuals.
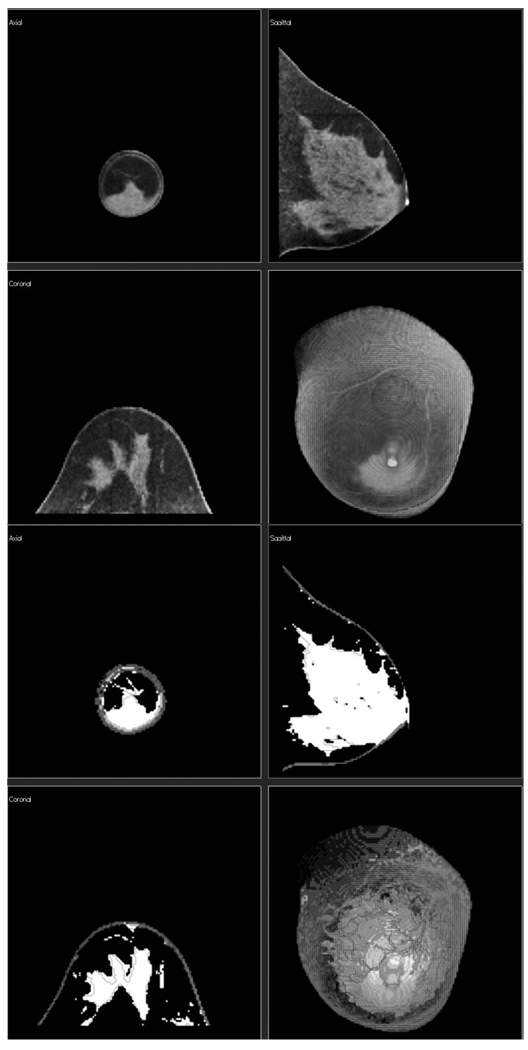
Also, since the classification algorithm produced a series of segmented slices for the entire breast volume, these slices could be viewed as a volume from any orientation (Fig. 17) in addition to as individual slices.
FIG 17.
Classification of a highly glandular breast. (Upper Panel) Three orthogonal slices from the original CT scan plus a volume rendered image of the breast CT with the corresponding segmented images (Lower Panel).
IV. DISCUSSION
Breast CT provides high-quality volume data that enhances visualization of breast glandular tissue and architecture compared to other breast imaging methods. Breast CT also uses radiation doses comparable to x-ray mammography.9–12 Initial clinical experience39 has shown performance similar to that of film-screen mammography with improved soft-tissue contrast and excellent breast parenchymal and glandular structure detail.
In the present study we were able to evaluate the composition of breast tissue in a relatively small group of normal volunteers and patients with mammographically identified breast lesions using breast CT and classify breast tissues into skin, fat and gland. While individual tissue distributions varied widely, for most individuals our results suggest that the breast composition can be characterized as being a 70% (fat)−30% (gland) composition rather than a 50% (fat)−50% (gland) composition5 with similar distributions and patterns between the right and left breasts. A larger patient study will be useful to confirm these results.
Tissue classification makes possible a range of quantitative measurements regarding breast composition, density and tissue distribution with age. In addition, quantitative tissue classification is valuable as input to finite-element analysis algorithms simulating breast compression for comparison to mammography.43 Classified breast data also may be of use in dose estimation44 and computer-aided diagnosis.29 There have been reports of differences in the density and Hounsfield number associated with different types of cancers compared to normal breast tissues.45 While the present work focuses on classification of breast tissue, with improvements in image signal-to-noise performance, it may be possible to differentiate between breast cancers and normal glandular tissue using the same strategies.
ACKNOWLEDGMENTS
This work was supported in part by the California Breast Cancer Research Program Grant No. 7EB-0075, the National Institutes for Health Grant Nos. 11IB-0035, NCI-R01 CA89260, NIBIB-EB002138, and the Susan G. Komen Foundation.
Contributor Information
Thomas R. Nelson, Department of Radiology, University of California, San Diego, La Jolla, California 92037-0610.
Laura I. Cerviño, Department of Radiology, University of California, San Diego, La Jolla, California 92037-0610
John M. Boone, University of California Davis Medical Center, 4860 Y Street, Ambulatory Care Center Suite 3100, Sacramento, California 95817
Karen K. Lindfors, University of California Davis Medical Center, 4860 Y Street, Ambulatory Care Center Suite 3100, Sacramento, California 95817
References
- 1.Atlas, Reston, VA: American College of Radiology; 2003. American College of Radiology (ACR), Breast Imaging Reporting and Data System (BI-RADS™) [Google Scholar]
- 2.Tabár L, Chen HH, Fagerberg G, Duffy SW, Smith TC. Recent results from the Swedish Two-County Trial: The effects of age, histologic type, and mode of detection on the efficacy of breast cancer screening. J. Natl. Cancer Inst. 1997;(22):43–47. doi: 10.1093/jncimono/1997.22.43. [DOI] [PubMed] [Google Scholar]
- 3.Larsson LG, Andersson I, Bjurstam N, Fagerberg G, Frisell J, Tabár L, Nyström L. Updated overview of the Swedish Randomized Trials on Breast Cancer Screening with Mammography: Age group 40–49 at randomization. J. Natl. Cancer Inst. 1997;(22):57–61. doi: 10.1093/jncimono/1997.22.57. [DOI] [PubMed] [Google Scholar]
- 4.Larsson LG, Nystrom L, Wall S, Rutqvist L, Andersson I, Bjurstam N, Fagerberg G, Frisell J, Tabar L. The Swedish randomzied mammography screening trials: Analysis of their effect on the breast cancer related excess mortality. J. Med. Screen. 1996;3:129–132. doi: 10.1177/096914139600300305. [DOI] [PubMed] [Google Scholar]
- 5.Boston RC, Schnall MD, van Englander SA, Landis JR, Moate PJ. Estimation of the content of fat and parenchyma in breast tissue using MRI T1 histograms and phantoms. Magn. Reson. Imaging. 2005;23:591–599. doi: 10.1016/j.mri.2005.02.006. [DOI] [PubMed] [Google Scholar]
- 6.Graham SJ, Bronskill MJ, Byng JW, Yaffe MJ, Boyd NF. Quantitative correlation of breast tissue parameters using magnetic resonance and x-ray mammography. Br. J. Cancer. 1996;73(2):162–168. doi: 10.1038/bjc.1996.30. [DOI] [PMC free article] [PubMed] [Google Scholar]
- 7.Lee NA, et al. Fatty and fibroglandular tissue volumes in the breasts of women 2083 years old: Comparison of x-ray mammography and computer-assisted MR imaging. AJR, Am. J. Roentgenol. 1997;168(2):501–506. doi: 10.2214/ajr.168.2.9016235. [DOI] [PubMed] [Google Scholar]
- 8.van Engeland S, Snoeren PR, Huisman J, Boetes C, Karssemeijer N. Volumetric breast density estimation from full-field digital mammograms. IEEE Trans. Med. Imaging. 2006;25(3):273–282. doi: 10.1109/TMI.2005.862741. [DOI] [PubMed] [Google Scholar]
- 9.Boone JM, Kwan ALC, Seibert JA, Shah N, Lindfors KK, Nelson TR. Imaging technique factors and their relationship to radiation dose in pendant geometry breast CT. Med. Phys. 2005;32:3767–3776. doi: 10.1118/1.2128126. [DOI] [PubMed] [Google Scholar]
- 10.Boone JM, Lindfors KK, Seibert JA, Nelson TR. Breast cancer screening using a dedicated breast CT scanner: A feasibility study digital mammography. In: Heinz-Otto Peitgen, editor. Proceedings from the 6th International Workshop on Digital Mammography. New York: Springer-Verlag; 2003. pp. 6–11. Bremen, Germany, June 22–25, 2002. [Google Scholar]
- 11.Boone JM, Nelson TR, Lindfors KK, Seibert JA. Dedicated breast CT: Radiation dose and image quality evaluation. Radiology. 2001;221:657–667. doi: 10.1148/radiol.2213010334. [DOI] [PubMed] [Google Scholar]
- 12.Boone JM, Shah N, Nelson TR. A comprehensive analysis of DgNCT coefficients for pendant-geometry cone-beam breast computed tomography. Med. Phys. 2004;31:226–235. doi: 10.1118/1.1636571. [DOI] [PubMed] [Google Scholar]
- 13.Byrne C, et al. Mammographic features and and breast cancer risk: Effects with time, age, and menopause status. J. Natl. Cancer Inst. 1995;87(21):1622–1629. doi: 10.1093/jnci/87.21.1622. [DOI] [PubMed] [Google Scholar]
- 14.Harvey JA, Bovbjerg VE. Quantitative assessment of mammographic breast density: Relationship with breast cancer risk. Radiology. 2004;230(1):2941. doi: 10.1148/radiol.2301020870. [DOI] [PubMed] [Google Scholar]
- 15.Heine JJ, Malhotra P. Mammographic tissue, breast cancer risk, serial image analysis and digital mammography. Acad. Radiol. 2002;9:296–316. doi: 10.1016/s1076-6332(03)80374-4. [DOI] [PubMed] [Google Scholar]
- 16.Heine JJ, Malhotra P. Mammographic tissue, breast cancer risk, serial image analysis and digital mammography. Acad. Radiol. 2002;9:317–335. doi: 10.1016/s1076-6332(03)80374-4. [DOI] [PubMed] [Google Scholar]
- 17.Russo J, Lynch H, Russo JH. Mammary gland architecture as a determining factor in the susceptibility of the human breast to cancer. Breast J. 2001;7(5):278–291. doi: 10.1046/j.1524-4741.2001.21033.x. [DOI] [PubMed] [Google Scholar]
- 18.Sivaramakrishna R, Gordon R. Detection of breast cancer at a smaller size can reduce the likelihood of metastatic spread: A quantitative analysis. Acad. Radiol. 1997;4(1):8–12. doi: 10.1016/s1076-6332(97)80154-7. [DOI] [PubMed] [Google Scholar]
- 19.Ursin G, Parisky YR, Pike MC, Spicer DV. Mammographic density changesuring the menstrual cycle. Cancer Epidemiol. Biomarkers Prev. 2001;10(2):141–142. [PubMed] [Google Scholar]
- 20.Wolfe JN. Breast parenchymal patterns and their changes with age. Radiology. 1976;121(3):545–552. doi: 10.1148/121.3.545. [DOI] [PubMed] [Google Scholar]
- 21.Wolfe JN. Breast patterns as an index of risk for developing breast cancer. AJR, Am. J. Roentgenol. 1976;126:1130–1139. doi: 10.2214/ajr.126.6.1130. [DOI] [PubMed] [Google Scholar]
- 22.Wolfe JN. Risk for breast cancer development determined by mammographic parenchymal pattern. Cancer. 1976;37(5):2486–2492. doi: 10.1002/1097-0142(197605)37:5<2486::aid-cncr2820370542>3.0.co;2-8. [DOI] [PubMed] [Google Scholar]
- 23.Anderson NH, Hamilton PW, Bartels PH, Thompson D, Montironi R, Sloan JM. Computerized scene segmentation for the discrimination of architectural features in ductal proliferative lesions of the breast. J. Pathol. 1997;181:374–380. doi: 10.1002/(SICI)1096-9896(199704)181:4<374::AID-PATH795>3.0.CO;2-N. [DOI] [PubMed] [Google Scholar]
- 24.Chang YA, Wang XH, Hardesty LA, Chang TS, Poller WR, Good WF, Gur D. Computerized assessment of tissue composition on digitized mammograms. Acad. Radiol. 2002;9:899–905. doi: 10.1016/s1076-6332(03)80459-2. [DOI] [PubMed] [Google Scholar]
- 25.Samani A, Bishop J, Plewes DB. A constrained modulus reconstruction technique for breast cancer assessment. IEEE Trans. Med. Imaging. 2001;20(9):877–885. doi: 10.1109/42.952726. [DOI] [PubMed] [Google Scholar]
- 26.Stines J, Tristant H. The normal breast and its variations in mammography. Eur. J. Radiol. 2004;54:26–36. doi: 10.1016/j.ejrad.2004.11.017. [DOI] [PubMed] [Google Scholar]
- 27.Chan HP, Doi K, Vyborny CJ, Lam KL, Schmidt RA. Computer-aided detection of microcalcification in mammograms. Invest. Radiol. 1988;9:664–671. [PubMed] [Google Scholar]
- 28.Shen L, Rangayyan R, Desautels JEL. Detection and classification of mammographic calcifications. Int. J. Pattern Recognit. Artif. Intell. 1993;7:1403–1416. [Google Scholar]
- 29.Wu Y, Doi K, Giger ML, Nishikawa RM. Computerized detection of clustered microcalcifications in digital mammograms: Application of artificial neural networks. Med. Phys. 1992;19:555–560. doi: 10.1118/1.596845. [DOI] [PubMed] [Google Scholar]
- 30.Bankman IN, Niziazlek T, Simon I, Gatewood OB, Weinberg IN, Brody WR. Segmentation algorithms for detecting microcalcifications in mammograms. IEEE Trans. Inf. Technol. Biomed. 1997;1(2):141–149. doi: 10.1109/4233.640656. [DOI] [PubMed] [Google Scholar]
- 31.Byng JW, et al. Analysis of mammographic density and breast cancer risk from digitized mammograms. Radiographics. 1998;18(6):1587–1598. doi: 10.1148/radiographics.18.6.9821201. [DOI] [PubMed] [Google Scholar]
- 32.Kappadath SC, Shaw CC. Dual energy digital mammography, calibration and inverse mapping techniques to estimate calcification thickness and glandular tissue ration. Med. Phys. 2003;30(6):1110–1117. doi: 10.1118/1.1576394. [DOI] [PubMed] [Google Scholar]
- 33.Kaufhold J, Thomas JA, Eberhard JW, Galbo CE, Gonzalez-Trotter DE. A calibration approach to glandular tissue composition estimation in digital mammography. Med. Phys. 2002;29(8):1867–1880. doi: 10.1118/1.1493215. [DOI] [PubMed] [Google Scholar]
- 34.Shepherd JA, Kerlikowske KM, Smith-Bindman R, Genant HK, Cummings SR. Measurement of breast density with dual x-ray absorptiometry: Feasibility. Radiology. 2002;223(2):554–557. doi: 10.1148/radiol.2232010482. [DOI] [PubMed] [Google Scholar]
- 35.Sivaramakrishna R, Obuchowski A, Chilcote A, Powell KA. Automatic segmentation of mammographic density. Acad. Radiol. 2001;8(3):250–256. doi: 10.1016/S1076-6332(03)80534-2. [DOI] [PubMed] [Google Scholar]
- 36.Stomper P, D’Souza D, DiNitto P, Arredondo M. Analysis of parenchymal density on mammograms in 1353 women 2579 years old. AJR, Am. J. Roentgenol. 1996;167(5):1261–1265. doi: 10.2214/ajr.167.5.8911192. [DOI] [PubMed] [Google Scholar]
- 37.Wang XH, et al. Automated assessment of the composition of breast tissue revealed on tissue-thickness-corrected mammography. Am. J. Roentgenol., Radium Ther. Nucl. Med. 2003;180(1):257–262. doi: 10.2214/ajr.180.1.1800257. [DOI] [PubMed] [Google Scholar]
- 38.Wei J, Chan HP, Helvie MA, Roubidoux MA, Sahiner B, Hadjiiski LM, Zhou C, Paquerault S, Chenevert T, Goodsitt MM. Correlation between mammographic density and volumetric fibroglandular tissue estimated on breast MR images. Med. Phys. 2004;31(4):933–942. doi: 10.1118/1.1668512. [DOI] [PubMed] [Google Scholar]
- 39.Lindfors KK, Boone JM, Nelson TR, Yang K, Kwan ALC, Miller DF. Dedicated breast CT: Initial clinical experience. Radiology. in press doi: 10.1148/radiol.2463070410. [DOI] [PMC free article] [PubMed] [Google Scholar]
- 40.Tanner C, Degenhard A, Schnabel JA, Smith AC, Hayes C, Sonoda LI, Leach MO, Hose D, Hill DLG, Hawkes DJ. Mathematical Methods in Biomedical Image. New York: IEEE; 2001. A method for the comparison of biomechanical breast models; pp. 11–18. [Google Scholar]
- 41.Kwan ALC, Boone JM, Shah N. Evaluation of x-ray scatter properties in a dedicated cone-beam breast CT scanner. Med. Phys. 2005;32:2967–2975. doi: 10.1118/1.1954908. [DOI] [PubMed] [Google Scholar]
- 42.Feldkamp LA, Davis LC, Kress JW. Practical cone-beam algorithm. J. Opt. Soc. Am. A. 1984;1:612–619. [Google Scholar]
- 43.Kellner AL, Nelson TR, Cervino LI, Boone JM. Simulation of the mechanical compression of breast tissue. IEEE Trans. Biomed. Eng. 2007;54(10):1885–1891. doi: 10.1109/TBME.2007.893493. [DOI] [PubMed] [Google Scholar]
- 44.Hoeschen C, Fill U, Zank M, Panzer W, Regulla D, Dohring W. A high-resolution voxel phantom of the breast for dose calculations in mammography. Radiat. Prot. Dosim. 2005;114(1–3):406–409. doi: 10.1093/rpd/nch558. [DOI] [PubMed] [Google Scholar]
- 45.Johns PC, Yaffe MJ. X-ray characterization of normal and neoplastic breast tissues. Phys. Med. Biol. 1987;32:675–695. doi: 10.1088/0031-9155/32/6/002. [DOI] [PubMed] [Google Scholar]


