

Summary
Evaluation of the accuracy of ultrasound has yielded heterogeneous results. Our objective was to summarize the evidence on the accuracy of ultrasound compared to venography in asymptomatic patients, taking into account the variation due to threshold differences. Searches of journal table of contents, computer databases (Medline, Embase, Biomed, Cochrane) and conference proceedings were performed. A study was eligible if it prospectively compared ultrasound to venography for the diagnosis of DVT in asymptomatic patients. Data of studies selected for inclusion were extracted independently by two authors. High quality studies with consecutive patient enrollment, blind evaluation of the two techniques, and absence of verification bias are summarized as Level 1, while those not fulfilling one or more of these criteria are considered Level 2. Original study authors were contacted to confirm accuracy and to provide missing data. A pooled estimate of the accuracy of ultrasound was obtained according to the method of Moses and coworkers. This method gives a summary diagnostic odds ratio (DOR). The DOR is a single indicator of test performance. It varies between 0 and infinity and exceeds 1, only when ultrasound is more often positive in patients with DVT relative to those without DVT. Higher DOR indicates better discriminatory test performance. Thirty one studies were rated as potentially unbiased and graded as Level 1. The mean prevalence of DVT as determined by venography was 22%. In Level 1 studies, the odds of positive ultrasound in proximal veins was 379 times higher (95% confidence limits 65, 2,200) and in distal veins 32 times higher (7.5, 135) among patients with DVT than those without. Our results suggest that, particularly for proximal veins, ultrasound is accurate for the diagnosis of DVT in asymptomatic postoperative orthopedic patients. More research is needed in other clinical settings.
Keywords: Meta-analysis, accuracy, venous thrombosis, venography, ultrasonography
Introduction
Deep venous thrombosis (DVT) is a common disease with potentially serious consequences such as pulmonary embolism (1). The incidence of DVT in the general population is reported to be between 1.6 and 1.8 per 1000 people per year (2-4). Symptomatic DVTs are less frequent, comprising only 3.4% of the total (5). Venography in asymptomatic surgical patients at high or highest risk, however, has found an incidence of between 4-20% in proximal (thigh) and 20-80% in calf veins. In orthopedic surgery (highest risk), the incidence of DVT systematically screened by venography ranges between 50-60% (5). As a consequence of our inability to identify patients with asymptomatic DVTs, who will develop clinical venous thromboembolism, antithrombotic drugs are used as a prophylactic measure in all high-risk patients (6). These drugs are reportedly efficacious in the treatment of asymptomatic DVTs, but this risk reduction is accompanied by a high risk of adverse drug events, including major hemorrhage. For instance, the rate of major bleeding after total hip replacement in patients treated with low molecular weight heparin is estimated at 5% (5). Moreover, the rate of recurrence of asymptomatic DVT remains high (4-19%), even with prolonged out-patient treatment (5).
To balance this high risk of morbidity, the decision to treat a patient, or to withhold anticoagulant after discharge, should be based on accurate diagnostic tests with a high sensitivity and specificity. Diagnostic tests are also helpful for clinical management (e.g. localization of DVTs) and in monitoring disease, during or after treatment. Because of the inaccuracy of clinical examination (7), diagnostic techniques such as I-fibrinogen scanning, venography, plethysmography and ultrasonography have been developed.
Venography, first described in 1963 (8), is generally accepted as the gold standard in detecting DVT even in asymptomatic patients, although it has not been properly evaluated in this role because of the absence of a true reference. It allows the direct visualization of the veins from the calf to vena cava after opacification by contrast media. Contrast is injected into any superficial vein on the dorsum of the foot. Presence of a filling defect or abrupt termination of the opaque column are used as criteria for DVT (9). Nevertheless, venography presents several limitations: pain; induction of DVTs in up to 2% (especially when using ionic contrast agents (6)); general reliability, as indicated by kappa agreement coefficients of observers as low as 0.57 (though some are as high as 0.90) (10-14); and lack of reliability in special cases because of patient contraindication, patient refusal, or technical reasons (6, 15).
Because of these limitations venography has never been accepted as a systematic screening tool, and non-invasive diagnostic tests like ultrasound have been evaluated to replace venography, particularly in the context of routine screening for DVT (16). Ultrasonography uses five different imaging techniques to evaluate the reflective properties of tissues: Brightness modulation (B-Mode), Doppler, Duplex (combination of B-mode and Doppler), Color Doppler and Triplex (combination of Duplex and Color Doppler). Several criteria have been evaluated for the diagnosis of DVT. The lack of compressibility of the vein due to the (presumed) presence of thrombosis is the most commonly accepted cut-off criteria or threshold.
Previous reviews have attempted to summarize the available evidence on the accuracy of ultrasound for the diagnosis of DVT (16-18). Only English-language articles indexed principally in Medline were included, and sensitivity and specificity were summarized using the pooled data. These reviews have found, however, significant heterogeneity between the selected studies. No attempt was made to explain the heterogeneity or the use of new, more appropriate methods developed for summarizing results of diagnostic test evaluation. These methods have the advantage of taking into account the variation in the thresholds used by different observers to determine which patients are diseased. When there is a tradeoff between sensitivity and specificity due to differences in judgment, pooled estimates of sensitivity and specificity can be misleading and should be avoided (19). Furthermore, one of the previous reviews (16) did not identify multiple publications (20, 21), and accuracy for all DVTs was calculated including studies that did not evaluate distal veins with ultrasonography (22-26).
The main objective of the present study is to summarize results of all available evidence on the accuracy of ultrasound compared to venography for the diagnosis of DVT in asymptomatic patients using modern meta-analytic methods.
Material and methods
Data sources
Published material
A comprehensive review of the literature combining online and conventional library searches as well as searches to find unpublished studies was performed. All studies evaluating the accuracy of ultrasound compared to venography in asymptomatic patients were included, regardless of the language of publication. Database searches included: Medline from 1966 to April 2003 using the PubMed® interface, Embase® and Pascal Biomed® from 1989 to 2002 using the Silver Platter® interface, Science Citation Index (SCI) from 1979 to 2002 using the Web of Science interface, Database of Abstracts of Reviews of Effectiveness (DARE) through the University of York website by November 2002 and the Cochrane database through the Cochrane Library. Reference lists of all included studies, two systematic reviews (16, 18), and two reviews (27, 28) related to our meta-analysis were also reviewed for other potential studies that met inclusion criteria. We used the following terms (MeSH and free text) in our strategies: thrombosis, venous thrombosis, thrombophlebitis, phlebography, venography, phlebogram, venogram, ultrasonography, ultrasound, Doppler, CUS, duplex.
Fifty-six journals that had appeared at least once in the first Medline search were selected for conventional searching (BK, SS) for the year 1998. Published short communications and abstracts were identified by searching SCI from 1979 to 2000 and by inspecting the proceedings of the thirteenth through eighteenth congresses of the International Society of Thrombosis and Haemostasis published between 1993 to 2001.
Unpublished studies and gray literature
Manufacturers of Ultrasound Acuson (Siemens), Biosound, Diasonic, Quantum QAD, GE Ultrasonic, ATL Ultramark (Philips), Aloka, Toshiba, Hitachi and investigators of all comparative studies were contacted by e-mail or mail for any unpublished studies. The Dissertation Abstracts International (DAI) database was searched for information about doctoral dissertations and master’s theses from 1980 to 2002.
Study selection
A study was eligible if it prospectively compared ultrasound to venography for the diagnosis of deep venous thrombosis in lower limbs of asymptomatic patients. A study was excluded if venography was not the reference standard or lower limbs and deep veins were not evaluated. Eligibility was independently assessed by two authors (BK and SS). Differences were resolved by consensus.
Data extraction
Two authors independently reviewed all citation abstracts retrieved and excluded irrelevant studies according to prespecified exclusion criteria. All quality criteria and accuracy data were extracted blindly from the original papers by two authors (BK, SS). In addition, we asked all authors of included studies to confirm the accuracy of the extracted covariates and to supply any missing data. All covariates were selected a priori. The influence of these covariates on diagnostic accuracy was explored and will be reported in a separate paper.
The statistical units were patients in 24 studies and lower limbs in 23. For each study we extracted a 2×2 table of positive results in diseased (True Positive, TP), negative results in non diseased (True Negative, TN), positive results in non diseased (False Positive, FP) and negative results in diseased patients (False Negative, FN). When data were available a 2×2 table was created for each anatomical localization, i.e. all DVT (proximal + distal veins), proximal (thigh + popliteal) and distal (calf) DVT.
were calculated from original data. The diagnostic OR is a single indicator of test performance. It varies between 0 and infinity. When diagnostic OR is equal to 1 the test has no discriminatory value. A diagnostic OR > 1 indicates that the test is more often positive in diseased relative to non diseased patients, higher the diagnostic OR better the discriminatory power (29).
Management and assessment of quality
Because of criticisms of quality scores (30), we examined quality items instead. However, we also summarized results separately for studies according to generally accepted quality criteria (31). Level 1 studies included consecutive patients, blindly evaluated the two techniques and verified the diagnosis with venography in all patients. In Level 2 studies one or more of the latter characteristics were missing or not clearly present.
Statistical analysis
Computation of common estimates
Pooled estimates of sensitivity and specificity were obtained by the method of Moses and coworkers (see the appendix) (32). Unweighted least squares linear regression was used to estimate a summary diagnostic OR and plot summary Receiver Operating Characteristic curves (sensitivity against (1-specificity)), because it can better reflect the between-study variability of test accuracy (19, 32). Results from a weighted summary ROC could bias estimates and present unresolved methodological problems for diagnostic tests with equal sample sizes, because the highest weight (inverse of the variance) may be assigned to less accurate studies (19). We used an empirical Bayes smoothing method to fill in cells with zero frequency (33), because a continuity correction could considerably influence results (32).
Detection and management of heterogeneity across results
The Q-statistic was used to quantify heterogeneity between sensitivities or specificities and the t-test to detect if the diagnostic ORs were constant across the studies (slope of the regression model close to 0) for different levels of threshold (see the appendix). We explored methodological (study quality) and clinical heterogeneities using the meta-regression technique (34).
Results
From a total of 2,000 identified citations, 233 compared ultrasound to venography, and 53 examined asymptomatic patients. Eight articles were excluded because four were considered multiple publications (20, 35-37), two studies examined only superficial veins in preoperative patients (38, 39) one was retrospective (40), and in one study (41) it was not possible to distinguish data for symptomatic versus asymptomatic patients. Three abstracts (42-44) not published in full were also included. For 19 articles (42%) authors provided missing data and verified the accuracy of extracted sensitivities and specificities.
Table 1 shows the 45 articles included in our systematic review. Forty-two studies were published in English, 2 in French (45, 46), and 1 in Italian (47). Two papers reported two sets of separate results in two different groups of patients, and were therefore considered as 4 independent studies (48, 49). Thus, a total of 47 studies including 4,914 patients were reviewed. The mean prevalence of DVT was 22% (range 5-65%). One study enrolled patients in internal medicine (50) and 46 studies in postoperative surgery (41 orthopedic, 5 in other surgery). The mean age of participants (reported by 34 studies) was 66 years and the sex ratio (28 studies) was 1.5 females to 1 male. The failure rate was 10% for venography (37 studies) and 5% for ultrasound (reported by 31 studies). Thirty-nine studies reported the accuracy of DVT screening in proximal veins, 29 in all veins and 22 in distal veins. Twelve studies (21-26, 49, 51-55) examined distal veins with venography, but not ultrasonography. These studies were not considered for further analysis of the accuracy in all veins. Three studies (47, 56, 57) examined DVT in proximal and distal veins, but it was not possible to distinguish the results of distal from proximal veins. Finally, two studies failed to identify any isolated DVT in proximal veins with venography (58, 59) and were not included in the analysis of accuracy in proximal veins.
Table I.
Accuracy of ultrasonography for the diagnosis of venous thrombosis in asymptomatic patients
| Author | Year | N* | Mean Age |
US Type | Examined Veins | Threshold | DVT | Se† | Sp‡ | PPV§ | NPV ∥ | Prevalence |
|---|---|---|---|---|---|---|---|---|---|---|---|---|
| Milne R(76) | 1971 | 75 | >45 | NS¶ | Proximal / Distal | Comp** | All‡‡ | 0.39 | 0.59 | 0.50 | 0.48 | 0.51 |
| Zielinski A(43) | 1978 | 93 | NS | Doppler | Proximal / Distal | NS | All‡‡ | 0.50 | 0.88 | 0.65 | 0.80 | 0.31 |
| Prox‡‡ | 0.71 | NS | NS | NS | NS | |||||||
| Distal‡‡ | 0.42 | NS | NS | NS | NS | |||||||
| Moser G(46) | 1980 | 227 | 40 | Doppler | NS | NS | All§§ | 0.21 | 0.97 | 0.40 | 0.93 | 0.08 |
| Mitsunaga MM(77) | 1986 | 97 | NS | Doppler | Proximal / Distal | NS | All§§ | 0.26 | 0.88 | 0.40 | 0.79 | 0.24 |
| Barnes RW(21) | 1989 | 78 | 66 | Duplex | Proximal | Comp + Other∥ ∥ | Prox‡‡ | 0.83 | 0.96 | 0.63 | 0.99 | 0.08 |
| Borris LC(57) | 1989 | 60 | NS | B-mode | Proximal / Distal | Comp + Other | All§§ | 0.54 | 0.91 | 0.83 | 0.69 | 0.47 |
| Prox§§ | 0.63 | 0.94 | 0.88 | 0.79 | 0.40 | |||||||
| Flinn WR(78) | 1989 | 361 | 60 | Duplex | Proximal | Comp + Other | Prox§§ | 1.00 | 1.00 | 0.89 | 1.00 | 0.02 |
| Frochlich JA(52) | 1989 | 40 | 82 | Duplex | Proximal | Comp | Prox§§ | 1.00 | 0.97 | 0.83 | 1.00 | 0.13 |
| Monreal M(53) | 39 | 80 | B-mode | Proximal | Comp + Other | Prox§§ | 0.33 | 0.97 | 0.75 | 0.83 | 0.23 | |
| Barzi F(47) | 1990 | 92 | NS | Duplex | Proximal / Distal | Comp | All‡‡ | 0.44 | 0.99 | 0.96 | 0.81 | 0.30 |
| Borris LC(79) | 1990 | 61 | NS | B-mode | Proximal / Distal | Comp + Other | All§§ | 0.71 | 0.94 | 0.77 | 0.92 | 0.23 |
| Prox§§ | 0.73 | 0.96 | 0.80 | 0.94 | 0.18 | |||||||
| Distal§§ | 0.67 | 0.98 | 0.67 | 0.98 | 0.05 | |||||||
| Comerota AJ(80) | 1990 | 38 | NS | Duplex | Proximal / Distal | Comp + Other | All§§ | 0.89 | 1.00 | 1.00 | 0.97 | 0.24 |
| Comerota AJ(80) | Prox§§ | 1.00 | 0.97 | 0.89 | 1.00 | 0.21 | ||||||
| Distal§§ | 1.00 | 0.97 | 0.50 | 1.00 | 0.03 | |||||||
| Dorfman GS(51) | 1990 | 96 | 82 | B-mode | Proximal | Comp | Prox§§ | 1.00 | 1.00 | 1.00 | 1.00 | 0.16 |
| White RH(81) | 1990 | 26 | NS | Duplex | Proximal | Comp + Other | Prox‡‡ | 0.92 | 1.00 | 1.00 | 0.95 | 0.38 |
| Woolson ST(25) | 1990 | 152 | 73 | Duplex | Proximal | Comp | Prox‡‡ | 0.89 | 1.00 | 1.00 | 0.98 | 0.13 |
| Cronan JJ(55) | 1991 | 76 | 82 | Duplex | Proximal | Comp + Other | Prox‡‡ | 1.00 | 1.00 | 1.00 | 1.00 | 0.16 |
| Ginsberg JS(82) | 1991 | 130 | NS | B-mode | Proximal / Distal | Comp | All‡‡ | 0.55 | 0.98 | 0.89 | 0.88 | 0.23 |
| Prox‡‡ | 0.52 | 0.99 | 0.85 | 0.96 | 0.09 | |||||||
| Distal‡‡ | 0.13 | 1.00 | 1.00 | 0.86 | 0.16 | |||||||
| Woolson ST(26) | 1991 | 88 | 70 | Duplex | Proximal | Comp | Prox§§ | 0.67 | 0.99 | 0.91 | 0.94 | 0.17 |
| Agnelli G(24) | 1992 | 116 | 73 | B-mode | Proximal | Comp | Prox§§ | 0.57 | 0.99 | 0.92 | 0.95 | 0.11 |
| Davidson BL(22) | 1992 | 319 | NS | Color Doppler | Proximal | Comp + Other | Prox§§ | 0.38 | 0.92 | 0.26 | 0.95 | 0.07 |
| Mattos MA (83) | 1992 | 99 | 68 | Duplex | Proximal / Distal | Comp + Other | All‡‡ | 0.55 | 0.98 | 0.89 | 0.88 | 0.23 |
| Prox‡‡ | 0.67 | 1.00 | 1.00 | 0.99 | 0.02 | |||||||
| Distal‡‡ | 0.56 | 0.98 | 0.89 | 0.88 | 0.23 | |||||||
| Tremaine MD(84) | 1992 | 62 | 66 | B-mode | Proximal / Distal | Comp + Other | All‡‡ | 0.86 | 0.95 | 0.67 | 0.98 | 0.11 |
| Prox‡‡ | 1.00 | 0.95 | 0.25 | 1.00 | 0.02 | |||||||
| Distal‡‡ | 0.83 | 1.00 | 1.00 | 0.98 | 0.03 | |||||||
| Elliot CG¶¶(85) | 1993 | 119 | 68 | Duplex | Proximal / Distal | Comp + Other | All‡‡ | 0.62 | 0.93 | 0.73 | 0.89 | 0.22 |
| Prox‡‡ | 1.00 | 0.99 | 0.75 | 1.00 | 0.03 | |||||||
| Distal‡‡ | 0.57 | 0.95 | 0.72 | 0.90 | 0.20 | |||||||
| Piovella F(42) | 1993 | 100 | NS | B-mode | Proximal | Comp | Prox‡‡ | 0.64 | 0.99 | 0.90 | 0.94 | 0.15 |
| Rose SC(59) | 1993 | 78 | 64 | Duplex | Proximal / Distal | Comp + Other | All‡‡ | 0.42 | 0.98 | 0.91 | 0.79 | 0.31 |
| Distal‡‡ | 0.42 | 0.98 | 0.91 | 0.79 | 0.31 | |||||||
| Vanninen R(58) | 1993 | 51 | 68 | Duplex | Proximal / Distal | Comp + Other | All‡‡ | 0.77 | 0.96 | 0.71 | 0.97 | 0.13 |
| Distal‡‡ | 0.73 | 0.97 | 0.73 | 0.97 | 0.11 | |||||||
| Grady-Benson JC(86) | 1994 | 79 | NS | Duplex | Proximal / Distal | Comp + Other | All‡‡ | 0.93 | 0.98 | 0.88 | 0.99 | 0.12 |
| Prox‡‡ | 1.00 | 1.00 | 1.00 | 1.00 | 0.07 | |||||||
| Distal‡‡ | 0.88 | 0.98 | 0.78 | 0.99 | 0.07 | |||||||
| Jongbloets LMM(60) | 1994 | 100 | 61 | B-mode | Proximal / Distal | Comp | All§§ | 0.50 | 0.74 | 0.41 | 0.81 | 0.26 |
| Prox§§ | 0.38 | 0.95 | 0.56 | 0.91 | 0.13 | |||||||
| Distal§§ | 0.50 | 0.73 | 0.35 | 0.83 | 0.23 | |||||||
| Bombardini T***(87) | 1995 | 200 | NS | Duplex | Proximal / Distal | Comp + Other | All§§ | 1.00 | 0.98 | 0.77 | 1.00 | 0.05 |
| Prox§§ | 1.00 | 0.98 | 0.75 | 1.00 | 0.05 | |||||||
| Distal§§ | 0.33 | 1.00 | 1.00 | 0.99 | 0.02 | |||||||
| Crippa L(23) | 1995 | 68 | 65 | B-mode | Proximal | Comp | Prox§§ | 0.63 | 0.98 | 0.83 | 0.95 | 0.12 |
| Lausen I(61) | 1995 | 82 | 67 | Color Doppler | Proximal / Distal | Comp + Other | All§§ | 0.43 | 0.99 | 0.75 | 0.95 | 0.09 |
| Prox§§ | 0.50 | 1.00 | 1.00 | 0.99 | 0.02 | |||||||
| Distal§§ | 0.50 | 0.99 | 0.75 | 0.96 | 0.07 | |||||||
| Atri M(66) | 1996 | 110 | 65 | Color Doppler | Proximal / Distal | Comp | All‡‡ | 0.86 | 1.00 | 1.00 | 0.96 | 0.21 |
| Prox‡‡ | 0.33 | 1.00 | 1.00 | 0.98 | 0.03 | |||||||
| Distal‡‡ | 0.92 | 1.00 | 1.00 | 0.98 | 0.20 | |||||||
| Garino JP Part I(49) | 1996 | 121 | 68 | Duplex | Proximal | Comp + Other | Prox‡‡ | 0.00 | 0.97 | 0.00 | 0.94 | 0.06 |
| Garino JP Part II(49) | 1996 | 87 | 68 | Duplex | Proximal | Comp + Other | Prox‡‡ | 1.00 | 0.98 | 0.71 | 1.00 | 0.06 |
| Magnusson M(88) | 1996 | 138 | 73 | Color Doppler | Proximal / Distal | Comp + Other | All§§ | 0.58 | 0.98 | 0.78 | 0.95 | 0.11 |
| Magnusson M(88) | 1996 | 138 | 73 | Color Doppler | Proximal / Distal | Comp + Other | Prox§§ | 0.63 | 1.00 | 0.83 | 0.99 | 0.03 |
| Magnusson M(88) | Comp + Other | Distal§§ | 0.54 | 0.98 | 0.75 | 0.95 | 0.10 | |||||
| Kalodiki E Part I(48) | 1997 | 23 | 69 | B-mode | Proximal | Comp + Other | Prox‡‡ | 0.33 | 0.92 | 0.40 | 0.89 | 0.14 |
| Kalodiki E Part II(48) | 1997 | 55 | 69 | Duplex | Proximal / Distal | Comp + Other | All§§ | 0.77 | 0.97 | 0.94 | 0.86 | 0.40 |
| Prox‡‡ | 0.93 | 0.99 | 0.93 | 0.99 | 0.13 | |||||||
| Distal‡‡ | 0.79 | 0.97 | 0.83 | 0.96 | 0.18 | |||||||
| Lensing AW‡‡‡(89) | 1997 | 178 | 65 | Duplex | Proximal / Distal | Comp + Other | All§§ | 0.47 | 0.89 | 0.65 | 0.79 | 0.31 |
| Lensing AW(89) | Comp | Prox§§ | 0.60 | 0.96 | 0.71 | 0.93 | 0.14 | |||||
| Distal§§ | 0.33 | 0.91 | 0.58 | 0.78 | 0.27 | |||||||
| Mantoni M(14) | 1997 | 133 | 76 | Triplex | Proximal / Distal | Comp + Other | All‡‡ | 0.74 | 1.00 | 0.95 | 0.97 | 0.11 |
| Prox‡‡ | 1.00 | 1.00 | 0.71 | 0.93 | 0.05 | |||||||
| Distal‡‡ | 0.72 | 0.91 | 0.58 | 0.78 | 0.11 | |||||||
| Morgan B(64) | 1997 | 51 | NS | Duplex | Proximal | Comp + Other | Prox‡‡ | 0.86 | 1.00 | 1.00 | 0.98 | 0.10 |
| Barrellier MT(45) | 1998 | 24 | 24 | Duplex | Proximal / Distal | Comp + Other | All§§ | 1.00 | 0.67 | 0.64 | 1.00 | 0.38 |
| Prox§§ | 1.00 | 0.91 | 0.50 | 1.00 | 0.08 | |||||||
| Distal§§ | 1.00 | 0.67 | 0.64 | 1.00 | 0.38 | |||||||
| Kohler A(56) | 1998 | 112 | 76 | Duplex | Proximal / Distal | Comp | All§§ | 0.50 | 0.81 | 0.18 | 0.95 | 0.08 |
| Robinson KS(54) | 1998 | 86 | 70 | Duplex | Proximal | Comp | Prox§§ | 0.83 | 0.98 | 0.71 | 0.99 | 0.07 |
| Ciccone WJ(90) | 1998 | 202 | 63 | Duplex | Proximal / Distal | Comp + Other | All‡‡ | 0.13 | 0.99 | 0.78 | 0.86 | 0.16 |
| Prox‡‡ | 0.66 | 0.99 | 0.66 | 0.99 | 0.01 | |||||||
| Distal‡‡ | 0.10 | 0.91 | 0.58 | 0.78 | 0.15 | |||||||
| Westrich GH(63) | 1998 | 100 | 68 | Color Doppler | Proximal / Distal | Comp + Other | All‡‡ | 0.85 | 0.97 | 0.85 | 0.97 | 0.17 |
| Prox‡‡ | 0.86 | 0.98 | 0.86 | 0.98 | 0.07 | |||||||
| Westrich GH(63) | 1998 | 100 | 68 | Color Doppler | Proximal / Distal | Comp + Other | Distal‡‡ | 0.83 | 0.91 | 0.58 | 0.78 | 0.37 |
| Bressollette E(50) | 2001 | 122 | 69 | Duplex | Proximal / Distal | Comp + Other | All§§ | 0.86 | 0.95 | 0.71 | 0.98 | 0.11 |
| Prox§§ | 0.13 | 0.97 | 0.25 | 0.94 | 0.07 | |||||||
| Distal§§ | 0.62 | 0.95 | 0.62 | 0.95 | 0.11 | |||||||
| Elias A(44) | 2001 | 70 | 61 | Duplex | Proximal / Distal | Comp + Other | All§§ | 0.94 | 0.88 | 0.74 | 0.98 | 0.26 |
| Prox§§ | 1.00 | 0.95 | 0.63 | 1.00 | 0.07 | |||||||
| Distal§§ | 0.92 | 0.95 | 0.80 | 0.98 | 0.19 |
Number of subjects studied
Sensitivity
Specificity
Positive Predictive Value
Negative Predictive Value
Not Specified
Compressibility was used as unique cut-off for the diagnosis of DVT
Accuracy measured in limbs
Accuracy measured in patients
Compressibility or other criteria (intraluminal echogenic material, absence or defective color flow despite distal augmentation, blood flow around a lucent filling defect) were used as cut-off.
Results in two non-operated limbs in which only positive ultrasounds were verified by phlebography were excluded.
Two symptomatic patients were excluded.
Distal ultrasonography was performed only if no proximal DVT were detected.
Thirty-one studies (69%) included consecutive patients, assessed the two techniques independently and avoided verification bias (patients were examined with both venography and ultrasonography). Twenty-nine Level 1 studies evaluated patients after orthopedic surgery, one after neurosurgery (60), and one after thoracic and abdominal surgery (61).
We found large variability between studies for both sensitivity and specificity. We did not detect variability of the diagnostic OR, however, due to threshold (e.g. definition of compressibility) differences for Level 1 studies (p ≥ 0.05 for the test of b = 0) in all anatomical sites. The summary diagnostic ORs obtained with the unweighted model are shown in Table 3. The summary diagnostic OR of Level 1 studies minimizing the potential for bias is 379 (95% confidence limits 65, 2200) in proximal, 32 (7.5, 135) in distal veins and 29 (7.4, 114) in all veins. The summary diagnostic OR in Level 2 studies estimated are probably overstated but nonetheless suggest large values for the true diagnostic OR. Figures 1 through 3 show the summary ROC curves for proximal, distal and all veins. These figures show that many of the TPR and 1-FPR points fall close to the summary ROC curves and suggest high accuracy for ultrasound relative to venography in proximal veins.
Table 3.
Accuracy of ultrasonography (Pooled Diagnostic odds ratio)
| DVT | Number of Studies | Pooled DOR (95% CL‡) | Dependence of DOR on threshold (95% CL)§ |
|---|---|---|---|
| All veins | |||
| All Studies | 29 | 39 (12, 121) | 0.01 (-0.36, 0.38) |
| Level 1* | 17 | 29 (7.4, 114) | -0.12 (-1.2, 1.0) |
| Level 2† | 12 | 49 (7.2, 337) | 0.22 (-0.54, 0.98) |
| Proximal veins | |||
| All Studies | 39 | 645 (170, 2450) | 0.26 (-0.09, 0.61) |
| Level 1 | 28 | 379 (65, 2200) | 0.13 (-0.93, 1.2) |
| Level 2 | 11 | 1560 (188, 13000) | 0.57 (-0.14, 1.5) |
| Distal veins | |||
| All Studies | 22 | 35 (12, 105) | -0.27 (-0.52, -0.02) |
| Level 1 | 16 | 32 (7.5, 135) | -0.18 (-0.51, 0.15) |
| Level 2 | 6 | 70 (6.6, 753) | -0.42 (-0.67, -0.17) |
Blind evaluation of the two techniques and absence of verification bias and consecutive enrollment of patients
Potential for review bias, verification bias, or selection bias
Confidence Limit (CL) rounded to 3 digit accuracy
When the slope of the fitted model is close to 0, the diagnostic OR is constant across studies
Figure 1.
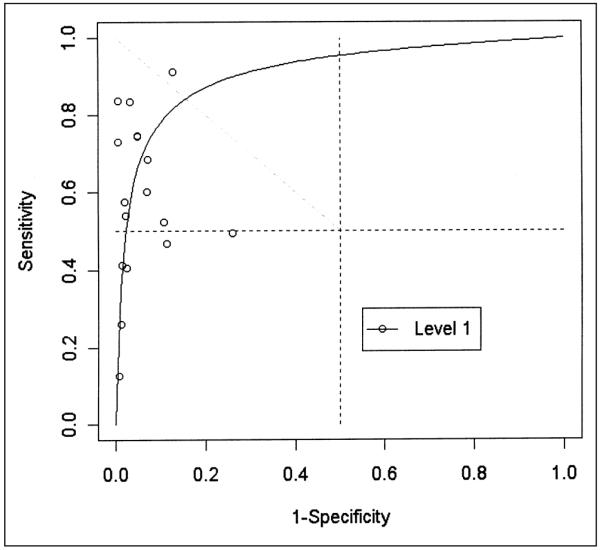
Receiving operating characteristic plot of 17 evaluations of ultrasonography compared to venography for detecting asymptomatic deep venous thrombosis in all veins in Level 1 (potentially unbiased) studies.
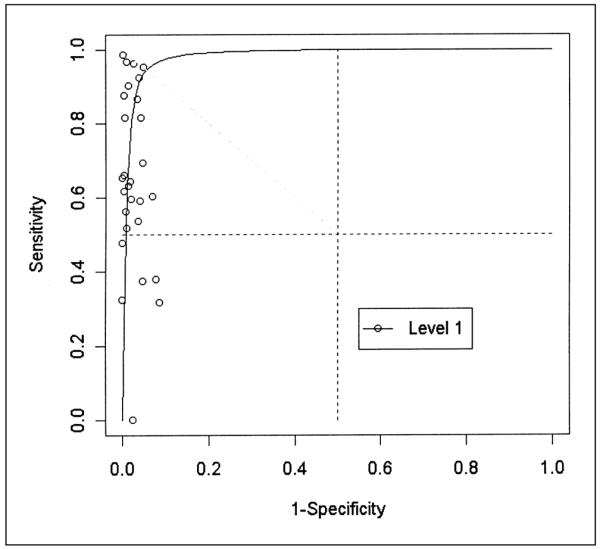
Figure 3.
Receiving operating characteristic plot of 16 evaluations of ultrasonography compared to venography for detecting asymptomatic deep venous thrombosis in distal veins in Level 1 (potentially unbiased) studies.
Discussion
Summary results obtained from any systematic review can be misleading if publication bias is present (62). Even without empirical evidence of publication bias in studies evaluating diagnostic tests, it could be important. Although we did not identify any unpublished studies, funnel plots of diagnostic OR vs. the number of subjects did not suggest the presence of publication bias in our review.
Only 69% of selected studies appeared to be designed to minimize bias. Seventeen studies did not clearly state enrollment of consecutive patients (leaving a potential for spectrum bias) and four did not mention if patients were examined independently. Four authors (49, 53, 59, 63) confirmed that five of 17 studies enrolled consecutive patients and two (50, 64) had evaluated their results in a blinded manner.
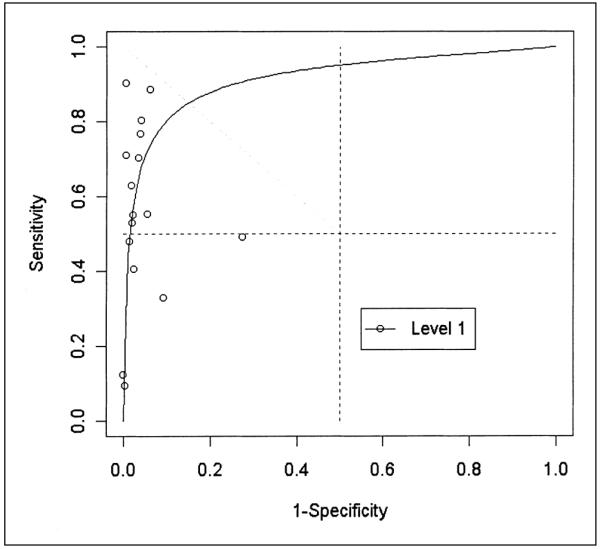
When the between-studies variability of sensitivity and specificity is large, threshold differences are a likely source of heterogeneity, and the summary ROC method is more appropriate than classic pooling because it can control for this threshold variation. Some of the observed heterogeneity in our review could be explained by differences in the threshold of compressibility used. Compressibility could depend on, for example, the anatomical site, accessibility of the veins, or the extension and onset (recent or prolonged) of the thrombosis. The judgment of the examiner and the number of anatomical sites examined by ultrasonography could also be a source of variability (65). Interobserver agreement (kappa), reported by three studies (44, 50, 66) included in our systematic review, ranged from 0.56 to 0.85. A stringent cut-off would decrease sensitivity and increase specificity and vice versa. Pooling sensitivities and specificities ignores threshold differences and led to underestimation of the accuracy (19). For instance, for proximal veins in Level 1 studies, the mean sensitivity and specificity were 0.64 (0.62, 0.65) and 0.98 (0.974, 0.983) respectively, with a large between-study heterogeneity (p value < 0.001). These results are close to pooled sensitivity (0.62, CI (0.54, 0.70) and specificity (0.97, CI (0,96, 0,98)) obtained by previous reviews (16, 18). With the summary ROC method (Fig. 2), however, a specificity of 0.98 corresponds to a sensitivity of 0.82.
Figure 2.
Receiving operating characteristic plot of 28 evaluations of ultrasonography compared to venography for detecting asymptomatic deep venous thrombosis in proximal veins in Level 1 (potentially unbiased) studies.
Three Level 2 studies evaluating DVT in all veins have used the continuous wave Doppler ultrasonography. This technique, less sensitive and specific than new methods, has been abandoned. When these studies were excluded, the diagnostic OR increases slightly in Level 2 studies, but did not influence our conclusions based on Level 1 studies.
We also explored clinical and methodological heterogeneity between studies. The radiologists’ experience with ultrasonography, the level of quality, the ultrasound technique, and other covariates were included in a meta-regression model. Our results show that ultrasonography tends to be more accurate when used after orthopedic surgery compared to other clinical settings (P = 0.059) in proximal veins, and that other selected study characteristics do not explain a large part of the observed heterogeneity. Venography is an imperfect reference standard and could influence accuracy; this influence could be measured by adding the prevalence of the disease relative to venography in the regression model. From our results, however, it is not clear whether differences in prevalence are a source of heterogeneity.
As we used the summary ROC method to summarize the accuracy of selected studies, our results depend on the validity and limitations of this method (67). The diagnostic OR calculated by the summary ROC method for Level 1 studies is large for proximal veins in asymptomatic patients. Other than two studies performed after neurosurgery and abdominal or thoracic surgery (60, 61), all Level 1 studies were performed on postoperative orthopedic patients. The performance of ultrasonography measured in one of these 2 studies (60) appears to diverge from the other results in distal and all veins (Figs. 1 and 3). Discarding these outlier observations, however, did not influence our results. The summary diagnostic OR is 404 (58, 2800) when postoperative orthopedic studies are exclusively considered.
Results of meta-analysis expressed by a summary diagnostic OR may not appeal to practicing clinicians. In Level 1 studies evaluating proximal veins, the diagnostic OR is 379 (65, 2,200). This means that for ultrasonography, the odds of positivity among patients with DVT is 379 times higher than those without DVT. The diagnostic OR cannot be used directly to calculate the probability of disease from a test result, and it is only possible to specify a summary estimate of specificity for a given sensitivity and vice versa. Despite these limitations, the summary ROC model is useful when both sensitivity and specificity show large variability and threshold differences might be a source of heterogeneity (68). The clinical usefulness of ultrasonography could be evaluated by calculating positive (probability of having a DVT when ultrasonography is positive, PPV) and negative (probability of being disease-free when ultrasonography is negative, NPV) predictive values, using summary diagnostic OR (69). Figure 4 shows that during situations of low prevalence (10%), the PPV is good (>80%) when ultrasonography is read at a false positive rate (1-specificty) of no more than 5%. When prevalence is high (30%) PPV is good (>80%) when images are read with a false positive rate as high as 10%. The NPV is good even in low prevalence situation and with a high false positive reading rate of ultrasonography.
Figure 4.
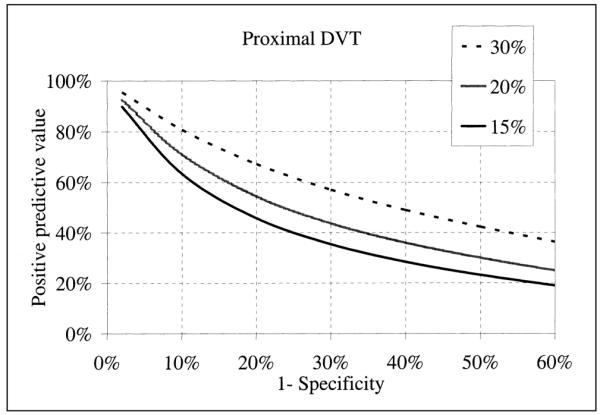
Positive predictive value of ultrasonography as a function of prevalence (15, 20 and 30%) of DVT and the false-positive rate (I-specificity) at which images are read.
Ultrasound may be used for detecting asymptomatic DVT before starting antithrombotic treatment or for excluding DVT before administering a potentially life-threatening drug. Our results suggest that ultrasound is a useful technique for postoperative orthopedic patients. Nonetheless, more research is needed to explore if ultrasound is useful in other clinical settings. The usefulness of systematic screening by ultrasound in preventing thromboembolic events has been questioned by a clinical trial (70) and a cohort study (71) in orthopedic surgery. The prevalence of DVTs in these studies, however, was low (under 3%) and it is not surprising that the number of patients needed to be tested to avoid one event (72) was high in these settings. Venography has been found cost-effective in a cohort study of patients undergoing hip replacement where the prevalence of DVT was 23% (73).
Venography and ultrasonography are usually used to detect asymptomatic DVTs as surrogate outcomes for symptomatic DVTs and to prevent pulmonary embolism. One could argue that it would be of greater clinical significance to rule out asymptomatic DVTs than rule them in, therefore sensitivity is more important than specificity. Most asymptomatic DVTs, however, develop in calf veins, and it is not known whether or not detecting and treating those DVTs is clinically beneficial. Some studies have shown that most asymptomatic DVTs resolve spontaneously (5), and it is rare that they become symptomatic or lead to pulmonary embolism or postphlebitic syndrome, but other studies mainly based on autopsies have yielded conflicting results (66). Furthermore, because bleedings have major clinical impact in patients treated with anticoagulants (74), ruling out DVT will avoid unnecessary treatment.
It should be emphasized that the relevant therapeutic objective is more the prevention of pulmonary embolism than of DVT. Because of their high rate, asymptomatic DVTs detected by imaging techniques are largely used as surrogate outcome in clinical trials. When the accuracy of a diagnostic test used to detect asymptomatic DVTs is not perfect, the treatment benefit is systematically underestimated (75). Moreover, the clinical relevance of using asymptomatic DVT as a surrogate for venous thromboembolism has not been clearly established.
In conclusion, results from our systematic review suggest that ultrasound is accurate in proximal veins for the diagnosis of asymptomatic DVT in patients hospitalized for orthopedic surgery. More research is needed to evaluate its accuracy in other clinical settings. Managing and monitoring asymptomatic DVTs with ultrasonography is, however, more complex and should be evaluated by appropriately designed studies for the reasons enumerated above.
Figure 5.
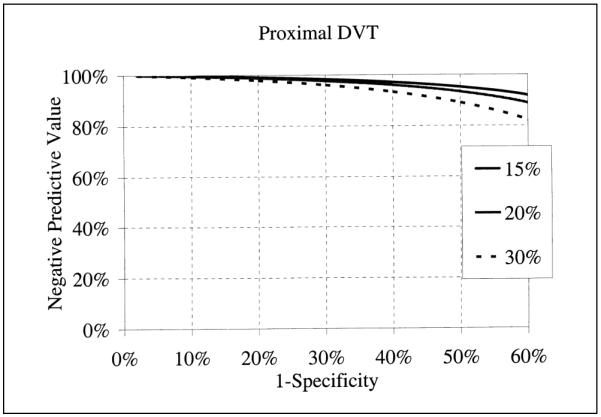
Negative predictive value of ultrasonography as a function of prevalence (15, 20 and 30%) of DVT and the false-positive rate (I-specificity) at which images are read.
Table 2.
Study characteristics
| Study characteristics (N = 47) | Category | Number of studies | % |
|---|---|---|---|
| Consecutive patients | Yes | 37 | 79% |
| NS* | 10 | 21% | |
| Work up Bias | No | 39 | 83% |
| Yes | 6 | 13% | |
| NS | 2 | 4% | |
| Blind assessment | No | 10 | 21% |
| Yes | 35 | 74% | |
| NS | 2 | 4% | |
| Settings | Orthopedic surgery | 41 | 87% |
| Abdominal surgery | 2 | 4% | |
| Neurosurgery | 2 | 4% | |
| Other surgery | 1 | 2% | |
| Internal medicine | 1 | 2% | |
| Threshold Ultrasound | Compressibility and other | 24 | 51% |
| Compressibility | 16 | 34% | |
| NS | 7 | 15% | |
| Examined Veins | Proximal and distal | 28 | 60% |
| Proximal only | 18 | 38% | |
| NS | 1 | 2% |
Not Specified.
Acknowledgements
We wish to thank Evelyne Gauthier for her assistance in sending letters to authors. We specially thank Sander Greenland, Francois Gueyffier and André Van Tran Minh for their helpful comments and Dr. J. Jund and Dr. M. Agassarian for their help in reviewing citation’s abstracts and extracting the data. We are very grateful to the following authors who completed their data: Dr. M. T. Barrellier, Dr. R. W. Barnes, Dr. C. L. Barnes, Dr. M. M. W. Beaumont-Koopman, Dr. J. J. Cronan, Dr. B. L. Davidson, Dr. A. Elias, Dr. G. Elliot, Dr. M. K. Eskandari, Dr. J. S. Ginsberg, Dr. E. Kalodiki, Dr. I. Lausen, Dr. D. Leutz, Dr. M. Mantoni, Dr. M. Monreal, Dr. B. Morgan, Dr. E. Oger, Dr. S. Rose and Dr. E. Vanninen.
Financial support: Dr. Kassai was supported by a grant from Pharmacia & Upjohn.
Appendix
The model proposed by Moses states D = bS + a where:
S (sum) = logit sensitivity + logit (1-specificity). S measures the effect of the variation in threshold (i.e. definition of compressibility) on the accuracy.
- D (difference) = logit sensitivity - logit (1-specifity). D measures the discriminating power of the diagnostic test and its antilog D, the diagnostic OR, is a single indicator of diagnostic accuracy:
-
The slope b represents the dependence of test accuracy on threshold and a is the intercept of the model.
This model says the diagnostic OR will equal the intercept whenever Sensitivity = 1-Specificity. The summary ROC method takes into account the dependence between sensitivity and specificity as a consequence of variation in threshold (e.g. definition of compressibility). When the slope b of the fitted model is zero or the diagnostic OR is constant across studies (homogeneous case), the summary ROC can be summarized by an overall diagnostic OR. When the slope is different from zero, the diagnostic OR varies with the threshold of compressibility. In this case we calculated the summary diagnostic OR assuming S = 0, or sensitivity equal to specificity. The smooth summary ROC curve can be obtained from the following relationship between Sensitivity and Specificity:We used the software program “R” (version 1.5.1) to summarize the diagnostic OR.
References
- 1.Lensing AW, Prandoni P, Prins MH, et al. Deep-vein thrombosis. Lancet. 1999;353(9151):479–85. doi: 10.1016/s0140-6736(98)04298-6. [DOI] [PubMed] [Google Scholar]
- 2.Hansson PO, Eriksson E, Welin L, et al. Prevalence of APC resistance and its relationship to arterial and venous thromboembolism in a general population sample of elderly Swedish men: The Study of Men Born in 1913. J Intern Med. 1999;245(6):593–600. doi: 10.1046/j.1365-2796.1999.00471.x. [DOI] [PubMed] [Google Scholar]
- 3.Nordstrom M, Lindblad B, Bergqvist D, et al. A prospective study of the incidence of deep-vein thrombosis within a defined urban population. J Intern Med. 1992;232(2):155–60. doi: 10.1111/j.1365-2796.1992.tb00565.x. [DOI] [PubMed] [Google Scholar]
- 4.Oger E, EPI-GETBP Study Group Incidence of venous thromboembolism: a community-based study in Western France. Thromb Haemost. 2000;83(5):657–60. Groupe d’Etude de la Thrombose de Bretagne Occidentale. [PubMed] [Google Scholar]
- 5.Geerts WH, Heit JA, Clagett GP, et al. Prevention of venous thromboembolism. Chest. 2001;119(1 Suppl):132S–175S. doi: 10.1378/chest.119.1_suppl.132s. [DOI] [PubMed] [Google Scholar]
- 6.Leizorovicz A, Kassai B, Becker F, et al. The assessment of deep vein thromboses for therapeutic trials. Angiology. 2003;54(1):19–24. doi: 10.1177/000331970305400103. [DOI] [PubMed] [Google Scholar]
- 7.Wells PS, Hirsh J, Anderson DR, et al. Accuracy of clinical assessment of deep-vein thrombosis. Lancet. 1995;345(8961):1326–30. doi: 10.1016/s0140-6736(95)92535-x. [DOI] [PubMed] [Google Scholar]
- 8.DeWeese J, Rogoff S. Phlebographic patterns of acute deep venous thrombosis of the leg. Surgery. 1963;53:99–108. [PubMed] [Google Scholar]
- 9.Rabinov K, Paulin S. Roentgen diagnosis of venous thrombosis in the leg. Arch Surg. 1972;104(2):134–44. doi: 10.1001/archsurg.1972.04180020014004. [DOI] [PubMed] [Google Scholar]
- 10.Kalodiki E, Nicolaides AN, Al-Kutoubi A, et al. How “gold” is the standard? Interobservers’ variation on venograms. Int Angiol. 1998;17(2):83–8. [PubMed] [Google Scholar]
- 11.Borris LC, Lassen MR. Venography in deep venous thrombosis: postoperative screening of patients in prophylaxis studies. Haemostasis. 1993;23(Suppl 1):80–4. doi: 10.1159/000216913. [DOI] [PubMed] [Google Scholar]
- 12.Picolet H, Leizorovicz A, Revel D, et al. Reliability of phlebography in the assessment of venous thrombosis in a clinical trial. Haemostasis. 1990;20(6):362–7. doi: 10.1159/000216151. [DOI] [PubMed] [Google Scholar]
- 13.Wille-Jorgensen P, Borris LC, Lassen MR, et al. Potential influence of observer variation in thromboprophylactic trials. Haemostasis. 1992;22(4):211–5. doi: 10.1159/000216321. [DOI] [PubMed] [Google Scholar]
- 14.Mantoni M, Strandberg C, Neergaard K, Sloth C, Jorgensen PS, Thamsen H, et al. Triplex US in the diagnosis of asymptomatic deep venous thrombosis. Acta Radiol. 1997;38(2):327–31. doi: 10.1080/02841859709172073. [DOI] [PubMed] [Google Scholar]
- 15.Samama MM, Cohen AT, Darmon JY, et al. Prophylaxis in Medical Patients with Enoxaparin Study Group A comparison of enoxaparin with placebo for the prevention of venous thromboembolism in acutely ill medical patients. N Engl J Med. 1999;341(11):793–800. doi: 10.1056/NEJM199909093411103. [DOI] [PubMed] [Google Scholar]
- 16.Kearon C, Julian JA, Newman TE, et al. Noninvasive diagnosis of deep venous thrombosis. McMaster Diagnostic Imaging Practice Guidelines Initiative. Ann Intern Med. 1998;128(8):663–77. doi: 10.7326/0003-4819-128-8-199804150-00011. [DOI] [PubMed] [Google Scholar]
- 17.Kearon C, Ginsberg JS, Hirsh J. The role of venous ultrasonography in the diagnosis of suspected deep venous thrombosis and pulmonary embolism. Ann Intern Med. 1998;129(12):1044–9. doi: 10.7326/0003-4819-129-12-199812150-00009. [DOI] [PubMed] [Google Scholar]
- 18.Wells PS, Lensing AW, Davidson BL, et al. Accuracy of ultrasound for the diagnosis of deep venous thrombosis in asymptomatic patients after orthopedic surgery. A meta-analysis. Ann Intern Med. 1995;122(1):47–53. doi: 10.7326/0003-4819-122-1-199501010-00008. [DOI] [PubMed] [Google Scholar]
- 19.Irwig L, Macaskill P, Glasziou P, Fahey M. Meta-analytic methods for diagnostic test accuracy. J Clin Epidemiol. 1995;48(1):119–30. doi: 10.1016/0895-4356(94)00099-c. [DOI] [PubMed] [Google Scholar]
- 20.Barnes CL, Nelson CL, Nix ML, et al. Duplex scanning versus venography as a screening examination in total hip arthroplasty patients. Clin Orthop. 1991;(271):180–9. [PubMed] [Google Scholar]
- 21.Barnes RW, Nix ML, Barnes CL, et al. Perioperative asymptomatic venous thrombosis: role of duplex scanning versus venography. J Vasc Surg. 1989;9(2):251–60. [PubMed] [Google Scholar]
- 22.Davidson BL, Elliott CG, Lensing AW, The RD Heparin Arthroplasty Group Low accuracy of color Doppler ultrasound in the detection of proximal leg vein thrombosis in asymptomatic high-risk patients. Ann Intern Med. 1992;117(9):735–8. doi: 10.7326/0003-4819-117-9-735. [DOI] [PubMed] [Google Scholar]
- 23.Crippa L, Ravasi F, D’Angelo SV, et al. Diagnostic value of compression ultrasonography and fibrinogen-related parameters for the detection of postoperative deep vein thrombosis following elective hip replacement: a pilot study. Thromb Haemost. 1995;74(5):1235–9. [PubMed] [Google Scholar]
- 24.Agnelli G, Volpato R, Radicchia S, et al. Detection of asymptomatic deep vein thrombosis by real-time B-mode ultrasonography in hip surgery patients. Thromb Haemost. 1992;68(3):257–60. [PubMed] [Google Scholar]
- 25.Woolson ST, McCrory DW, Walter JF, et al. B-mode ultrasound scanning in the detection of proximal venous thrombosis after total hip replacement. J Bone Joint Surg [Am] 1990;72(7):983–7. [PubMed] [Google Scholar]
- 26.Woolson ST, Pottorff G. Venous ultrasonography in the detection of proximal vein thrombosis after total knee arthroplasty. Clin Orthop. 1991;(273):131–5. [PubMed] [Google Scholar]
- 27.Rosen CL, Tracy JA. The diagnosis of lower extremity deep venous thrombosis. Emerg Med Clin North Am. 2001;19(4):895–912. doi: 10.1016/s0733-8627(05)70225-x. [DOI] [PubMed] [Google Scholar]
- 28.Berry DJ. Surveillance for venous thromboembolic disease after total knee arthroplasty. Clin Orthop. 2001;(392):257–66. doi: 10.1097/00003086-200111000-00033. [DOI] [PubMed] [Google Scholar]
- 29.Glas AS, Lijmer JG, Prins MH, et al. The diagnostic odds ratio: a single indicator of test performance. J Clin Epidemiol. 2003;56(11):1129–35. doi: 10.1016/s0895-4356(03)00177-x. [DOI] [PubMed] [Google Scholar]
- 30.Greenland S, O’Rourke K. On the bias produced by quality sores in meta-analysis, and a hierarchical view of proposed solutions. Biostatistics. 2001;2(4):463–71. doi: 10.1093/biostatistics/2.4.463. [DOI] [PubMed] [Google Scholar]
- 31.Bossuyt PM, Reitsma JB, Bruns DE, et al. Towards complete and accurate reporting of studies of diagnostic accuracy: the STARD initiative. BMJ. 2003;326(7379):41–4. doi: 10.1136/bmj.326.7379.41. [DOI] [PMC free article] [PubMed] [Google Scholar]
- 32.Moses LE, Shapiro D, Littenberg B. Combining independent studies of a diagnostic test into a summary ROC curve: data-analytic approaches and some additional considerations. Stat Med. 1993;12(14):1293–316. doi: 10.1002/sim.4780121403. [DOI] [PubMed] [Google Scholar]
- 33.Bishop Y, Fienberg S, Holland P. Pseudo-Bayes estimates of cells probabilities. In: Bishop, editor. Discrete Multivariate Analysis: Theory and Practice. MIT Press; 1975. p. 401. [Google Scholar]
- 34.Greenland S. Meta-analysis. In: Rothman K, Greenland S, editors. Modern Epidemiology. Second ed Lippincott-Raven; 1998. pp. 643–74. [Google Scholar]
- 35.Grady-Benson JC, Oishi CS, Hanson PB, et al. Routine postoperative duplex ultrasonography screening and monitoring for the detection of deep vein thrombosis. A survey of 110 total hip arthroplasties. Clin Orthop. 1994;(307):130–41. [PubMed] [Google Scholar]
- 36.Nix ML, Nelson CL, Harmon B, et al. Duplex venous scanning: Image vs Doppler accuracy. J Vas Techn. 1989;8:121–4. [Google Scholar]
- 37.Leutz DW, Stauffer ES. Color duplex Doppler ultrasound scanning for detection of deep venous thrombosis in total knee and hip arthroplasty patients. Incidence, location, and diagnostic accuracy compared with ascending venography. J Arthroplast. 1994;9(5):543–8. doi: 10.1016/0883-5403(94)90103-1. [DOI] [PubMed] [Google Scholar]
- 38.Bohler K, Baldt M, Schuller-Petrovic S, et al. Varicose vein stripping - a prospective study of the thrombotic risk and the diagnostic significance of preoperative color coded duplex sonography. Thromb Haemost. 1995;73(4):597–600. [PubMed] [Google Scholar]
- 39.Wysokinski W, Beyens G, Blockmans D, et al. Assessment of the patency of deep leg veins with duplex. Int Angiol. 1991;10(2):69–71. [PubMed] [Google Scholar]
- 40.Eskandari MK, Sugimoto H, Richardson T, et al. Is color-flow duplex a good diagnostic test for detection of isolated calf vein thrombosis in high-risk patients? Angiology. 2000;51(9):705–10. doi: 10.1177/000331970005100901. [DOI] [PubMed] [Google Scholar]
- 41.Mussurakis S, Papaioannou S, Voros D, et al. Compression ultrasonography as a reliable imaging monitor in deep venous thrombosis. Surg Gynecol Obstet. 1990;171(3):233–9. [PubMed] [Google Scholar]
- 42.Piovella F, Carbone S, Siragusa S, et al. B-mode serial compression ultrasonography in the early diagnosis of asymptomatic proximal deep-vein thrombosis after elective hip-surgery - final results of a prospective, double-blind, randomized controlled study. Thromb Haemost. 1993;69(6):1056. Abstract. [Google Scholar]
- 43.Zielinsky A, Hull R, Hirsh J, et al. Comparative study of doppler ultrasound (Dp) and impedance plethysmography (ipg) in diagnosis of symptomatic and asymptomatic deep-vein thrombosis (Dvt) Circulation. 1978;58(4):117. [Google Scholar]
- 44.Elias A, Cadène A, Elias M, et al. Ultrasound and asymptomatic deep vein thrombosis after total hip replacement: Diagnostic efficacy, interobserver agreement and follow-up at three months. Thromb Haemost. 2001:P702. Abstract. [Google Scholar]
- 45.Barrellier MT, Jouen E, Creveuil C. Discrepancies between the results of phlebography and Doppler ultrasonography in the diagnosis of asymptotic venous thrombosis after total hip prosthesis. False negatives of phlebography or false positives of Doppler ultrasonography. J Mal Vasc. 1998;23(3):183–90. [PubMed] [Google Scholar]
- 46.Moser G, Krahenbuhl B, Donath A. Prevention of deep venous thrombosis (TVP) and pulmonary embolism. Comparison of heparin (3 × 5000 IU/day), heparin (2 × 5000 IU/day) + 0.5 mg dihydroergot, and physiotherapy (intermittent compression stockings + physical exercise). Value of Doppler diagnosis in systematic detection of TVP compared with phlebography and scanning of the legs using labelled fibrinogen. Helv Chir Acta. 1980;47(12):145–9. [PubMed] [Google Scholar]
- 47.Barzi F, Lupattelli L, Corneli P, et al. Impedance plethysmography, Doppler echography and phlebography in deep venous thromboses of the lower limbs. Radiol Med. 1990;79(3):224–7. [PubMed] [Google Scholar]
- 48.Kalodiki E, Nicolaides AN, al-Kutoubi A, et al. Duplex scanning in the postoperative surveillance of patients undergoing total hip arthroplasty. J Arthroplast. 1997;12(3):310–6. doi: 10.1016/s0883-5403(97)90028-0. [DOI] [PubMed] [Google Scholar]
- 49.Garino JP, Lotke PA, Kitziger KJ, et al. Deep venous thrombosis after total joint arthroplasty. The role of compression ultrasonography and the importance of the experience of the technician. J Bone Joint Surg [Am] 1996;78(9):1359–65. doi: 10.2106/00004623-199609000-00010. [DOI] [PubMed] [Google Scholar]
- 50.Bressollette L, Nonent M, Oger E, et al. Diagnostic accuracy of compression ultrasonography for the detection of asymptomatic deep venous thrombosis in medical patients - the TADEUS project. Thromb Haemost. 2001;86(2):529–33. [PubMed] [Google Scholar]
- 51.Dorfman GS, Froehlich JA, Cronan JJ, et al. Lower-extremity venous thrombosis in patients with acute hip fractures: determination of anatomic location and time of onset with compression sonography. AJR. 1990;154(4):851–5. doi: 10.2214/ajr.154.4.2107688. [DOI] [PubMed] [Google Scholar]
- 52.Froehlich JA, Dorfman GS, Cronan JJ, et al. Compression ultrasonography for the detection of deep venous thrombosis in patients who have a fracture of the hip. A prospective study. J Bone Joint Surg [Am] 1989;71(2):249–56. [PubMed] [Google Scholar]
- 53.Monreal M, Montserrat E, Salvador R, et al. Real-time ultrasound for diagnosis of symptomatic venous thrombosis and for screening of patients at risk: correlation with ascending conventional venography. Angiology. 1989;40(6):527–33. doi: 10.1177/000331978904000603. [DOI] [PubMed] [Google Scholar]
- 54.Robinson KS, Anderson DR, Gross M, et al. Accuracy of screening compression ultrasonography and clinical examination for the diagnosis of deep vein thrombosis after total hip or knee arthroplasty. Can J Surg. 1998;41(5):368–73. [PMC free article] [PubMed] [Google Scholar]
- 55.Cronan JJ, Froehlich JA, Dorfman GS. Imagedirected Doppler ultrasound: a screening technique for patients at high risk to develop deep vein thrombosis. J Clin Ultrasound. 1991;19(3):133–8. doi: 10.1002/jcu.1870190302. [DOI] [PubMed] [Google Scholar]
- 56.Kohler A, Hoffmann R, Platz A, et al. Diagnostic value of duplex ultrasound and liquid crystal contact thermography in preclinical detection of deep vein thrombosis after proximal femur fractures. Arch Orthop Trauma Surg. 1998;117(12):39–42. doi: 10.1007/BF00703437. [DOI] [PubMed] [Google Scholar]
- 57.Borris LC, Christiansen HM, Lassen MR, et al. The Venous Thrombosis Group Comparison of real-time B-mode ultrasonography and bilateral ascending phlebography for detection of postoperative deep vein thrombosis following elective hip surgery. Thromb Haemost. 1989;61(3):363–5. [PubMed] [Google Scholar]
- 58.Vanninen R, Manninen H, Soimakallio S, et al. Asymptomatic deep venous thrombosis in the calf: accuracy and limitations of ultrasonography as a screening test after total knee arthroplasty. Br J Radiol. 1993;66(783):199–202. doi: 10.1259/0007-1285-66-783-199. [DOI] [PubMed] [Google Scholar]
- 59.Rose SC, Zwiebel WJ, Murdock LE, et al. Insensitivity of color Doppler flow imaging for detection of acute calf deep venous thrombosis in asymptomatic postoperative patients. J Vas Interv Radiol. 1993;4(1):111–7. doi: 10.1016/s1051-0443(93)71832-1. [DOI] [PubMed] [Google Scholar]
- 60.Jongbloets LM, Lensing AW, Koopman MM, et al. Limitations of compression ultrasound for the detection of symptomless postoperative deep vein thrombosis. Lancet. 1994;343(8906):1142–4. doi: 10.1016/s0140-6736(94)90240-2. [DOI] [PubMed] [Google Scholar]
- 61.Lausen I, Jensen R, Wille-Jorgensen P, et al. Colour Doppler flow imaging ultrasonography versus venography as screening method for asymptomatic postoperative deep venous thrombosis. Eur J Radiol. 1995;20(3):200–4. doi: 10.1016/0720-048x(95)00662-a. [DOI] [PubMed] [Google Scholar]
- 62.Thornton A, Lee P. Publication bias in metaanalysis: its causes and consequences. J Clin Epidemiol. 2000;53(2):207–16. doi: 10.1016/s0895-4356(99)00161-4. [DOI] [PubMed] [Google Scholar]
- 63.Westrich GH, Allen ML, Tarantino SJ, et al. Ultrasound screening for deep venous thrombosis after total knee arthroplasty. 2-year reassessment. Clin Orthop. 1998;(356):125–33. doi: 10.1097/00003086-199811000-00018. [DOI] [PubMed] [Google Scholar]
- 64.Morgan B, Tudor G, Green J, et al. Screening post surgical high risk groups for proximal deep venous thrombosis with ultrasound: A practical alternative to venography. Knee. 1997;4(2):77–9. [Google Scholar]
- 65.Badgett DK, Comerota MC, Khan MN, et al. Duplex venous imaging: role for a comprehensive lower extremity examination. Ann Vasc Surg. 2000;14(1):73–6. doi: 10.1007/s100169910013. [DOI] [PubMed] [Google Scholar]
- 66.Atri M, Herba MJ, Reinhold C, et al. Accuracy of sonography in the evaluation of calf deep vein thrombosis in both postoperative surveillance and symptomatic patients. AJR. 1996;166(6):1361–7. doi: 10.2214/ajr.166.6.8633448. et al. [DOI] [PubMed] [Google Scholar]
- 67.Walter SD. Properties of the summary receiver operating characteristic (SROC) curve for diagnostic test data. Stat Med. 2002;21(9):1237–56. doi: 10.1002/sim.1099. [DOI] [PubMed] [Google Scholar]
- 68.Lijmer JG, Bossuyt PM, Heisterkamp SH. Exploring sources of heterogeneity in systematic reviews of diagnostic tests. Stat Med. 2002;21(11):1525–37. doi: 10.1002/sim.1185. [DOI] [PubMed] [Google Scholar]
- 69.Cher DJ, Conwell JA, Mandel JS. MRI for detecting silicone breast implant rupture: meta-analysis and implications. Ann Plast Surg. 2001;47(4):367–80. doi: 10.1097/00000637-200110000-00002. [DOI] [PubMed] [Google Scholar]
- 70.Robinson KS, Anderson DR, Gross M, et al. Ultrasonographic screening before hospital discharge for deep venous thrombosis after arthroplasty: the post-arthroplasty screening study. A randomized, controlled tiral. Ann Intern Med. 1997;127(6):439–45. doi: 10.7326/0003-4819-127-6-199709150-00004. [DOI] [PubMed] [Google Scholar]
- 71.Leclerc JR, Gent M, Hirsh J, Geerts WH, Ginsberg JS, Canadian Collaborative Group The incidence of symptomatic venous thromboembolism during and after prophylaxis with enoxaparin: a multi-institutional cohort study of patients who underwent hip or knee arthroplasty. Arch Intern Med. 1998;158(8):873–8. doi: 10.1001/archinte.158.8.873. [DOI] [PubMed] [Google Scholar]
- 72.Sackett DL. Meta-analytic methods for diagnostic accuracy: Discussion. J Clin Epidemiol. 1995;48(1):131–2. doi: 10.1016/0895-4356(94)00099-c. [DOI] [PubMed] [Google Scholar]
- 73.Pellegrini VD, Jr., Clement D, Lush-Ehmann C, et al. The John Charnley Award. Natural history of thromboembolic disease after total hip arthroplasty. Clin Orthop. 1996;(333):27–40. [PubMed] [Google Scholar]
- 74.Linkins LA, Choi PT, Douketis JD. Clinical impact of bleeding in patients taking oral anticoagulant therapy for venous thromboembolism: a meta-analysis. Ann Intern Med. 2003;139(11):893–900. doi: 10.7326/0003-4819-139-11-200312020-00007. [DOI] [PubMed] [Google Scholar]
- 75.Rodgers A, MacMahon S. Systematic underestimation of treatment effects as a result of diagnostic test inaccuracy: implications for the interpretation and design of thromboprophylaxis trials. Thromb Haemost. 1995;73(2):167–71. [PubMed] [Google Scholar]
- 76.Milne RM, Gunn AA, Griffiths JM, et al. Postoperative deep venous thrombosis. A comparison of diagnostic techniques. Lancet. 1971;2(7722):445–7. doi: 10.1016/s0140-6736(71)92623-7. [DOI] [PubMed] [Google Scholar]
- 77.Mitsunaga MM, Ferris EB, 3rd, Kong AY, et al. Thromboembolism after hip surgery. Comparison of screening methods. Postgrad Med. 1986;80(4):42–3. 46–7. doi: 10.1080/00325481.1986.11699529. [DOI] [PubMed] [Google Scholar]
- 78.Flinn WR, Sandager GP, Cerullo LJ, et al. Duplex venous scanning for the prospective surveillance of perioperative venous thrombosis. Arch Surg. 1989;124(8):901–5. doi: 10.1001/archsurg.1989.01410080031004. [DOI] [PubMed] [Google Scholar]
- 79.Borris LC, Christiansen HM, Lassen MR, et al. The Venous Thrombosis Group Real-time B-mode ultrasonography in the diagnosis of postoperative deep vein thrombosis in non-symptomatic high-risk patients. Eur J Vasc Surg. 1990;4(5):473–5. doi: 10.1016/s0950-821x(05)80786-8. [DOI] [PubMed] [Google Scholar]
- 80.Comerota AJ, Katz ML, Greenwald LL, et al. Venous duplex imaging: should it replace hemodynamic tests for deep venous thrombosis? J Vasc Surg. 1990;11(1):53–9. doi: 10.1067/mva.1990.16342. discussion 59-61. [DOI] [PubMed] [Google Scholar]
- 81.White RH, Goulet JA, Bray TJ, et al. Deep-vein thrombosis after fracture of the pelvis: assessment with serial duplex-ultrasound screening. J Bone Joint Surg [Am] 1990;72(4):495–500. [PubMed] [Google Scholar]
- 82.Ginsberg JS, Caco CC, Brill-Edwards PA, et al. Venous thrombosis in patients who have undergone major hip or knee surgery: detection with compression US and impedance plethysmography. Radiology. 1991;181(3):651–4. doi: 10.1148/radiology.181.3.1947076. [DOI] [PubMed] [Google Scholar]
- 83.Mattos MA, Londrey GL, Leutz DW, et al. Color-flow duplex scanning for the surveillance and diagnosis of acute deep venous thrombosis. J Vasc Surg. 1992;15(2):366–75. doi: 10.1067/mva.1992.33847. [DOI] [PubMed] [Google Scholar]
- 84.Tremaine MD, Choroszy CJ, Gordon GH, et al. Diagnosis of deep venous thrombosis by compression ultrasound in knee arthroplasty patients. J Arthroplast. 1992;7(2):187–92. doi: 10.1016/0883-5403(92)90015-i. [DOI] [PubMed] [Google Scholar]
- 85.Elliott CG, Suchyta M, Rose SC, et al. Duplex ultrasonography for the detection of deep vein thrombi after total hip or knee arthroplasty. Angiology. 1993;44(1):26–33. doi: 10.1177/000331979304400105. [DOI] [PubMed] [Google Scholar]
- 86.Grady-Benson JC, Oishi CS, Hanson PB, et al. Postoperative surveillance for deep venous thrombosis with duplex ultrasonography after total knee arthroplasty. J Bone Joint Surg [Am] 1994;76(11):1649–57. doi: 10.2106/00004623-199411000-00008. [DOI] [PubMed] [Google Scholar]
- 87.Bombardini T, Borghi B, Mattioli R, et al. Proximal deep vein thrombosis: the use of the echoDoppler for diagnosis and therapeutic indications. Chir Organi Mov. 1995;80(1):61–4. [PubMed] [Google Scholar]
- 88.Magnusson M, Eriksson BI, Kalebo P, et al. Is colour Doppler ultrasound a sensitive screening method in diagnosing deep vein thrombosis after hip surgery? Thromb Haemost. 1996;75(2):242–5. [PubMed] [Google Scholar]
- 89.Lensing AW, Doris CI, McGrath FP, et al. A comparison of compression ultrasound with color Doppler ultrasound for the diagnosis of symptomless postoperative deep vein thrombosis. Arch Intern Med. 1997;157(7):765–8. [PubMed] [Google Scholar]
- 90.Ciccone WJ, Fox PS, Neumyer M, et al. Ultrasound surveillance for asymptomatic deep venous thrombosis after total joint replacement. J Bone Joint Surg [Am] 1998;80(8):1167–74. doi: 10.2106/00004623-199808000-00010. [DOI] [PubMed] [Google Scholar]