Abstract
Background and Aims
Measuring the Al3+ uptake rate across the plasma membrane of intact root cells is crucial for understanding the mechanisms and time-course of Al toxicity in plants. However, a reliable method with the sufficient spatial and temporal resolution to estimate Al3+ uptake in intact root cells does not exist.
Methods
In the current study, fluorescent lifetime imaging (FLIM) analysis was used to quantify Al3+ uptake in the root-cell cytoplasm in vivo. This was performed via the estimation of the fluorescence lifetime of Al–lumogallion {5-chloro-3[(2,4-dihydroxyphenyl)azo]-2-hydroxybenzenesulfonic acid} complexes and measurements of intracellular pH while exposing arabidopsis seedlings to acidic and Al3+ stresses.
Key Results
The lifetime of Al–lumogallion complexes fluorescence is pH-dependent. The primary sites for Al3+ entry are the meristem and distal elongation zones, while Al3+ uptake via the cortex and epidermis of the mature root zone is limited. The maximum rates of Al uptake into the cytoplasm (2–3 µmol m−3 min−1 for the meristematic root zone and 3–7 µmol m−3 min−1 for the mature zone) were observed after a 30-min exposure to 100 µm AlCl3 (pH 4·2). Intracellular Al concentration increased to 0·4 µm Al within the first 3 h of exposure to 100 µm AlCl3.
Conclusions
FLIM analysis of the fluorescence of Al–lumogallion complexes can be used to reliably quantify Al uptake in the cytoplasm of intact root cells at the initial stages of Al3+ stress.
Key words: Acid stress, Al3+, aluminium toxicity, Arabidopsis thaliana, low pH, fluorescent lifetime imaging (FLIM), lumogallion
INTRODUCTION
Establishing the time-course and sites of the root targeted by Al3+ is essential for understanding the mechanisms of Al toxicity in plants. Giant algal cells (Chara corallina), which can be physically separated into the cell wall, intracellular content and vacuole, were used to measure 26Al radioactive isotope uptake across the plasma membrane and the tonoplast (Taylor et al., 2000). However, a reliable method with sufficient spatial and temporal resolution to estimate Al3+ uptake across the plasma membrane of intact root cells does not exist.
Sutheimer and Cabaniss (1995) described a method for determining trace concentrations of Al using fluorescent detection of the Al–lumogallion {5-chloro-3[(2,4-dihydroxyphenyl)azo]-2-hydroxybenzenesulphonic acid} complex. These authors were able to detect all forms of Al (except polymers), demonstrating the usefulness of this method in determining free and complexed forms of monomeric Al. Since then, lumogallion has been used for the fluorescent detection of Al3+ in the root tips of soybean and loblolly pine (Silva et al., 2000; Moyer-Henry et al., 2005) and cultured tobacco cells (Kataoka et al., 1997; Iikura et al., 2001). However, in these cases the dye was applied to non-intact plants and cells. For example, root tips were cut, embedded in agar and stained at 50°C (Silva et al., 2000) or fixed and stained (Kataoka et al., 1997). These treatments may perturb Al distribution and distort quantification within the root tissues and cells. Al ions are highly mobile and easily form complexes with organic and inorganic compounds, thus making the interpretation of results difficult.
In addition to the approach described above, plant tissue can be cut, stained and a fluorescent dye can be loaded into the intact plant or tissue (Zhang et al., 1998). This approach is widely used in fluorescent microscopy and allows for the in vivo tracking of different molecules and ions in plants (Day, 2005; Domaille et al., 2008). However, quantification of the studied molecule/ion using conventional confocal microscopy is usually not precise, since fluorescence intensity is dependent not only on concentration of the molecule/ion, but also on the concentration of fluorescent dyes. Better quantification of molecules/ions that can be bound to a fluorescent dye has become possible with recent advances in the fluorescence lifetime imaging (FLIM) technique (Lakowicz et al., 1992) and commercially available units for time-correlated single-photon counting (TCSPC) (Becker et al., 2004), because the fluorescence light emitted by a fluorophore does not only depend on its emission intensity and emission spectrum, but it also has a specific lifetime. The fluorescence lifetime is a specific parameter of a fluorophore and is independent of fluorophore concentration, photobleaching and excitation intensity (Lakowicz, 1999). However, fluorescent lifetime depends on local environmental factors, such as ion concentration, which regulate the bound/unbound states of a fluorophore (Lakowicz, 1999). FLIM has been used to measure pH, ion concentrations or oxygen saturation (Lakowicz and Szmacinski, 1993), aggregation effects (Kelbauskas and Dietel, 2002), protein or DNA structures (Knemeyer et al., 2000). FLIM is also a powerful tool that can be used to discriminate the components of a fluorescent dye from tissue autofluorescence (Konig and Riemann, 2003).
In this study, Al uptake was estimated in intact arabidopsis seedlings pre-loaded with lumogallion and subjected to conventional confocal imaging and FLIM.
MATERIAL AND METHODS
Plant material
The seeds of wild-type Arabidopsis thaliana plants ecotype Col-0 were treated as described previously (Babourina et al., 2005). The seeds were surface sterilized with 1% (w/v) calcium hypochlorite and placed into Petri dishes on agar media consisting of 1 mm KCl + 0·1 mm CaCl2 (basal solution medium, BSM) and 0·8% (w/v) agar. Seeds were germinated in a growth chamber (25°C/20°C, 14/10 h day/night cycle, light intensity 150 µmol m−2 s−1). Petri dishes were positioned vertically. Measurements were conducted on 4-d-old plants. All solutions were prepared with Milli-Q water (Millipore Corp, Billerica, MA, USA).
Confocal and FLIM microscopy
Fluorescence lifetime imaging (FLIM) was used to quantify Al3+ uptake in the cytoplasm in vivo, estimating fluorescence lifetime of Al–lumogallion complexes and intracellular pH during exposure of arabidopsis seedlings (Col-0) to acidic and Al3+ stresses. Lumogallion was loaded into intact seedlings to estimate the kinetics of Al uptake. Seedlings were exposed for 1 h to 0·5 mm lumogallion dissolved in the BSM at room temperature of 22°C in the dark. The dye was taken up and distributed evenly within different root zones. In parallel experiments, plants loaded with lumogallion were rinsed in the BSM solution for 5 h, then transferred back to agar media for continued growth. This type of loading (i.e. a cell-permeable fluorescent dye is taken up by intact plant cells) has been employed by other research groups (Allen et al., 1999; Illes et al., 2006).
For conventional confocal multiphoton microscopy and FLIM measurements, a 4-d old seedling was placed in the chamber on the stage of an inverted confocal microscope (Leica TCS SP2 AOBS, Leica Microsystems GmbH, Wetzlar, Germany). Light pulses were generated at a frequency of 80 MHz by the Mai Tai laser (Spectra Physics, Mountain View, CA, USA). Excitation wavelength was set at 940 nm. Fluorescence was recorded by a photo multiplier between 538 nm and 686 nm. FLIM analysis was performed using electronics (SPC-730; Becker & Hickl, Berlin, Germany) and software (SPC7.22; Becker & Hickl) for time-correlated single-photon counting. Lifetime images were analysed using SPC Image 2.6 (Becker & Hickl). At the excitation and emission wavelengths used in this study, no image was obtained with either conventional or FLIM microscopy using plants that had not undergone dye loading.
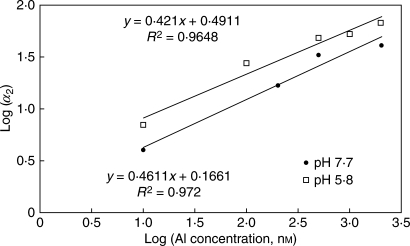
During FLIM calibration, it was observed that the fluorescence lifetime of Al–lumogallion complexes was highly dependent on intracellular pH (Fig. 1). In parallel experiments with the fluorescent pH indicator, BCECF [2′,7′-bis-(2-carboxyethyl)-5-(and-6)-carboxyfluorescein] (Invitrogen, Carlsbad, CA, USA), changes in intracellular pH in arabidopsis seedlings were estimated during imposed acidic and Al3+ stresses. The fluorescence lifetime of the second component was estimated to be 1·58 ± 0·01 ns at pH 5·8, and 1·16 ± 0·02 ns at pH 7·7.
Fig. 1.
Calibration of the Al–lumogallion complex fluorescence lifetime parameter (α2) at varying pH values.
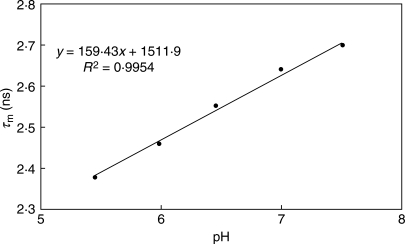
For BCECF calibration, its potassium salt dissolved in different buffers was used. However, a shift (approx. 0·45 ns) was found between in vitro and in vivo calibrations, similar to other studies where a shift of 0·4 ns has been observed (Nakabayashi et al., 2007). For in vivo calibrations, CCCP (carbonyl cyanide m-chlorophenylhydrazone) was used as a protonophore to eliminate a gradient between external and internal H+ concentrations. For calibration, the mean lifetime of BCECF at different pH values was used assuming a single exponential decay for BCECF (Niesner et al., 2005; Fig. 2).
Fig. 2.
The pH-dependence of mean lifetimes (τm) of the fluorescence intensity decay of BCECF.
RESULTS
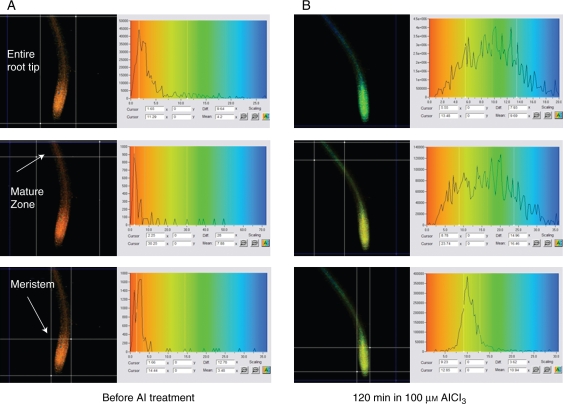
Figure 3 illustrates the typical appearance of a lifetime parameter α2 of Al–lumogallion complexes before and after Al treatment. FLIM analysis allows for the estimation of lifetime changes in different parts of any acquired image. Depending on magnification, it is possible to quantify differences in the dye's lifetime parameters within a single cell, tissue layer, etc. The panels on the right side of Fig. 3 highlight different α2 distribution within the mature and meristem zones of the root, when a seedling was exposed to 100 µm AlCl3. In this particular example, despite a higher fluorescence intensity of Al–lumogallion complexes in the meristem zone, Al3+ concentration was greater in the mature zone, since higher α2 values indicate higher Al3+ concentrations (Fig. 1): the means for α2 were 16·46 and 10·94 for the mature and meristem zones, respectively.
Fig. 3.
FLIM-estimated α2 distribution of lumogallion and Al–lumogallion complexes in different parts of the root tip (A) before and (B) after exposure to 100 µm AlCl3. In each case the right panels demonstrate α2 distribution within the rectangle (region of interest) that is formed by the white lines in the left panels. The white lines in the right panels indicate data which are used for calculation of the mean. The x-axis indicates the amplitudes (α2) of the long fluorescence lifetime (τ2); the y-axis indicates counts within the selected region of interest. The α2 value is calculated as a mean of the distribution within the region of interest.
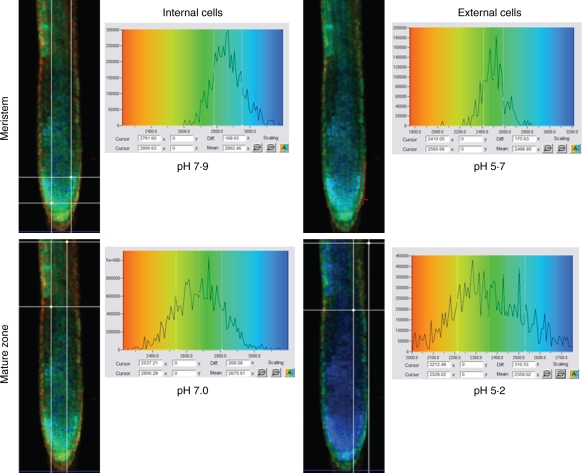
The change in pH in internal and external cells of the meristem and mature zones of a representative root is shown in Fig. 4. Seedlings exposed to 100 µm AlCl3 (pH 4·2) maintained high intracellular pH (7·8–7·9) in the internal layers of the meristem zone, whereas pH dropped significantly (pH 5–6) in the external layer. Since the acid loading technique for this dye was used, these low pH values could be referred to as the cytoplasm values, where esterases are cleaving the non-fluorescent dye–AM ester. However, the dye might be partially excluded from the cytoplasm to the vacuole or the apoplast, which makes it more appropriate to refer these pH values to the overall tissue. These relatively low pH values might be explained by high H+ influx as found in our earlier studies (Babourina et al., 2005). Both internal and external cells of the meristem zone were less acidic than cells of the mature zone after a 1 h exposure to 100 µm AlCl3. Based on these results obtained in parallel experiments, the appropriate calibration (Fig. 1) was used for calculations of Al3+ concentrations in different layers within the root zones.
Fig. 4.
FLIM estimation of intracellular pH in arabidopsis seedlings exposed to 100 µm AlCl3 for 1 h. In each case the right panels show the lifetime distribution of the 2′,7′-bis-(2-carboxyethyl)-5-( and-6)-carboxyfluorescein acetoxymethyl ester (BCECF) for the area located within the free shapes drawn with a red line or rectangular formed by the white lines. The colour distribution in microphotographs in the left panels is based on BCECF lifetime distribution that was calculated and presented in the right panels. The mean pH is more acidic in the external cells (one or two layers of the surface cells) of both root zones.
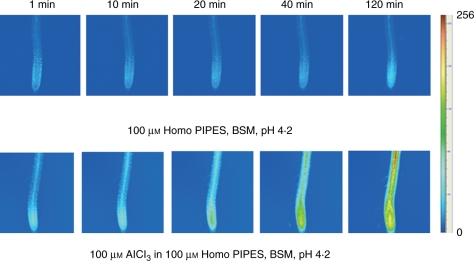
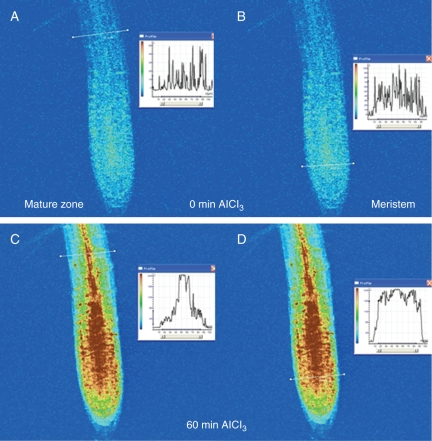
Figure 5 demonstrates changes in the fluorescence of Al–lumogallion complexes using conventional microscopy. The top row of images demonstrates that lumogallion fluorescence slightly increased when seedlings were exposed to the low pH control (0 Al); probably due to both impurities in a bathing solution and the high dye sensitivity. However, plant exposure to Al3+ led to higher fluorescence (the bottom row) compared with the 0 Al control. The fluorescence of Al–lumogallion complexes from within the root-tip cells after 60-min exposure to 100 µm AlCl3 is depicted in Fig. 6. Before Al treatment, dye fluorescence was evenly distributed within the root, as can be seen in cross-sections of the mature and meristem zones (Fig. 6A, B). After 60-min exposure to 100 µm AlCl3, the fluorescence in the meristem zone dramatically increased; however, it was evenly distributed, as can be seen on the inset (Fig. 6D). In the mature zone, higher fluorescence of Al–lumogallion complexes occurred in the central column of the primary vascular tissue (Fig. 6C).
Fig. 5.
Changes in fluorescence of Al–lumogallion complexes in arabidopsis seedlings exposed to acidic stress either without Al3+ or acidic stress with 100 µm AlCl3. The bar on the right demonstrates the colour distribution of fluorescence intensity (256 levels).
Fig. 6.
Profiles of the distribution of fluorescence of Al–lumogallion complexes across the mature (A, C) and meristem zones of arabidopsis roots (B, D) loaded with lumogallion before Al treatment (A, B) and after 60 min of 100 µm AlCl3 exposure (C, D). Insets demonstrate fluorescence distribution along the white lines.
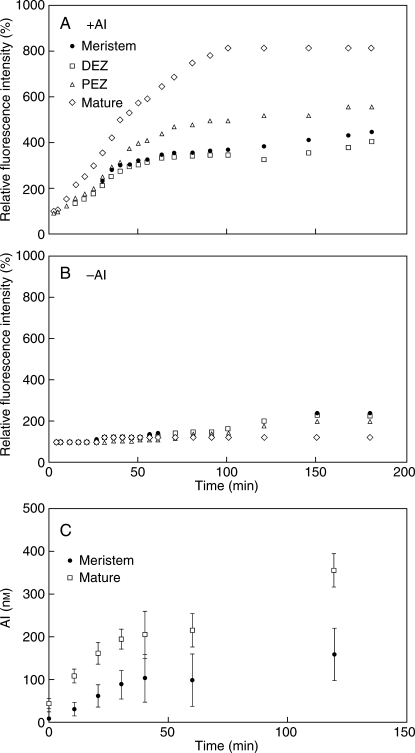
The time-dependent changes in fluorescence of Al–lumogallion complexes for different root zones obtained by conventional microscopy are shown in Fig. 7(A,B). The mature zone demonstrated the most substantial increase in fluorescence of Al–lumogallion complexes upon exposure to Al.
Fig. 7.
Changes in lumogallion fluorescence in different root zones of a representative plant after exposure to either low pH without Al (A) or 100 µm AlCl3 at pH 4·2 (B): the meristem zone, the distal elongation zone (DEZ), the proximal elongation zone (PEZ), and the mature zone. Fluorescence is expressed as a percentage relative to the intensity before Al treatment. (C) Aluminium concentration in the root tip and mature root cells of arabidopsis seedlings estimated by FLIM analysis. AlCl3 (100 µm) was applied at 0 min. Error bars represent ± s.e., n = 7.
The quantification of changes in Al3+ concentration in the plant root was performed using FLIM analysis (Fig. 7C). The maximum rate of Al uptake into the root-cell cytoplasm was observed after the first 30 min following the application of 100 µm AlCl3 solution. After calculations based on Al–lumogallion calibration (Fig. 1), the Al uptake rate was estimated to be 2–3 µmol m−3 min−1 for the meristematic root zone and 3–7 µmol m−3 min−1 for the mature zone. An increase in the Al uptake rate after the initial 30 min was relatively small. Internal Al concentrations increased up to 0·35 ± 0·03 µm Al within the first 3 h of exposure to 100 µm AlCl3.
DISCUSSION
In earlier investigations, researchers used fresh tissue cuts or chemically fixed cultured cells to observe Al–lumogallion complexes within plant cells and tissues (Silva et al., 2000; Iikura et al., 2001; Moyer-Henry et al., 2005). However, Al3+ ions are highly mobile and plant samples require water free treatments, otherwise Al3+ ions could be easily delocalised or dissolved in water. We suggest that alterations in Al localization within plant tissues can be resolved by (a) using frozen plant tissues followed by sectioning without water contact, or (b) using in vivo staining; the second method was applied in the current study. Our data demonstrate that lumogallion dye can be used to observe in vivo changes in Al concentration in the cytoplasm of the intact root-tip cells. As far as is known, this is the first attempt to estimate the Al uptake rate across the plasma membrane of the higher-plant cells.
There is a general perception that all parts of the root are capable of ion absorption, but the absorption capacity changes along the root axis, depending on the level of cell wall suberization (Kolek and Kozinka, 1992). In the mature zone, where Casparian strips have developed, ions have to be transferred into the symplast to be taken further into the plant. The plasma membrane of the epidermis and cortex cells is considered to be capable of ion transfer from the apoplast to the symplast for major nutrient ions. However, does Al3+ use a similar pathway? From the present study, this does not appear to be the case. Instead, it suggests that Al3+ entry via cortex and epidermis cells of the mature root zone is limited, and the main pathway for Al3+ entry into the plant is via the meristem and distal elongation zones with the following movement to the xylem along with the water flow, as suggested in the canal theory for water transport in the stele of plant roots (Katou et al., 1987). Increases in fluorescence in the cortex of the mature zone were not observed within the first 30 min of AlCl3 treatment (Fig. 5); and after 60 min, fluorescence distribution of Al–lumogallion complex in the mature zone was not uniform with the higher intensity that was found for the stele (Fig. 6A, C). In contrast to the mature zone, Al3+ was taken up by the meristem zone evenly (Fig. 6B, D). Therefore, these data suggest that Al3+ was transported up to the stele of the mature zone from the meristem rather than crosswise from the cortex.
There are many published observations that indirectly confirm the present results. First, the distal elongation zone is the main area of the root tip that is affected by Al3+ toxicity (Ryan et al., 1993; Sivaguru and Horst, 1998). This area exhibits most of the changes in elongation rate under sudden Al3+ exposure (Sivaguru and Horst, 1998) as well as higher plasma membrane depolarization (Illes et al., 2006). From the present results, it appears that the meristem and distal elongation zones are also the primary areas where Al3+ enters the root cells. Therefore, the most affected area of the root tip is apparently the area where Al enters into the cytoplasm.
Secondly, if our assertion is correct and Al is taken up by the meristem and distal elongation zones and transported to the mature zone via xylem, the interruption of cell division and expansion are, at least partly, due to the effect of intracellular Al3+. The toxic effect of Al3+ on cell division and cell elongation in plant root cells has been observed in different plant species (Clarkson, 1965; Wallace and Anderson, 1984; Ryan et al., 1993; Llugany et al., 1995; Sivaguru and Horst, 1998).
Thirdly, a greater effect of Al3+ on internal, relative to epidermal root cells in the mature zone has been observed in electrophysiological studies. The outer cells of the proximal elongation zone, where the cortex layer has already developed, demonstrated lower depolarization under Al treatment in comparison with the outer cells of the distal elongation zone, where tissues are not fully differentiated (Sivaguru et al., 1999). Sivaguru et al. suggested that the binding of Al to cells of the epidermis and outer cortex may simultaneously induce the transfer of putative signals, which are transmitted to inner cell layers. We hypothesize that the internal cells of the mature root (stele) demonstrate higher depolarization, because Al3+ concentration in these cells is higher than in external cells (cortex); and therefore these internal cells are more severely affected after AlCl3 exposure.
It can be concluded that: (a) FLIM analysis of the Al–lumogallion complex allows for more precise quantification of Al uptake in the cytoplasm of intact root cells in the early stages of Al toxicity stress; and (b) the primary sites for Al3+ entry are the meristem and distal elongation zones, while Al3+ uptake via cortex and epidermis in the mature zone is limited.
ACKNOWLEDGEMENTS
The authors acknowledge the facilities, scientific and technical assistance of the Australian Microscopy and Microanalysis Research Facility at the Centre for Microscopy, Characterisation & Analysis, and the University of Western Australia, a facility funded by The University, State and Commonwealth Governments. This work was supported by the ARC Discovery grant.
LITERATURE CITED
- Allen GJ, Kuchitsu K, Chu SP, Murata Y, Schroeder JI. Arabidopsis abi1-1 and abi2-1 phosphatase mutations reduce abscisic acid-induced cytoplasmic calcium rises in guard cells. The Plant Cell. 1999;11:1785–1798. doi: 10.1105/tpc.11.9.1785. [DOI] [PMC free article] [PubMed] [Google Scholar]
- Babourina O, Voltchanskii K, Newman I, Rengel Z. Ca2+ effects on K+ fluxes in Arabidopsis seedlings exposed to Al3+ Soil Science and Plant Nutrition. 2005;51:733–736. [Google Scholar]
- Becker W, Bergmann A, Hink MA, Konig K, Benndorf K, Biskup C. Fluorescence lifetime imaging by time-correlated single-photon counting. Microscopy Research and Technique. 2004;63:58–66. doi: 10.1002/jemt.10421. [DOI] [PubMed] [Google Scholar]
- Clarkson DT. The effect of aluminum and some other trivalent metal cations on cell division in the root apices of Allium cepa. Annals of Botany. 1965;29:310–315. [Google Scholar]
- Day RN. Imaging protein behavior inside the living cell. Molecular and Cellular Endocrinology. 2005;230:1–6. doi: 10.1016/j.mce.2004.10.011. [DOI] [PubMed] [Google Scholar]
- Domaille DW, Que EL, Chang CJ. Synthetic fluorescent sensors for studying the cell biology of metals. Nature Chemical Biology. 2008;4:168–175. doi: 10.1038/nchembio.69. [DOI] [PubMed] [Google Scholar]
- Iikura H, Tanoi K, Nakanishi TM. Al behavior in tobacco cells by NAA and staining method. Journal of Radioanalytical and Nuclear Chemistry. 2001;249:499–502. [Google Scholar]
- Illes P, Schlicht, Pavlovkin J, Lichtscheidl I, Baluska F, Ovecka M. Aluminium toxicity in plants: internalization of aluminium into cells of the transition zone in Arabidopsis apices related to changes in plasma membrane potential, endosomal behaviour, and nitric oxide production. Journal of Experimental Botany. 2006;57:4201–4213. doi: 10.1093/jxb/erl197. [DOI] [PubMed] [Google Scholar]
- Kataoka T, Mori M, Nakanishi TM, Matsumoto S, Uchiumi A. Highly sensitive analytical method for aluminium movement in soybean root through lumogallion staining. Journal of Plant Research. 1997;110:305–309. [Google Scholar]
- Katou K, Taura T, Furumoto M. A model for water transport in the stele of plant root. Protoplasma. 1987;140:123–132. [Google Scholar]
- Kelbauskas L, Dietel W. Internalization of aggregated photosensitizers by tumor cells: subcellular time-resolved fluorescence spectroscopy on derivatives of pyropheophorbide-a ethers and chlorin e6 under femtosecond one- and two-photon excitation. Photochemistry and Photobiology. 2002;76:686–694. doi: 10.1562/0031-8655(2002)076<0686:ioapbt>2.0.co;2. [DOI] [PubMed] [Google Scholar]
- Knemeyer JP, Marme N, Sauer M. Probes for detection of specific DNA sequences at the single-molecule level. Analytical Chemistry. 2000;72:3717–3724. doi: 10.1021/ac000024o. [DOI] [PubMed] [Google Scholar]
- Kolek J, Kozinka V. Physiology of the plant root system. Berlin: Springer; 1992. [Google Scholar]
- Konig K, Riemann I. High-resolution multiphoton tomography of human skin with subcellular spatial resolution and picosecond time resolution. Journal of Biomedical Optics. 2003;8:432–439. doi: 10.1117/1.1577349. [DOI] [PubMed] [Google Scholar]
- Lakowicz J. Princinples of fluorescence spectroscopy. New York, NY: Plenum Press; 1999. [Google Scholar]
- Lakowicz JR, Szmacinski H. Fluorescence lifetime-based sensing of pH, Ca 2+, K+ and glucose. Sensors and Actuators B: Chemical. 1993;11:133–143. doi: 10.1016/0925-4005(95)01658-9. [DOI] [PMC free article] [PubMed] [Google Scholar]
- Lakowicz JR, Szmacinski H, Nowaczyk K, Berndt KW, Johnson M. Fluorescence lifetime imaging. Analytical Biochemistry. 1992;202:316–330. doi: 10.1016/0003-2697(92)90112-k. [DOI] [PMC free article] [PubMed] [Google Scholar]
- Llugany M, Charlotte Poschenrieder C, Barceló J. Monitoring of aluminium-induced inhibition of root elongation in four maize cultivars differing in tolerance to aluminium and proton toxicity. Physiologia Plantarum. 1995;93:265–271. [Google Scholar]
- Moyer-Henry K, Silva I, Macfall J, et al. Accumulation and localization of aluminium in root tips of loblolly pine seedlings and the associated ectomycorrhiza Pisolithus tinctorius. Plant Cell & Environment. 2005;28:111–120. [Google Scholar]
- Nakabayashi T, Wang HP, Tsujimoto K, Miyauchi S, Kamo N, Ohta N. A correlation between pH and fluorescence lifetime of 2′,7′-bis(2-carboxyethyl)-5(6)-carboxyfluorescein (BCECF) in vivo and in vitro. Chemistry Letters. 2007;36:206–207. [Google Scholar]
- Niesner R, Peker B, Schlüsche P, et al. 3D-resolved investigation of the pH gradient in artificial skin constructs by means of fluorescence lifetime imaging. Pharmaceutical Research. 2005;22:1079–1087. doi: 10.1007/s11095-005-5304-6. [DOI] [PubMed] [Google Scholar]
- Ryan P, DiTomaso JM, Kochian LV. Aluminum toxicity in roots: an investigation of spatial sensitivity and the role of the root cap. Journal of Experimental Botany. 1993;44:437–446. [Google Scholar]
- Silva IR, Smyth TJ, Moxley DF, Carter TE, Allen NS, Rufty TW. Aluminum accumulation at nuclei of cells in the root tip: fluorescence detection using lumogallion and confocal laser scanning microscopy. Plant Physiology. 2000;123:543–552. doi: 10.1104/pp.123.2.543. [DOI] [PMC free article] [PubMed] [Google Scholar]
- Sivaguru M, Horst WJ. The distal part of the transition zone is the most aluminum-sensitive apical root zone of maize. Plant Physiology. 1998;116:155–163. [Google Scholar]
- Sivaguru M, Baluska F, Volkmann D, Felle HH, Horst WJ. Impacts of aluminum on the cytoskeleton of the maize root apex: short-term effects on the distal part of the transition zone. Plant Physiology. 1999;119:1073–1082. doi: 10.1104/pp.119.3.1073. [DOI] [PMC free article] [PubMed] [Google Scholar]
- Sutheimer SH, Cabaniss SE. Aqueous Al(III) speciation by high-performance cation-exchange chromatography with fluorescence detection of the aluminum-lumogallion complex. Analytical Chemistry. 1995;67:2342–2349. [Google Scholar]
- Taylor GJ, McDonald-Stephens JL, Hunter DB, et al. Direct measurement of aluminum uptake and distribution in single cells of Chara corallina. Plant Physiology. 2000;123:987–996. doi: 10.1104/pp.123.3.987. [DOI] [PMC free article] [PubMed] [Google Scholar]
- Wallace SU, Anderson IC. Aluminum toxicity and DNA synthesis in wheat roots. Agronomy Journal. 1984;76:5–8. [Google Scholar]
- Zhang WH, Rengel Z, Kuo J. Determination of intracellular Ca2+ in cells of intact wheat roots: loading of acetoxymethyl ester of fluo-3 under low temperature. The Plant Journal. 1998;15:147–151. [Google Scholar]


