Abstract
In vivo measurements of the viscoelastic properties of breast tissue are described. Ultrasonic echo frames were recorded from volunteers at 5 fps while applying a uniaxial compressive force (1–20 N) within a 1 s ramp time and holding the force constant for up to 200 s. A time series of strain images was formed from the echo data, spatially averaged viscous creep curves were computed, and viscoelastic strain parameters were estimated by fitting creep curves to a second-order Voigt model. The useful strain bandwidth from this quasi-static ramp stimulus was 10−2 ≤ ω ≤ 100 rad/s (0.0016–0.16 Hz). The stress-strain curves for normal glandular tissues are linear when the surface force applied is between 2 and 5 N. In this range, the creep response was characteristic of biphasic viscoelastic polymers, settling to a constant strain (arrheodictic) after 100 s. The average model-based retardance time constants for the viscoelastic response were 3.2±0.8 and 42.0±28 s. Also, the viscoelastic strain amplitude was approximately equal to that of the elastic strain. Above 5 N of applied force, however, the response of glandular tissue became increasingly nonlinear and rheodictic, i.e., tissue creep never reached a plateau. Contrasting in vivo breast measurements with those in gelatin hydrogels, preliminary ideas regarding the mechanisms for viscoelastic contrast are emerging.
Keywords: biomechanics, breast cancer, creep, rheological models, stroma
I. INTRODUCTION
Inflammatory processes associated with breast diseases1–3 promote characteristic reactions that stiffen tissues; examples include edema, desmoplasia, and other fibrotic responses. The early reactive conditions generate diagnostic contrast for manual palpation and elasticity imaging4 that complement other medical imaging modalities. A long-term goal of our work is to understand how disease processes modify viscoelastic properties of breast tissues and produce elasticity image contrast with specific diagnostic information. This paper summarizes an early step toward our goal. It shows how ultrasonic methods can be used to measure spatially averaged viscoelastic parameters from normal glandular breast tissues.
Molecular biology provides important clues on the nature of elasticity image contrast, particularly as it relates to cancer. In glandular regions of the adult breast, epithelial cells line the mammary lobules and associated ducts. These cells are the primary sites for neoplastic growth. However, the mechanical properties of breast tissue are determined by its connective tissues, or stroma. Stroma is the non-epithelial-cell component of the breast. Its main components in glandular regions are the collagenous extracellular matrix (ECM), vasculature, and fibroblast cells. Primary components in fatty regions are lipid and adipocytes. Glandular stroma normally builds up and breaks down during the menstrual cycle as instructed by molecular signaling between fibroblasts and epithelial cells.5 However, during the formation of ductal and lobular carcinomas, fibroblast cells are transformed into myofibroblasts that produce growth factors and large quantities of ECM proteins to prepare stroma for angiogenesis and other changes required to nurture tumor growth.6 The increased collagen density, the reduction of local lymphatic flow, and the constriction of the actin and myosin in myofibroblasts all contribute toward a stiffening of the region surrounding many tumors—desmoplasia. Unfortunately, contrast from malignant growths must compete with the normal variation in stiffness between glandular and fatty stroma as well as cyclic variations within glandular regions7 and bening fibrocystic changes.
To increase specificity, the diagnostic feature space can be expanded to include viscoelastic strain parameters. Depending on the bandwidth of the mechanical stimulus, viscoelas tic properties may be imaged by applying quasi-static8,9 or harmonic10,11 shear wave excitations, or with ultrasound-based radiation force stimuli.12,13 We apply quasi-static force stimulus to breast tissues to image time-varying strain at the low-frequency band (<1 Hz) of the mechanical spectrum. This approach is aimed at studying the biphasic (fluid-solid) viscoelastic response.
The ECM in glandular breast stroma is a random, isotropic network of collagen fibers onto which a thick web of hydrophilic proteoglycan molecules attach. Proteoglycan molecules contain sulfate groups that are dense with negative electric charges. Surface charges act to align surrounding polar water molecules, thus structuring the fluid into a viscous polysacharide gel that embeds the ECM surrounding normal parenchymal cells. Malignant cells alter the ECM structure through poorly understood mechanisms by reducing the associated proteoglycan molecule density several fold.14 Thus malignancies can be stiffer than the background, because of excess collagen and edema, but the viscosity of the extracellular fluid does not increase as would be expected for an increase in normal ECM proteins. By compressing the tissue and observing the viscous creep of the stroma, we hypothesize that malignant and benign tumors can be differentiated because of differences in the ECM structures. Specifically fibrous benign lesions will creep more slowly than malignant lesions. Ultrasonic pulse-echo signals can track the very small displacements (<10 μm) of the creeping tissues so that viscoelastic parameters can be extracted and displayed with near-B-mode image spatial resolution (~1 mm).15
We are attempting to link ultrasonic strain image measurements with the molecular-scale view of stromal structure by adopting the standard equations of polymer mechanics. In vivo measurements from three volunteers and one patient describe the range of tissue linearity and provide data to measure viscoelastic parameters.
II. METHODS
II.A. Patient scanning and strain imaging
Three female volunteers with no history of breast disease between the ages of 23 and 28 and one 53 year old female patient with a single fibroadenoma were scanned. A Siemens Sonoline Antares ultrasound scanner was used with a VF10-5 linear array transducer operated at 8 MHz. The Antares was configured with an Ultrasound Research Interface (URI) capable of recording radio-frequency (RF) echo data corresponding to the image data.
Volunteer subjects were positioned to lie on either side. The bicep of the lower arm supported the adjacent breast from below while data were acquired from above by contact scanning with medio-lateral positioning. Subjects were instructed to breathe with shallow diaphragmatic movements to minimize breast motion during data acquisition that lasted several minutes in some cases. The frame rate of the scanner was controlled by an ECG trigger as described below. In contrast, the patient was positioned supine and the breast was scanned AP with the chest wall as compression support. The frame rate was 13 fps.
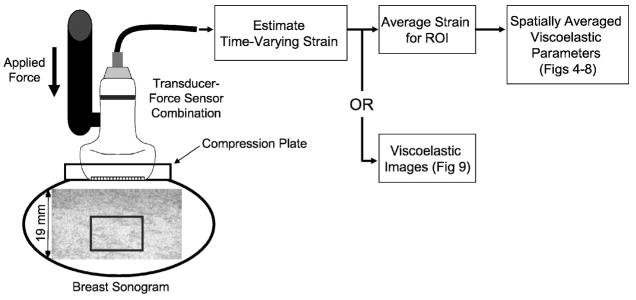
One small compressive force was applied using the transducer assembly (Fig. 1). The contact surface of the probe was widened to 4×8 cm2 with the addition of a flush-mounted Lucite plate attachment. Force was applied manually in all cases, either directly without feedback or through a handheld force sensor (ATI Industrial Automation, Apex, NC) mounted to the transducer to help the sonographer maintain a constant force in Newtons (N). Force was applied along the axis of the sound beam.
Fig. 1.
Diagram of data acquisition for volunteer studies. Echo data from the glandular region (box) are analyzed in this example.
We began recording RF echo frames just prior to the onset of compression. The entire force was applied within 1 s and held constant while RF frames were recorded up to 200 s for a fixed region of interest. Echoes were recorded from a 10 × 20 mm2 region centered at a depth of 30 mm. Subregions in primarily glandular tissues were identified sonographically for analysis (Fig. 1). For all RF frames recorded during force application, strain was estimated using multicompression techniques.16 That is, the reference frame for strain imaging was sequenced in time such that temporally adjacent echo frames were compared and the strain from each pair was accumulated over measurement time. Strain images were computed using a regularized optical flow algorithm.17 Time-varying, viscoelastic parameters were estimated from the time sequence of strain images as detailed in Ref. 15 and summarized below.
II.B. Constitutive equation
A compressive stress was applied to the breast surface along one spatial axis while strain was measured ultrasonically along the same axis. The constitutive equation describing how the applied time-varying stress σ(t) combines with material properties of the tissue, via the compressive compliance D(t), to produce the spatially averaged time-varying strain ε(t) is well known.18 For viscoelastic media and our experimental geometry, the constitutive equation is
| (1) |
where we assume the breast tissue is at rest when t<0 and responds as a linear time-invariant medium when t≥0. D(t) has the SI units of [Pa−1]and is related to the first two Lamé constants through bulk and shear compliance terms. (Modulus [Pa] is substituted for compliance when strain is applied and the stress response is measured. Modulus and compliance are inversely related. Similarly, the compressive modulus is a function of the bulk and shear moduli.)
Taking the one-sided Laplace transform of Eq. (1), i.e., ε̃(s) =ℒ ε (t), we find the ratio of strain to stress in the Laplace domain to be
| (2) |
D̃*(ω) = D̃*(s)|s=iω is the complex compressional compliance rate expressed as a function of radial frequency ω; the real part D̃′(ω)is the storage compliance and the imaginary part D̃″(ω)is the loss compliance. D′ describes the energy density stored per force cycle at ω while D″ is the energy density dissipated per cycle. In the time domain, we have
| (3) |
where is the instantaneous compliance found immediately after loading, and δ is the Dirac delta.
II.C. Step stress
We apply a small uniaxial force (<20 N) to the breast tissue surface suddenly at t=0. Ideally the associated stress tensor is σ(t) = σau(t), where the applied stress [Pa] is the constant σa and the unit step function is u(t) =1 for t≥0 and 0 for t<0. Equation (1) becomes
| (4) |
As shown previously,19 the generalized discrete Voigt model
| (5) |
is a useful representation of the complex compliance rate for hydropolymers. The first term on the RHS is the instantaneous (elastic) strain response. The second term is the sum of viscoelastic responses caused by bound fluids surrounding the polymer matrix and the matrix itself.20 Dℓ and τℓ are characteristic amplitudes and time constants describing the duration of strain delays (creep) from each of L viscoelastic mechanisms. The last term describes viscous flow of free water from gels placed under a load; it is the rheodictic18 response of viscous fluid flow. η0 is the steady-state compressive-flow viscosity coefficient. Combining Eqs. (2)–(5), the Voigt model predicts that the strain response to an applied uniaxial step stress is
| (6) |
where ε0 = D0σa is the instantaneous elastic strain and the sum of εℓ =Dℓ σa over L terms is the net viscoelastic strain.
II.D. Ramp stress
Experimentally, it is more accurate to say we apply a small ramp force beginning at t=0 over the time interval t0 and hold it constant. The corresponding time-varying stress is
σ(t) = σar(t;t0), where the ramp function is
In the Laplace domain, the stress expression becomes σ̃(s) =σa(1−exp (−t0s))/(s2t0). Consequently, for a ramp stress, the predicted strain response in both domains is
| (7) |
To simplify Eq. (7), we neglected the rheodictic term. Equation (7) simplifies to Eq. (6) as t0 → 0.
An exact ramp stress is difficult to achieve experimentally. Realistic approximations must be continuously differentiable. Thus the control system of the force applicator either rounds off the ramp at the transition times (overdamped) or there are oscillations (underdamped). The most accurate loss compliance estimates are obtained by measuring σ(t) for each experiment and computing D̃″(ω) using Eq. (2) where s=iω (see the Appendix).
II.E. Interpretation and example
The viscoelastic response described by the Voigt model, ΣℓDℓ/(1+sτℓ), has L real eigenvalues21 at the poles of the equation, s=−1/τℓ. The rheodictic term, (sη0)−1, adds another pole at the origin of the s plane that destabilizes the model system. Consequently, when this term is significant, it is removed from the data before estimating viscoelastic parameters.19 The location of the L zeroes for the equation are less obvious, e.g., the zeros of a second-order (L=2) model are at −infin; and −(D1 + D2)/(D1τ2 + D2τ1). Since poles and zeros define material properties of the medium in terms of the Voigt model, parameter estimation for viscoelastic imaging may be thought of as a search for poles and zeros of Eq. (5).
Parameters of the discrete Voigt model, Dℓ and τℓ, are related to thermodynamic processes that regulate the mechanical dynamics of weakly cross-liked polymer networks including gelatin gels and soft connective tissues.20 Typically very high-dimensional discrete (L≫1) or continuous models are required to fit the experimental data exactly.18 However, our goal is to seek diagnostic parameters for imaging. So we adopted a second-order discrete Voigt model to approximate the viscoelastic response of breast tissues and some hydrogels.19 The second-order model reflects the biphasic nature of stromal constituents—an immiscible mixture of solid matrix and incompressible interstitial fluids22—without attempting to model the details. We refer to the retardation time constants τℓ for the two largest eigenvalues as T1 and T2, where T1 is the smaller of the two values. Model-based least-squares and singular-value-decomposition techniques were proposed to estimate pole parameters of a second-order discrete Voigt model.15 We hypothesize that T1 describes strain delayed by movement of the collagen polymer in surrounding fluids and T2 describes the viscoelastic response of the collagen matrix itself.
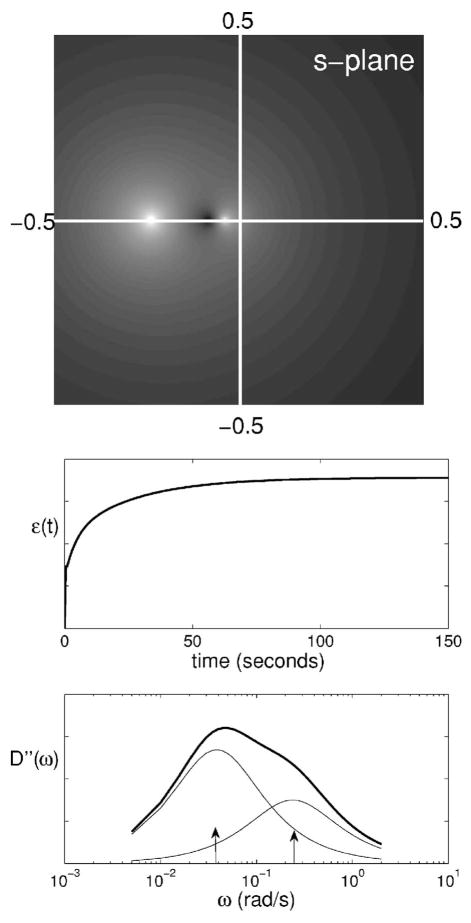
Model parameters may be estimated from the creep curve or its loss compliance spectrum. To illustrate, assume the deformation of a hydropolymer subjected to a compressive ramp load (t0 =1 s) of amplitude σa =1.0 Pa is accurately modeled by a second-order Voigt model. From Eq. (7), we find an initial elastic response followed by a bi-exponential viscoelastic creep response [Fig. 2 (top right)]. The model parameters input to this example are (D1,T1) =0.015 Pa−1 s−1, 4.2 s and (D2,T2) =0.027 Pa−1 s−1, 26 s. D0is set to 0.04 Pa−1 s−1 and, for convenience, η0 → ∞. There are two poles at s=−0.24, −0.039 rad/s and two zeros at s =−∞, −0.083 rad/s. Poles and one zero of |D̃*(s)| are imaged in the complex s-plane for these parameters in Fig. 2 (left). Focusing attention on the frequency spectrum (i.e., those values on the vertical line where s=iω), we plot the loss compliance spectrum D̃″(ω) in Fig. 2 (bottom right) along with the two component spectra from each pole. (The storage and loss compliances (moduli) are related via Kramers-Kronig relations.23,24) D̃″(ω)displays spectral peaks on the radial frequency axis corresponding to characteristic time constants, i.e., at and .
Fig. 2.
(left) Illustration of |D̃*(s)| in the complex Laplace plane for the example in Sec. II E. The horizontal line is the real axis and the vertical line (radial frequency) is the imaginary axis, both in rad/s. Poles appear as white spots and the zero as a dark spot, all on the real axis. (right) The corresponding creep curve, ε(t) from Eq. (7), is shown with its loss compliance spectrum D″(ω) (thick solid line). The thinner lines are component spectra from the two poles. Arrows indicate input values of and for the example.
Loss compliance spectra are computed from creep curves. The appropriate equation varies depending on whether a step or ramp stress function is applied; the respective deconvolution equations are
| (8) |
where ℐ{·}is the imaginary part of the quantity. For details on spectral estimation, see the Appendix.
We investigated the spectral estimate when a ramp stress is applied but a step stress is assumed during data processing, i.e., what is the effect of ignoring a short duration ramp stress? We answered this question by computing the ratio
| (9) |
The result is plotted in Fig. 3. The numerator incorrectly estimates D̃″(ω) by reducing a strain measured using a ramp stress stimulus, ε̃ramp(ω), with factors for a step stress stimulus. The denominator correctly computes the loss compliance ε̃ramp(ω). At low mechanical frequencies the ratio is near one, showing minimal effect of the ramp on spectral estimates. At higher frequencies, however, a ramp stress acts as a low pass filter. Ignoring the ramp reduces the measurement bandwidth and biases spectral estimates. However, very short duration ramps (high stress rates) are not a realistic solution. As t0 → 0, the high acceleration required of the stress applicator control system causes temporal oscillations in the applied force that reduces the bandwidth and introduces additional ringing artifacts in spectra. Our compromise was to apply a 1 s ramp in the tissue measurements reported below. Consequently, the measurement bandwidth is limited to ω <1 rad/s.
Fig. 3.
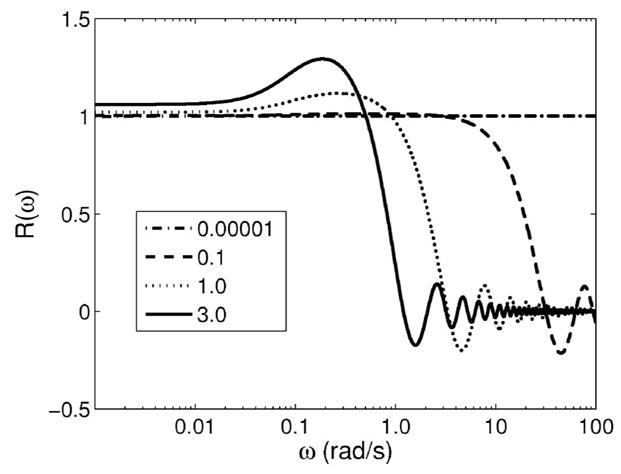
Equation (9) is plotted for four ramp durations t0 in seconds. Deviations from one indicate estimation bias.
III. RESULTS
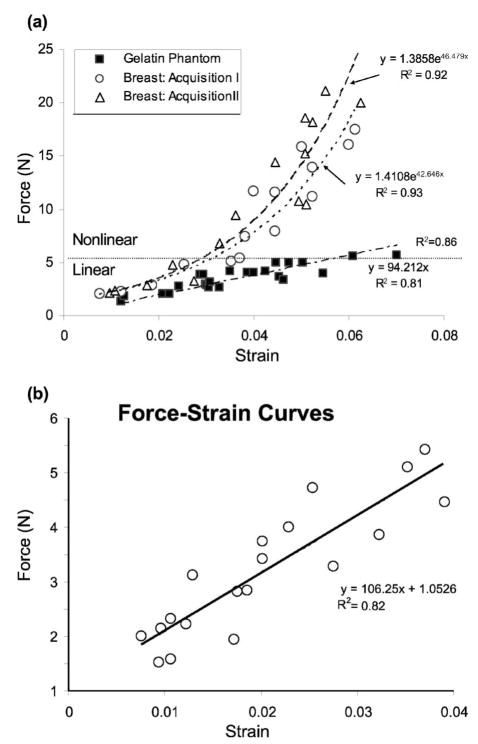
Elasticity images of normal breast tissue provide contrast between fat and glandular regions, e.g., Fig. 4. To report on average properties of these tissue types and to minimize noise, we averaged the strain in the image sequence over regions of each type as seen on the B-mode image to generate the creep curves reported below in Figs. 5–8.
Fig. 4.
(a) Force-strain curves for two in vivo breast tissue acquisitions from the glandular region of a normal volunteer. R2 values are correlation coefficients for exponential (breast) or linear (gelatin) least-squares fits. (b) Expanded view of the approximately linear force range for glandular breast tissue.
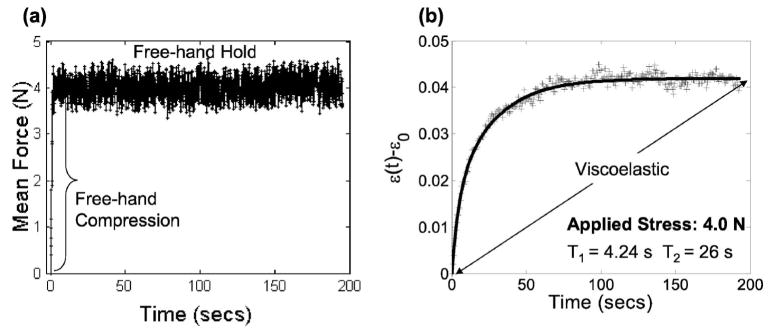
Fig. 5.
(a) A typical force-time curve for in vivo breast compression measurements on volunteer subjects. A 1 s ramp force is applied by hand and held for up to 200 s. (b) The corresponding biexponential creep response for one acquisition, ε (t) − ε0, is shown under arrheodictic conditions. Points (+) are the average strain values measured in the glandular region of volunteer strain images. The solid curve is the least squares fit of measured values to a second-order Voigt model. Retardance time constants are indicated.
Fig. 8.
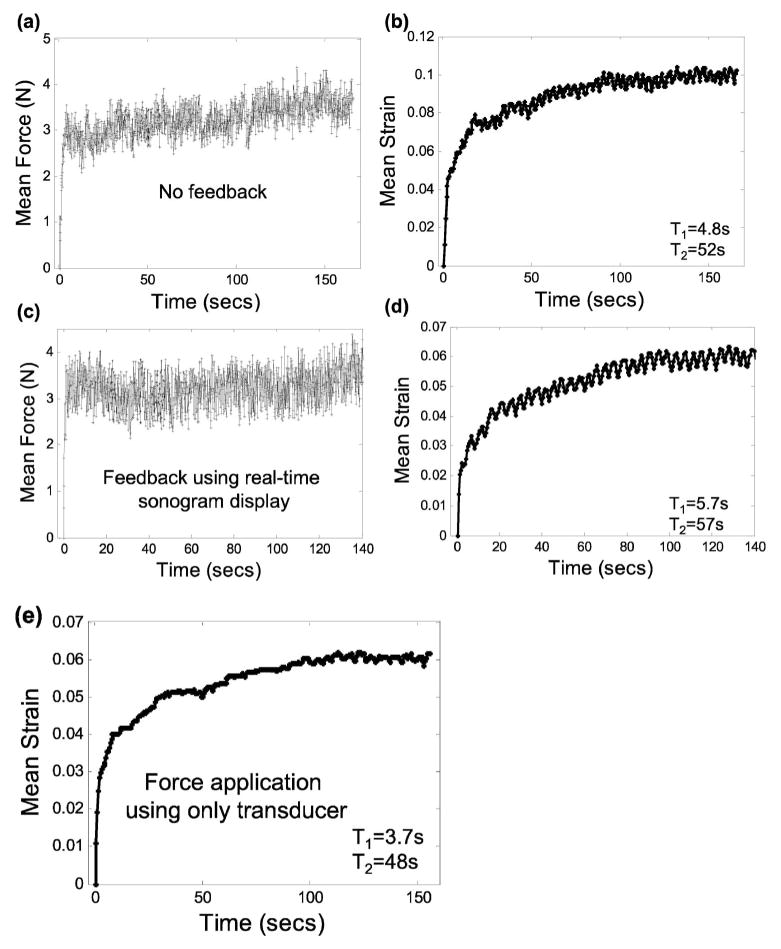
Freehand applied force and ultrasonic creep measurements from a volunteer breast with the transducer-sensor combination. Parts (a, b) display results for the experiment described in Fig. 5 but without force feedback. Parts (c, d) display results using real-time sonographic feedback only. Part (e) displays results without feedback and with the force sensor removed.
III.A. Linearity
The analysis methods above are based on a linear constitutive equation. However, most biological media behave nonlinearly under large loads. Our first study was to determine the range of applied forces over which breast tissues respond linearly.
Forces between 1 and 20 N were manually applied to the skin surface of the breast at a strain rate of approximately 0.03 s−1 while RF frames were recorded. For comparison, mammographic techniques commonly employ compressive forces between 100 and 200 N.25 The ultrasonic frame rate was set externally to 5 fps using a waveform generator and the ECG trigger function of the scanner. The sampling rate of the force sensor was 10 samples/second. For these measurements, 20 cycles were acquired and the information from the 8th to 20th cycle were used for calculation purposes. The preload was set to approximately 1 N. From the RF frames recorded, a sequence of breast strain images was formed offline and the average strain over a 1×2 cm2 glandular region was computed to generate the in vivo force-strain curves of Fig. 4. To compare breast data with our previous work, a similar force-strain experiment was performed on a 5 cm square homogeneous graphite-in-gelatin-gel block; the results are included in Fig. 4(a). Details of the gelatin gel construction can be found elsewhere.19
Figure 4 shows a clearly nonlinear response of normal in vivo breast glandular tissue over the 20 N applied force range. In contrast, gelatin gels are approximately linear in that range. The two breast data curves are not significantly different from each other, and each is well described by an exponential fit. Exponential force-strain behavior was seen by others for breast tissue.26 In the force range of 2 and 5 N, we find an approximately linear strain response between 0.01 and 0.04 [Fig. 4(b)], which is within the acceptable strain range for quasi-static ultrasonic elasticity imaging techniques.
III.B. Creep measurements
Having established the linear range, we proceeded to measure creep curves for normal breast glandular tissue in vivo. A ramp force was applied within 1 s after initiation to the skin surface of the volunteers and held constant while echo frames for a strain image sequence were synchronously recorded. In this experiment, the sonographer used the real-time force display as feedback to maintain a 4 N load while recording echo frames [Fig. 5(a)]. Over the 200 s acquisition period, the mean and standard deviation of the applied force were measured to be 4.0±0.24 N; the magnitude of the average bias, as estimated from a ten sample moving-average window, was 0.05 N. The initial elastic strain ε0 has been removed from the creep curve in Fig. 5(b) to isolate the viscoelastic response.
Fitting15 the viscoelastic creep data illustrated in Fig. 5(b) to a second-order Voigt model, we find T1 =4.2 s and T2 =26 s. Because the strain curve eventually plateaus, we say the tissue is arrheodictic18 under these experimental conditions. Such findings suggest there is minimal flow of fluids at t>100 s. Repeated measurements on volunteers showed that breast tissue is arrheodictic for applied forces less that 5 N. Furthermore, we found that the net viscoelastic strain, ε1 +ε2 =0.042= ε(∞) − ε0 from Eq. (6), was approximately equal to the instantaneous elastic strain, ε0 =0.040, showing that breast tissue generates a relatively large viscoelastic response. Creep measurements obtained from normal volunteers showed similar characteristics with the average values given in Table I. Time constant measurements with a 3 N applied force yielded values in the range of Table I. One to two minutes of strain data acquisition is sufficient to sample the response bandwidth of breast tissue for a 1 s ramp fit to a second-order Voigt model.
Table I.
Viscoelastic parameters of normal glandular breast tissue. Values are an average for three volunteers. Errors listed are one standard deviation.
| T1 (s) | T2 (s) | (ε1 + ε2)/ε0 |
|---|---|---|
| 3.2±0.8 | 42±28 | 1.08±0.16 |
The loss compliance spectrum for measurements shown in Fig. 5 is plotted in Fig. 2 (lower right). Assuming the magnitude of the applied stress σa =1 Pa, the values used in the example of Sec. II E are taken directly from volunteer data. D̃″(ω) in Fig. 2 was computed analytically using the second-order Voigt model parameters obtain from Fig. 5.
Coefficients of variation [COV(x)=std dev(x)/mean(x)] were computed from the data above. For the retardance time constants estimated from volunteers, we found COV(T1) =0.25 and COV(T2) =0.67. Applying the variance analysis described previously,15 where stress variance is the only source of measurement variability, we predict the coefficients of variation for T1 and T2 will be 0.23 and 0.11, respectively. Consequently, scanning technique and patient variabilities seem to have greater influence on T2 errors than T1 errors.
We can now compare results in breast glandular tissue with those from 5.5% gelatin gels measured previously.19 Gelatin is often used in the construction of tissuelike imaging phantoms.27 Gelatin is arrheodict only at very small applied stresses, viz., σa <30 Pa (~0.04 N for our compression plate). For comparable stresses and experimental geometry, T1 =5–10 s and T2 =209 s for gelatin gels. Time constants for these gels are an order of magnitude longer that those of breast tissue. Also, since (ε1 + ε2)/(ε0) < 0.1 in gelatin gels and ~1 in breast, the viscoelastic response of breast tissue is considerably larger than for gelatin. Although gel construction can be modified to more closely match tissue properties, the signal-to-noise ratio for creep measurements in breast tissues is significantly larger than gelatin phantoms constructed in our lab.
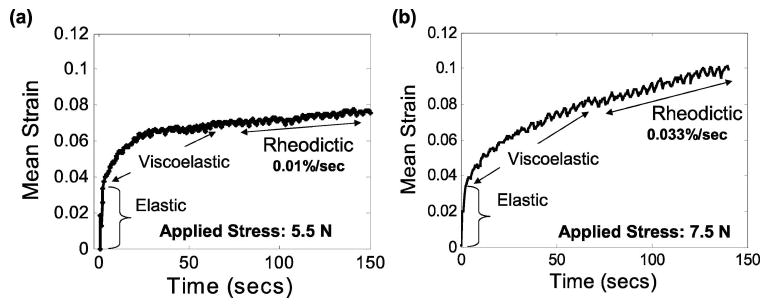
Figure 6 shows examples of creep curves from glandular breast tissue when the applied force is in the nonlinear range, i.e., >5 N. The 5 Hz oscillation superimposed on the curves is a breathing artifact. The higher loads generate an additional linear increase in strain observed at t>100 s that is consistent with a rheodictic response. At the 5.5 and 7.5 N loads employed, the additional strain increases at a rate of 0.01% s−1 and 0.03% s−1, respectively. Because the response of breast tissue is nonlinear in this load range, the Voigt model is invalid and viscoelastic variables cannot be estimated using these methods. Provided the applied force is <5 N, breast tissue responses are linear and arrheodictic and therefore only the elastic and viscoelastic terms in the Voigt model of Eq. (5) must be considered. Conversely, our gelatin gels are linear and rheodictic for all measurable loads up to at least 10 N.19 Although the analysis is valid over a broader range for gelatin than breast tissue, the last term in Eq. (5) must first be estimated and eliminated from the creep curve of gelatin before viscoelastic parameters can be accurately estimated.
Fig. 6.
Measured creep response in glandular breast tissue, in vivo, for applied forces of (a) 5.5 N and (b) 7.5 N. Responses in this high force range are nonlinear and rheodictic.
III.C. Creep relaxation
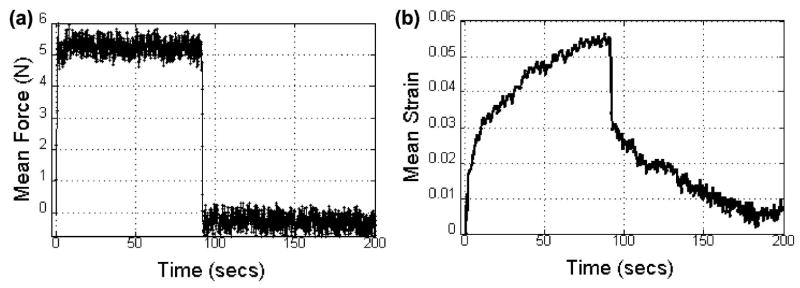
We performed a classic creep-recovery experiment20 on one volunteer. The tissue was loaded with a 5.2 N force for about 90 s [Fig. 7(a)] to induce a weakly rheodictic response in glandular tissue [Fig. 7(b)]. The load was then released. Strain images were obtained at 5 fps during the 200 s experiment to generate a creep-recovery curve. Figure 7(b) shows the initial elastic response, the viscoelastic response up to 90 s, the elastic recovery between 90 and 92 s, and the viscoelastic recovery up to 200 s. Notice that the strain does not return to zero at the end of the recovery time. Such behavior is typical of rheodictic hydropolymers where there is inelastic flow of fluids. Lowering the applied force <4 N (not shown), the mean strain recovers to zero at T ≃ 200 s, which is characteristic of arrheodictic solids.
Fig. 7.
(a) The time-varying applied force is shown for the creep-relaxation experiment in normal glandular breast tissue in vivo. (b) The corresponding creep-relaxation strain response.
III.D. Stress stimulus variations
We further explored the effects of freehand force variations on viscoelastic parameter estimation during ultrasonic creep measurements. In Fig. 5, the sonographer used the real-time applied-force readout as feedback to maintain a constant force up to 200 s. In Fig. 8(a), the sonographer attempted to apply a constant force at 4 N with no feedback; the resulting creep curve and fit parameters are shown in Fig. 8(b). In Figs. 8(c) and 8(d), the sonographer was instructed to apply a constant force by minimizing changes in the real-time B-mode speckle patterns. Finally, in Fig. 8(e), the force sensor was removed from the transducer and force was manually applied (but not measured) with no visual feedback to the sonographer. Without feedback the principal effect is a slow drift in the applied force. There was no measurable difference in the sonographer’s ability to manually apply a constant force using speckle feedback and no feedback. The influence of force drift on parameter estimation is statistically significant. Nevertheless the affect on image contrast is small since force is applied to the entire medium.
III.E. Acquisition time
Volunteers were very cooperative in remaining still for more than 3 min during echo acquisition. Patient acquisitions are more often limited to a 10–20 s breath hold. We investigated the influence of acquisition time on viscoelastic parameter estimates and image contrast two ways. The results are summarized in Fig. 9.
Fig. 9.
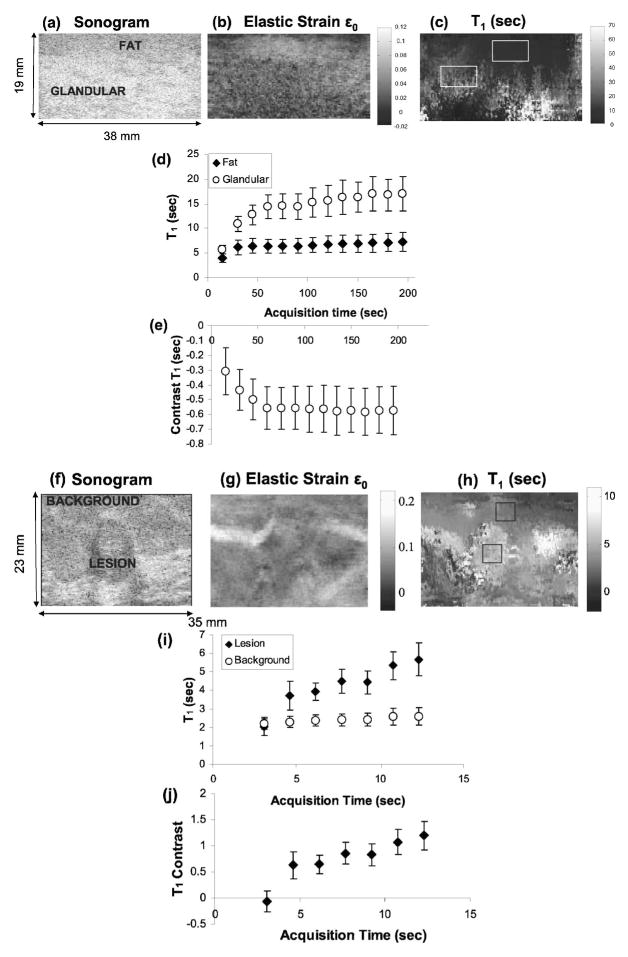
(a) Sonographic, (b) elastic strain ε0, and (c) T1 images of normal breast tissue are shown. (d) Variation of retardance time constants (T1) in fat and glandular regions with acquisition time. (e) Variation of contrast between glandular and fat regions with acquisition time. (f) Sonographic, (g) elastic strain ε0, and (h) T1 images of a patient with a fibroadenoma. (i) Variation of T1 with acquisition time for lesion and background areas. (j) Variation of lesion contrast with acquisition time.
First, we compared creep curves measured from fatty and glandular tissues in volunteers. Figure 9(a) shows a sonogram of normal breast tissue with a proximal hypoechoic layer of mostly fatty tissues and a distal glandular layer. Figure 9(c) is the corresponding T1 retardance time image. Glandular tissue regions creep more slowly (larger values of T1) than fatty regions [Fig. 9(d)], and full contrast is obtained after 60 s of acquisition [Fig. 9(e)]. These regions are also associated with lower strain values [Fig. 9(b)]. Contrast is defined as the difference in T1 values divided by the value for glandular tissue: (T1g − T1f)/T1g. In gelatin gels, we found a plateau in T1 contrast after 240 s.15 Retardance times increased with gelatin concentration; similarly in breast tissues the higher collagen concentration of glandular regions increases T1 over values measured in fatty regions.
Second, we studied the effects of acquisition time on lesion contrast from one patient with biopsy-proven fibroadenomas [Figs. 9(f) and 9(g)]. Figures 9(i) and 9(j) show that lesion contrast increases with acquisition time rapidly to exceed 100% after 12 s. Fibroadenomas are benign lesions characterized by an increase in normal collagen concentration. T1 is increased, we believe, because of the higher collagen density. This also causes a subtle decrease in strain value in the strain image [Fig. 9(g)]. It seems that the acquisition time required to achieve full contrast increases with the time constant, which increases with collagen concentration. Only T1 responses were studied because the acquisition time must be greater than the time constant.
IV. SUMMARY AND CONCLUSIONS
Ultrasonic elasticity imaging is a relatively simple and safe method for imaging viscoelastic properties of breast tissues using commercially available instruments. With the aid of force feedback and proper patient positioning, handheld compressive force stimulation yields viscoelastic strain parameters at low (quasi-static) mechanical frequencies, 10−2<ω<100 rad/s. The parameter estimates are strongly influenced by the spatiotemporal distribution of applied stress. The unknown spatial variations in stress within the region of interest prevent us from reporting compliance values for breast tissues. Instead we use the ratio of viscoelastic strain to elastic strain, (ε1 + ε2)/ε0, which we find to be near 1 for normal glandular tissue. When possible, to minimize artifacts, the time-varying stress should be deconvolved from the creep curve before parameter estimation. Since the bandwidth of the stress stimulus determines the bandwidth of the strain response, other methods for imaging viscoelastic strain11,28 that probe tissues at higher frequencies may provide vastly different values for the same parameters.
For a ramp stimulus applied to breast tissue, the force range generating a linear strain response is small, between 2 and 5 N, wherein linear viscoelastic modeling techniques apply. In this range, the creep response of glandular breast tissue is characteristic of a weakly cross-linked amorphous polymer solid.20 A second-order arrheodictic Voigt model—Eq. (5) where L=2 and the last term is set to zero—provides a reliable representation of the linear creep response. Above 5 N of applied force, normal breast tissue responds increasingly nonlinearly with the behavior of a rheodictic hydropolymer, i.e., the mechanical response is somewhere between that of a solid and a liquid. The viscoelastic strain amplitude, ε1 + ε2, is approximately equal to the elastic response, ε0. Twenty to 60 s of strain image data recorded at 5 fps displays between 50% and 100% of the available contrast among normal tissues. However, this study should be repeated to observe the response of pathological tissues. The required echo acquisition time seems to increase with the retardance time constants, which increase with collagen concentration.
In comparison with breast tissues, gelatin hydrogels of similar stiffness are linear and rheodictic over a larger applied force range. The deformation of a 5.5% concentration gel is more elastic than glandular breast tissues and gels creep more slowly. Differences between the two network structures could explain the different mechanical behaviors. Both polymers are primarily type I collagen, but the lack of proteoglycan and the denatured protein structure of gelatin29,30 expose more hydrophilic charged sites for structuring water molecules.31,32 Structured water increases gel viscosity at room temperature as compared with breast stroma at body temperature.
Despite differences in mechanical response and macromolecular structure, gelatin gels and breast stroma both are biphasic media that are well represented by second-order Voigt models for the purpose of elasticity imaging. The biomechanics literature on articular cartilage describes a biphasic poroviscoelastic (BPVE) model for articular cartilage that seems consistent with the creep behavior of breast tissue.33 BPVE theory identifies two retardation mechanisms: one that is flow dependent and dominated by frictional forces of fluids moving within the porous matrix, and the other is flow independent and related entirely to properties of the ECM. We previously conducted confined gelatin compression tests in which two peaks in the compliance spectrum clearly emerged.19 T1 described the delay from the fluidic response while T2 was assumed to be related to the collagen matrix. Similarly, glandular breast tissue has a clearly bimodal loss compliance spectrum, Fig. 2, which we find from the two largest eigenvalues of the creep curve. Furthermore, the higher density of normal collagen within the benign fibrotic lesion of Fig. 9(f) shows increased stiffness and larger T1 values compared to surrounding tissues. The same behavior was observed in gelatin phantoms with high concentration inclusions.15 Although BPVE theory is plausible for breast tissue, others have found reverse roles for T1 (matrix) and T2 (fluid) when studying articular cartilage.34 Further study is needed.
Acknowledgments
The authors gratefully acknowledge the loan of a force sensor by Dr. Andrej Lyshchik (Vanderbilt University). The authors also acknowledge essential contributions by Dr. Jean K. Tsou, Rebecca D. Yapp, and Carol L. Schaffer. This work was supported by the NCI under Grant No. CA082497 and the Beckman Institute at the University of Illinois.
APPENDIX
Ideal step and ramp stress stimuli generate analytical creep curves that are not absolutely summable; i.e., . The Laplace transform of ε(t) exists, but, strictly speaking, its Fourier transform does not. Consequently, Eq. (8) is not a stable estimate of the loss compliance spectrum, D̃″(ω). A more stable model generates strain with a stress function that ramps on beginning at t=0 for duration t0 and then steps off at t = te. We assume te ≫ t0. In this case, σ(t) =σa(r(t;t0) − u(t−te)), and Eq. (8) becomes
is the Fourier transform of dε/dt. Because of the derivative, this form is still unstable when strain noise is significant.
One alternative is to approximate the derivative ε̇(t) using ε′(t) = ε(∞)− ε(t).15 A quick check with Eqs. (6) via Eq. (7) shows that ε̇(t) and ε′(t) are similar except that each term in the sum of ε′(t) is missing the scale factor . Although noise is not amplified using ε′(t) in place of ε̇(t), the low frequency eigenvalues are weighted disproportionately high, which biases spectral-based parameter estimates. Consequently, models are fit to data in the time domain.
A second approach is to estimate the loss compliance spectrum using Eq. (2), viz., D̃″(ω)= −ℐ{ε̃(ω)/σ̃(ω)}. In this case, the stress and strain are both measured. If σ(t) can be estimated with minimal noise, accurate and precise loss spectra are obtained.
Contributor Information
Mallika Sridhar, Department of Biomedical Engineering, University of California, Davis, California 95616, USA..
Michael F. Insana, Department of Biomedical Engineering, University of California, Davis, California 95616, USA and Department of Bioengineering and the Beckman Institute, University of Illinois at Urbana-Champaign, Urbana, Illinois 61810.
References
- 1.Sameni M, Dosescu J, Moin K, Sloane B. Functional imaging of proteolysis: Stromal and inflammatory cells increase tumor proteolysis. Mol Imaging. 2003;2:159–175. doi: 10.1162/15353500200303136. [DOI] [PubMed] [Google Scholar]
- 2.Gauthier M, Pickering C, Miller C, Fordyce C, Chew K, Berman H, Tlsty T. p38 regulates cyclooxygenase-2 in human mammary epithelial cells and is activated in premalignant tissue. Cancer Res. 2005;65:1792–1799. doi: 10.1158/0008-5472.CAN-04-3507. [DOI] [PubMed] [Google Scholar]
- 3.Schedin P, O’Brien J, Rudolph M, Stein T, Borges V. Microenvironment of the involuting mammary gland mediates mammary cancer progression. J Mammary Gland Biol Neoplasia. 2007;12:71–82. doi: 10.1007/s10911-007-9039-3. [DOI] [PubMed] [Google Scholar]
- 4.Samani A, Zubovits J, Plewes D. Elastic moduli of normal and pathological human breast tissues: an inversion-technique-based investigation of 169 samples. Phys Med Biol. 2007;52(6):1565–1576 . doi: 10.1088/0031-9155/52/6/002. [DOI] [PubMed] [Google Scholar]
- 5.Stoeckelhuber M, Stumpf P, Hoefter E, Welsch U. Proteoglycan-collagen associations in the non-lactating human breast connective tissue during the menstrual cycle. Histochem Cell Biol. 2002;118:221–230. doi: 10.1007/s00418-002-0438-7. [DOI] [PubMed] [Google Scholar]
- 6.Elenbaas B, Weinberg R. Heterotypic signaling between epithelial tumor cells and fibroblasts in carcinoma formation. Exp Cell Res. 2001;264:169–184. doi: 10.1006/excr.2000.5133. [DOI] [PubMed] [Google Scholar]
- 7.Lorenzen J, Sinkus R, Biesterfeldt M, Adam G. Menstrual-cycle dependence of breast parenchyma elasticity: estimation with magnetic resonance elastography of breast tissue during the menstrual cycle. Invest Radiol. 2003;38:236–240. doi: 10.1097/01.RLI.0000059544.18910.BD. [DOI] [PubMed] [Google Scholar]
- 8.Ophir J, Cespedes I, Ponnekanti H, Yazdi Y, Li X. Elastography: a quantitative method for imaging the elasticity of biological tissues. Ultrason Imaging. 1991;13:111–134. doi: 10.1177/016173469101300201. [DOI] [PubMed] [Google Scholar]
- 9.O’Donnell M, Skovoroda A, Shapo B, Emelianov S. Internal displacement and strain imaging using ultrasonic speckle tracking. IEEE Trans Ultrason Ferroelectr Freq Control. 1994;42:314–325. [Google Scholar]
- 10.Lerner R, Parker K. Sonoelasticity imaging. Acoust Imaging. 1988;317–:327. [Google Scholar]
- 11.Sinkus R, Tanter M, Catheline XTS, Bercoff J, Fink M. Viscoelastic shear properties of in vivo breast lesions measured by MR elastography. Magn Reson Imaging. 2005;23:159–165. doi: 10.1016/j.mri.2004.11.060. [DOI] [PubMed] [Google Scholar]
- 12.Fatemi M, Greenleaf J. Ultrasound stimulated vibro-acoustic spectrography. Science. 1998;280:82–85. doi: 10.1126/science.280.5360.82. [DOI] [PubMed] [Google Scholar]
- 13.Sharma A, Soo M, Trahey G, Nightingale K. Acoustic radiation force impulse imaging of in vivo breast masses. Proc. IEEE Ultrasonics Symposium; 2004. pp. 728–731. Series 078038412. [Google Scholar]
- 14.Losa G, Alini M. Sulphated proteoglycans in the extracellular matrix of human breast tissues with infiltrating carcinoma. Int J Cancer. 1993;54:552–557. doi: 10.1002/ijc.2910540406. [DOI] [PubMed] [Google Scholar]
- 15.Sridhar M, Liu J, Insana M. Viscoelasticity imaging using ultrasound: parameters and error analysis. Phys Med Biol. 2007;52:2425–2443. doi: 10.1088/0031-9155/52/9/007. [DOI] [PMC free article] [PubMed] [Google Scholar]
- 16.Du H, Liu J, Barakat C, Insana M. Optimizing multicompression approaches to breast elasticity imaging. IEEE Trans Ultrason Ferroelectr Freq Control. 2006;53:90–99. doi: 10.1109/tuffc.2006.1588394. [DOI] [PMC free article] [PubMed] [Google Scholar]
- 17.Pellot-Barakat C, Frouin F, Herment A, Mai J, Lindfors K, Tsou J, Behren P, Insana M. A regularized approach for free-hand ultrasound elastography of breast lesions. Proc. IEEE ISBI; 2004. [Google Scholar]
- 18.Tschoegl N. Phenomenological Theory of Linear Viscoelastic Behavior. Springer; New York: 1989. [Google Scholar]
- 19.Sridhar M, Liu J, Insana M. Elasticity imaging of polymeric media. J Biomech Eng. 2007;129:259–272. doi: 10.1115/1.2540804. [DOI] [PMC free article] [PubMed] [Google Scholar]
- 20.Ferry J. Viscoelastic Properties of Polymers. 3. Wiley; New York: 1980. [Google Scholar]
- 21.Fung Y. Foundations of Solid Mechanics. Prentice-Hall; Englewood Cliffs, NJ: 1965. [Google Scholar]
- 22.Mow V, Kuei S, Lai W, Armstrong C. Biphasic creep and stress relaxation of articular cartilage in compression, theory and experiments. J Biomech Eng. 1980;102:73–84. doi: 10.1115/1.3138202. [DOI] [PubMed] [Google Scholar]
- 23.Szabo T, Wu J. A model for longitudinal and shear wave propagation in viscoelastic media. J Acoust Soc Am. 2000;107:2437–2446. doi: 10.1121/1.428630. [DOI] [PubMed] [Google Scholar]
- 24.Waters R, Mobley J, Miller J. Causality-imposed (Kramers-Kronig) relationships between attenuation and dispersion. IEEE Trans Ultrason Ferroelectr Freq Control. 2005;52:822–833. doi: 10.1109/tuffc.2005.1503968. [DOI] [PubMed] [Google Scholar]
- 25.Faulkner K, Chambers I, Hedley P, Thompson S. An instrument for monitoring the force applied by breast compression devices on mammography x-ray sets. Clin Phys Physiol Meas. 1989;10:177–180. doi: 10.1088/0143-0815/10/2/007. [DOI] [PubMed] [Google Scholar]
- 26.Han L, Noble J, Burcher M. A novel ultrasound indentation system for measuring biomechanical properties of in vivo soft tissue. Ultrasound Med Biol. 2003;29:813–823. doi: 10.1016/s0301-5629(02)00776-7. [DOI] [PubMed] [Google Scholar]
- 27.Madsen E, Frank G, Krouskop T, Varghese T, Kallel F, Ophir J. Tissue-mimicking oil-in-gelatin dispersions for use in heterogeneous elastography phantoms. Ultrason Imaging. 2000;25:17–38. doi: 10.1177/016173460302500102. [DOI] [PubMed] [Google Scholar]
- 28.Nightingale K, Soo M, Nightingale R, Trahey G. Acoustic radiation force impulse imaging: in vivo demonstration of clinical feasibility. Ultrasound Med Biol. 2002;28323:227–235. doi: 10.1016/s0301-5629(01)00499-9. [DOI] [PubMed] [Google Scholar]
- 29.Veis A. The Macromolecular Chemistry of Gelatin. Academic; New York: 1964. [Google Scholar]
- 30.Pezron I, Djabourov M. X-ray diffraction of gelatin fibers in the dry and swollen states. J Polym Sci. 1990;28:1823–1839. [Google Scholar]
- 31.Cameron I, Kanal K, Keener C, Fullerton G. A mechanistic view of the nonideal osmotic and motional behavior of intracellular water. Cell Biol Int. 1997;21:99–113. doi: 10.1006/cbir.1996.0123. [DOI] [PubMed] [Google Scholar]
- 32.Yakimets I, Wellner N, Smith A, Wilson R, Farhat I, Mitchell J. Mechanical properties with respect to water content of gelatin films in glassy state. Polymer. 2005;46:12777–12785. [Google Scholar]
- 33.Mak A. The apparent viscoelastic behavior of articular cartilage—the contributions from the intrinsic matrix viscoelasticity and interstitial fluid flows. J Biomech Eng. 1986;108:123–130. doi: 10.1115/1.3138591. [DOI] [PubMed] [Google Scholar]
- 34.DiSilvestro M, Zhu Q, Suh J. Biphasic poroviscoelastic simulation of the unconfined compression of articular cartilage: II—effect of variable strain rates. J Biomech Eng. 2001;123:198–200. doi: 10.1115/1.1351887. [DOI] [PubMed] [Google Scholar]


